After the weekly K update, Bitcoin is currently operating near the MA5 moving average, with the K-line showing a mix of bullish and bearish arrangements. The MACD indicator remains in a bearish divergence below the waterline, while the KDJ three lines are increasingly consolidating near the bottom, intensifying the market's upward surge and downward wash movements. Additionally, the TD indicator has reached TD7, with the current key resistance level on the weekly K chart around the 94,500 line. This position is also a critical strong resistance level above, which has not been effectively stabilized for a day. In terms of the overall direction, the bearish trend still dominates.
On the daily chart, Bitcoin is operating within a narrow oscillation range of the BOLL band. The current MACD is in a contracting state, and the KDJ three lines are running below the waterline. The short-term key resistance on the daily chart is around the 90,500 line. If the intraday rebound cannot effectively stabilize, Bitcoin will continue its downward trend.
On the 4-hour chart, the price is currently below the MA30 moving average, and the overall trend and indicators of the BOLL are leaning towards oscillation and decline. Looking at the hourly chart, Bitcoin has shown a slight rebound in sentiment in the short term. However, there is strong resistance in the 90,500-92,000 range above. If the intraday rebound cannot effectively stabilize, Bitcoin is expected to continue its oscillating downward trend, as the bearish trend still dominates. The lower support is still referenced around the 87,600-84,000 line. If the bearish trend breaks the first support, it will head towards the 84,000 line. Therefore, for the intraday to evening trend, my personal view is to maintain a short-term wave strategy, focusing on the rebound highs while supporting the lows.
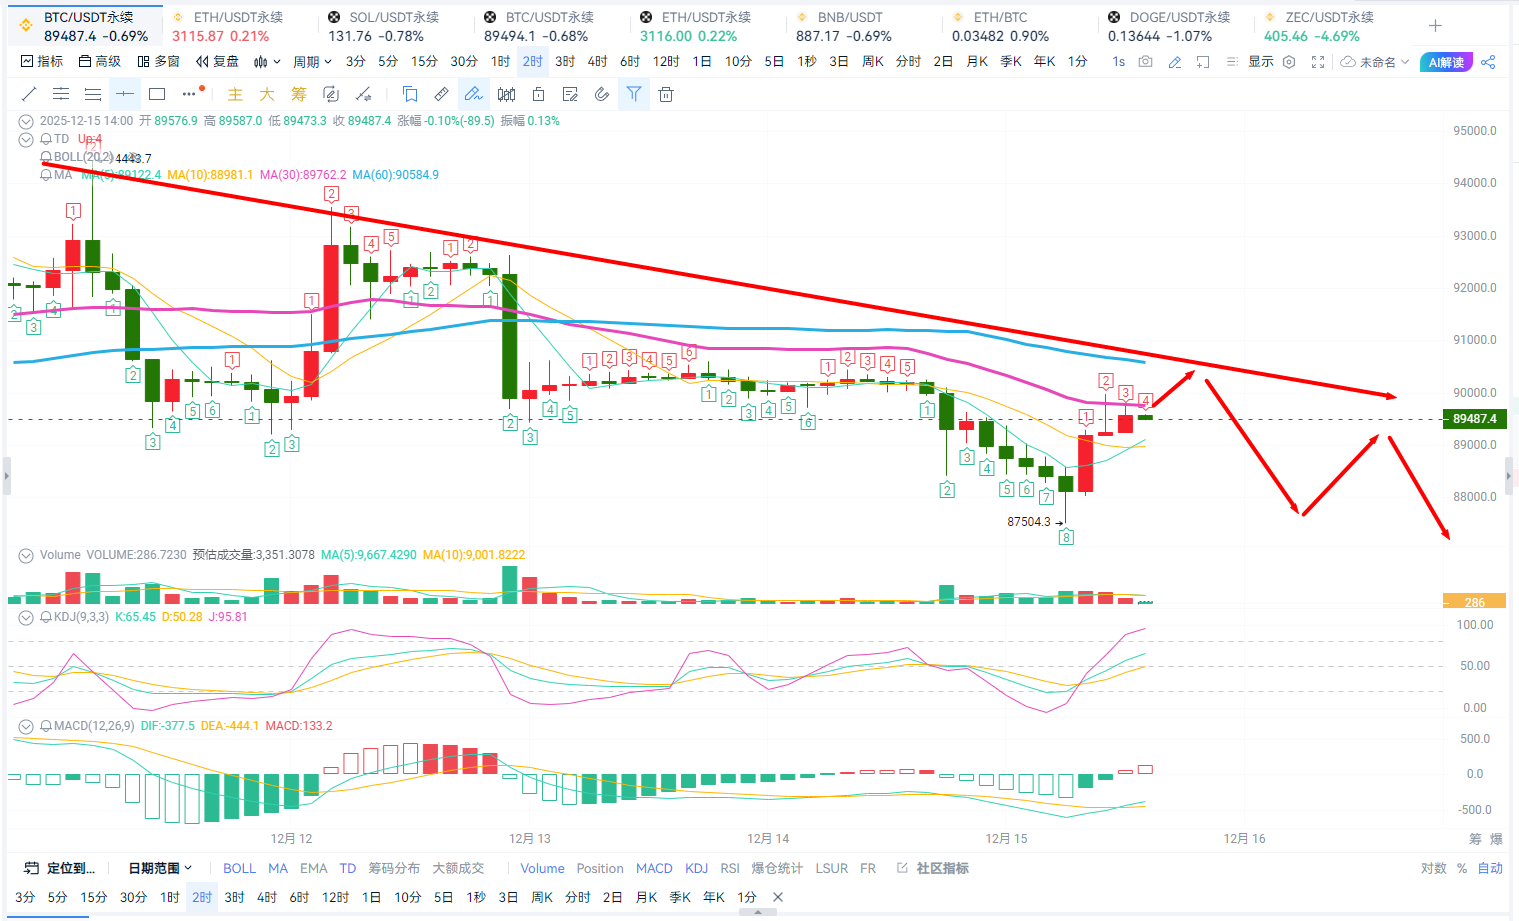
Trading Strategy: 90,200-90,800 for short positions. Target: 88,500-87,500. Stop loss: 91,200. For long positions, reference near the support level.
Ethereum's short-term trend is basically in sync with Bitcoin, with the high point resistance around the 3,150-3,180 area, which is also the current strong resistance above. If it cannot effectively stabilize, the price is expected to oscillate and decline. The lower support reference is around the 3,020-2,980 line. Therefore, for the intraday to evening trend, my personal view is to maintain a short-term wave strategy, focusing on the rebound highs while supporting the lows.
Trading Strategy: 3,140-3,170 for short positions. Target: 3,080-3,030. Stop loss: 3,190.
For long positions, reference near the support level. The current trend is expected to be sufficient, and I will continue to follow up.
This personal view is for reference only. There may be delays in article review and push notifications. The market changes rapidly, so specific entry and exit points should be based on real-time guidance. Please be cautious when entering the market. Analysis is not easy; I welcome everyone to like and follow the public account for surprises!

免责声明:本文章仅代表作者个人观点,不代表本平台的立场和观点。本文章仅供信息分享,不构成对任何人的任何投资建议。用户与作者之间的任何争议,与本平台无关。如网页中刊载的文章或图片涉及侵权,请提供相关的权利证明和身份证明发送邮件到support@aicoin.com,本平台相关工作人员将会进行核查。


