With the seven-day mean exchange inflow metric surging +6,894.01%, Shiba Inu just recorded one of its biggest on-chain spikes in months. Such a move would not occur without significant subsurface pressure. Whether this is a bullish ignition signal or just another warning sign embedded in a downward trend is the question. As of right now, the evidence points more toward a structural warning than a recovery catalyst.
Shiba Inu stays in free-fall
Let’s start with the price action: SHIB is still falling beneath the 50, 100 and 200 critical moving averages, all of which are angled downward. Every attempt at a bounce is promptly sold into. The chart is still locked in a distinct downtrend with lower highs and lower lows. This structure indicates exhaustion rallies inside a dominant bearish channel rather than accumulation. Any upward movement is noise rather than a change in trend until SHIB recovers at least the 50-day EMA and breaks above the cluster around $0.00095-$0.00105.
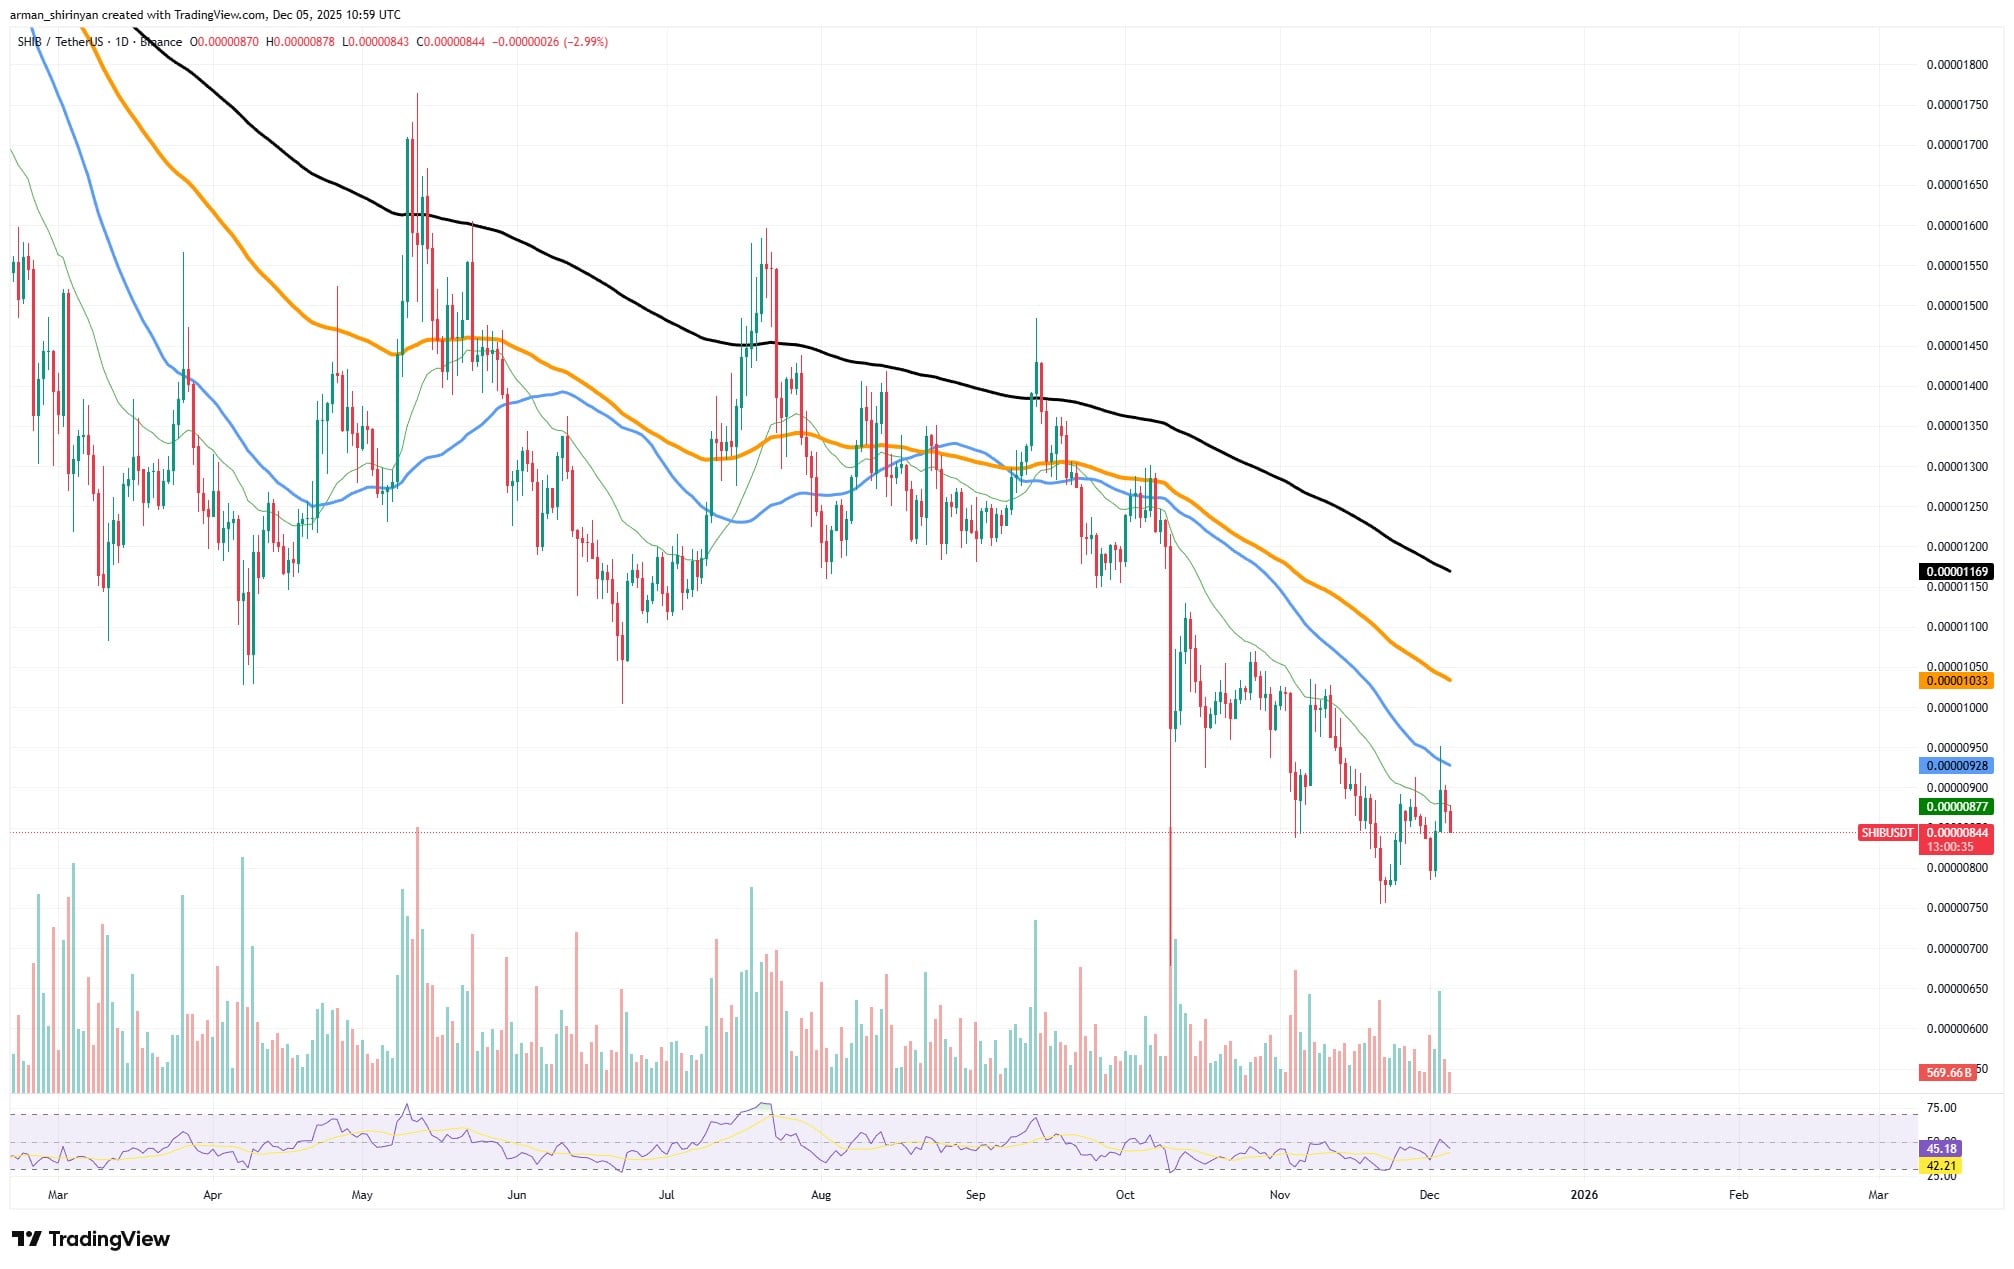
SHIB/USDT Chart by TradingView
The spike in on-chain flow verifies the issue. Generally speaking, a huge increase in inflow indicates that tokens are being sold on exchanges. This increase was not reflected in outflows. Exchange reserves are increasing, spot CVD is still weak and active addresses are unchanged. This combination suggests an increase, rather than a decrease, in sell-side liquidity. Large holders are either staying put or getting ready to sell rather than purchasing dips, because the top 10 wallets’ outflow is hardly moving.
HOT Stories Morning Crypto Report: Elon Musk's SpaceX Relocates $100 Million in Bitcoin, USD Stablecoin $1 Million Exploit, New Cloudflare Outage Takes Down CoinbaseXRP Hits Deepest Fear Levels Since October Crypto Market Prediction: 150% Shiba Inu (SHIB) Skyrocketing, Is Ethereum (ETH) Death Cross Cancelation Confirmed? Where's Bitcoin (BTC) Going to Stop: $93,000, $86,000 or Lower? Ripple Finalizes Acquisition of Treasury Management Giant GTreasury
Price decline continues
Another troubling aspect of the MA7 inflow chart is that inflows increase exactly when prices decline. It appears more like smaller holders sending SHIB to exchanges as panic protection, which typically precedes another leg down. That is classic capitulation behavior, but not the bullish kind where whales scoop the bottom.
You Might Also Like
Fri, 12/05/2025 - 11:06 XRP Not Leaving 1,000,000,000 Club: Fundamental Growth RecordedByArman Shirinyan
What will happen next? SHIB might retest the lows from November. The next logical target is $0.00075-$0.00070 if the selling pressure caused by this inflow spike materializes. This outlook could only be reversed by a persistent decline in exchange reserves and a break above the 50-day EMA. The signal is strong right now, but it is not bullish; rather, it is a warning that SHIB might not be finished bleeding.
免责声明:本文章仅代表作者个人观点,不代表本平台的立场和观点。本文章仅供信息分享,不构成对任何人的任何投资建议。用户与作者之间的任何争议,与本平台无关。如网页中刊载的文章或图片涉及侵权,请提供相关的权利证明和身份证明发送邮件到support@aicoin.com,本平台相关工作人员将会进行核查。


