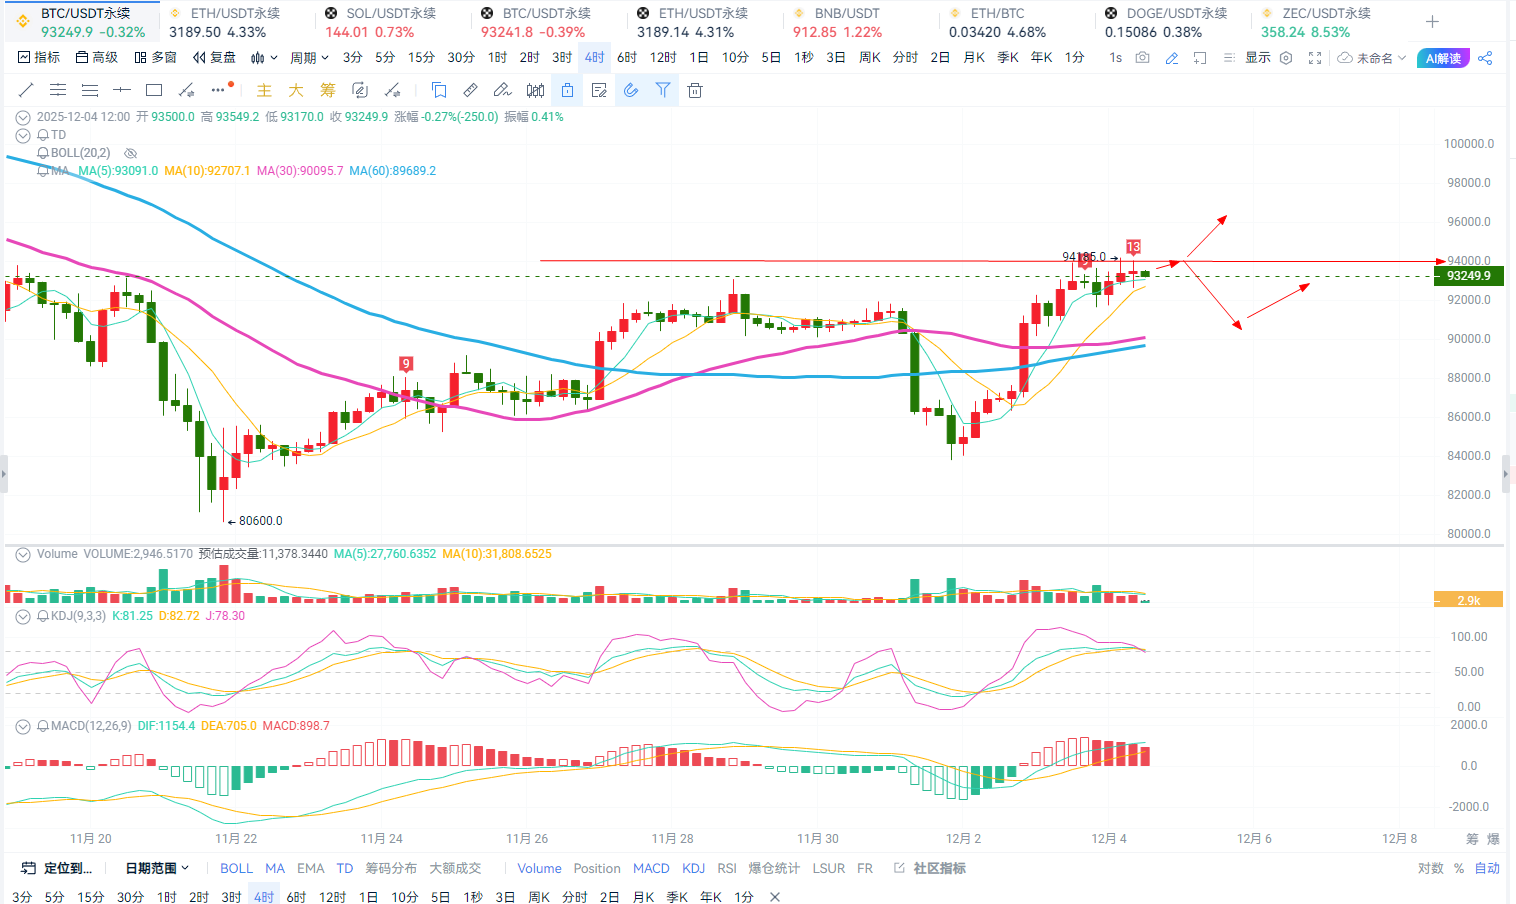
Yesterday, Bitcoin was positively influenced by news, and the bullish sentiment continued to ferment. After the price touched the weekly K MA5 moving average, it began to face pressure and retrace. Although the daily level showed a decent bullish rebound, the price gap of over 2000 between the price and the MA5 moving average, combined with the continuous pressure from the weekly K MA5 moving average, suggests that the price reference is around 94000. This position is also the current dividing line between bulls and bears. Stabilizing the weekly K trend is necessary to improve and reach the 98000-100000 range. If the price cannot stabilize above the 94000 resistance this week, the closing of the weekly K next week will likely continue the downward trend. After all, the current overall direction is still dominated by the bears.
On the 4-hour chart, the current price is slightly rising based on the MA5 moving average. The MACD and KDJ indicators are leaning towards bullish resonance, and the TD indicator has also reached TD13. The price has been suppressed by the weekly K MA5 moving average, indicating that there is strong resistance at the 94000 level. Looking at the hourly chart, the current intraday trend is leaning towards slight fluctuations and pullbacks, with support at the lower low around 91000-90000. A wave of pullback sentiment is expected during the day, and it is crucial to pay attention to the support below. If it cannot effectively break down, the price is expected to continue fluctuating around the 94000-90000 range for a few days. Therefore, regarding the intraday trend, my personal view is to maintain a short-term wave strategy, first high and then low.
Trading Strategy: Accumulate in batches at 93500-94500. Target: 91000-90000. Stop loss: 94800.
Long entry reference around 90000.
Ethereum's short-term trend is basically in sync with Bitcoin. The price has been fluctuating upward in the past two days, breaking through the weekly K MA5 moving average before retracing. The current high point resistance is around 3240-3280, and a wave of pullback sentiment is expected during the day, with support at the lower low around 3130-3100. Therefore, regarding the intraday trend, my personal view is to maintain a short-term wave strategy, taking a first high and then low approach.
Trading Strategy: Accumulate at 3210-3240. Target: 3150-3110. Stop loss: 3260.
Long entry reference around 3110.
The current trend is expected to be sufficient, and I will continue to follow up.
Personal views are for reference only. There may be delays in article review and push notifications, and the market changes rapidly. Specific entry and exit points should be based on real-time guidance. Please be cautious when entering the market. Analysis is not easy; feel free to like and follow the public account for surprises!

免责声明:本文章仅代表作者个人观点,不代表本平台的立场和观点。本文章仅供信息分享,不构成对任何人的任何投资建议。用户与作者之间的任何争议,与本平台无关。如网页中刊载的文章或图片涉及侵权,请提供相关的权利证明和身份证明发送邮件到support@aicoin.com,本平台相关工作人员将会进行核查。


