The bleeding in the crypto market isn’t stopping today. Bitcoin dropped 7%, Ethereum lost 9.52%, XRP tanked 9.4%, and Solana plummeted 10.35%. Not a single coin in the top 100 by market cap is in the green except for the lesser known Merlin Chain, which somehow climbed 34% while everything else burned.
The total crypto market cap fell as low as $2.89 trillion, down 7.22% in the last 24 hours. To put that in perspective: Bulls have surrendered all the territory they gained since April, and the market has lost nearly one-third of its value from October's peak of over $4 trillion.
So what the hell happened? In technical terms, the general crypto market is maintaining the trend and momentum typical of a big post-all-time high correction.
When it comes to the fundamentals, two major catalysts may have impacted prices as cryptocurrencies play a bigger role in the big portfolios. First, Japan's 10-year government bond yield surged to 1.84%—the highest level since April 2008. This rippled through Asian markets as the Nikkei plunged 3%, dragging down risk assets like crypto in a classic "risk-off" cascade. When Japanese bonds start offering higher yields, they suddenly become more attractive than risky bets on digital assets in the Asian markets.
Then there’s the other cascade: overleveraged positions in the crypto derivatives market that turns bulls into forced sellers. Just in the last 24 hours, the crypto market has seen almost $1 billion in liquidations—90% of which have been long positions (that is, traders betting on upside, though in this case being painfully wrong).
No wonder the Crypto Fear & Greed Index is at a mere 20 points—the most fearful the market has been since early April.
Bitcoin (BTC) price: Bulls losing grip on key support
Bitcoin opened today at around $90,369, hit a daily peak of just fifty bucks higher, then plunged to a low of $83,814 before settling around $84,913—a brutal 6% daily loss that follows a major dip after entering a death cross.
The current price of Bitcoin represents a medium-term support that BTC needs to respect, for bulls’ sake. Based on historical trading volume levels, if this support is broken, prices may dip to around $70,000—the price where most accumulation took place before this current support.
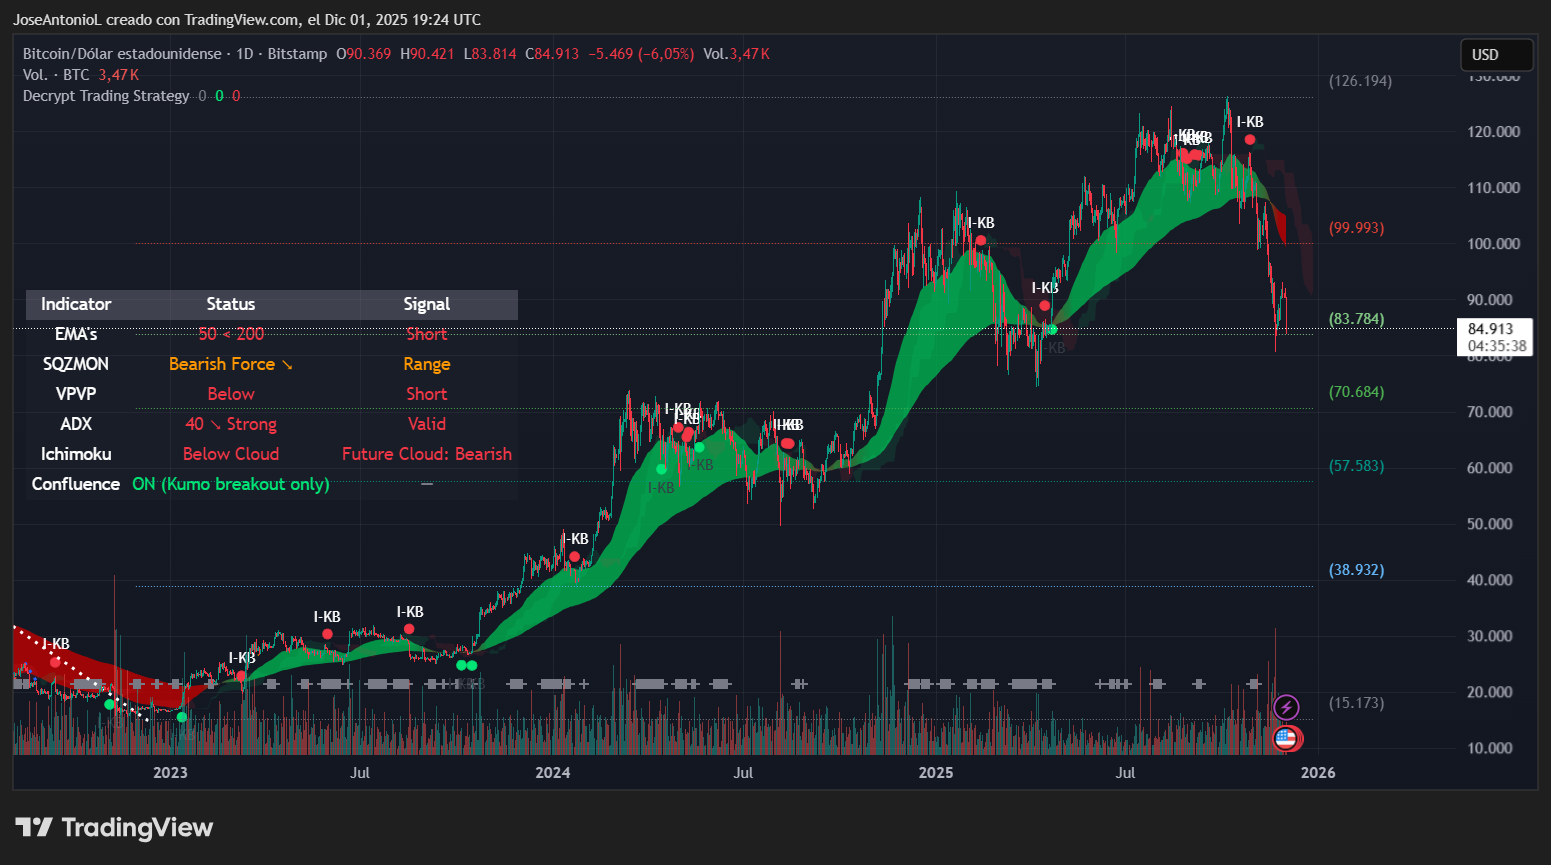
Bitcoin (BTC) price date. Image: Tradingview
The technical picture isn't pretty, and the exponential moving averages, or EMAs, explain why.
EMAs help traders identify trend direction by smoothing out price action—when the faster 50-day price average crosses below the slower 200-day average, it typically signals bearish momentum for the medium term. Right now, Bitcoin's 50-day EMA is below its 200-day EMA, flashing a short signal. And Bitcoin is currently trading well below both EMAs, indicating sellers are in control.
The Average Directional Index, or ADX, reads 40, which indicates a strong trend is in place. ADX measures trend strength regardless of direction on a scale from 0 to 100. Readings above 25 confirm a genuine trend is underway, and 40+ suggests powerful momentum. The problem? That momentum is currently pointing down.
The Squeeze Momentum Indicator shows that Bitcoin is currently on a bearish trend with no immediate chances of a bullish bounce.
Looking at the chart's Fibonacci retracement levels, Bitcoin is currently hovering around the $83,784 zone (marked on the right side of the chart above). The next support levels sit at $70,684, $57,583, and $38,932 if the crypto winter extends throughout 2026. The EMA readings on the chart show Bitcoin needs to reclaim the $90K level just to stabilize in the short term.
On Myriad, a prediction market built by Decrypt's parent company Dastan, market sentiment has flipped back and forth over the last day. At the moment, Myriad traders place 46% odds on Bitcoin falling all the way back down to $69K before ever hitting $100K again. Earlier today, those odds rose as high as 52%, but the trend is clear: Just yesterday, traders were still placing 72% odds on a bounce.
Ethereum (ETH) price: Even more bearish signals
Ethereum got hit harder than Bitcoin today. ETH opened at $2,991.7, inched upwards by just $6 and then crashed to a low of $2,716.4. The world’s biggest altcoin currently trades at around $2,733.2—an 8.65% daily loss.
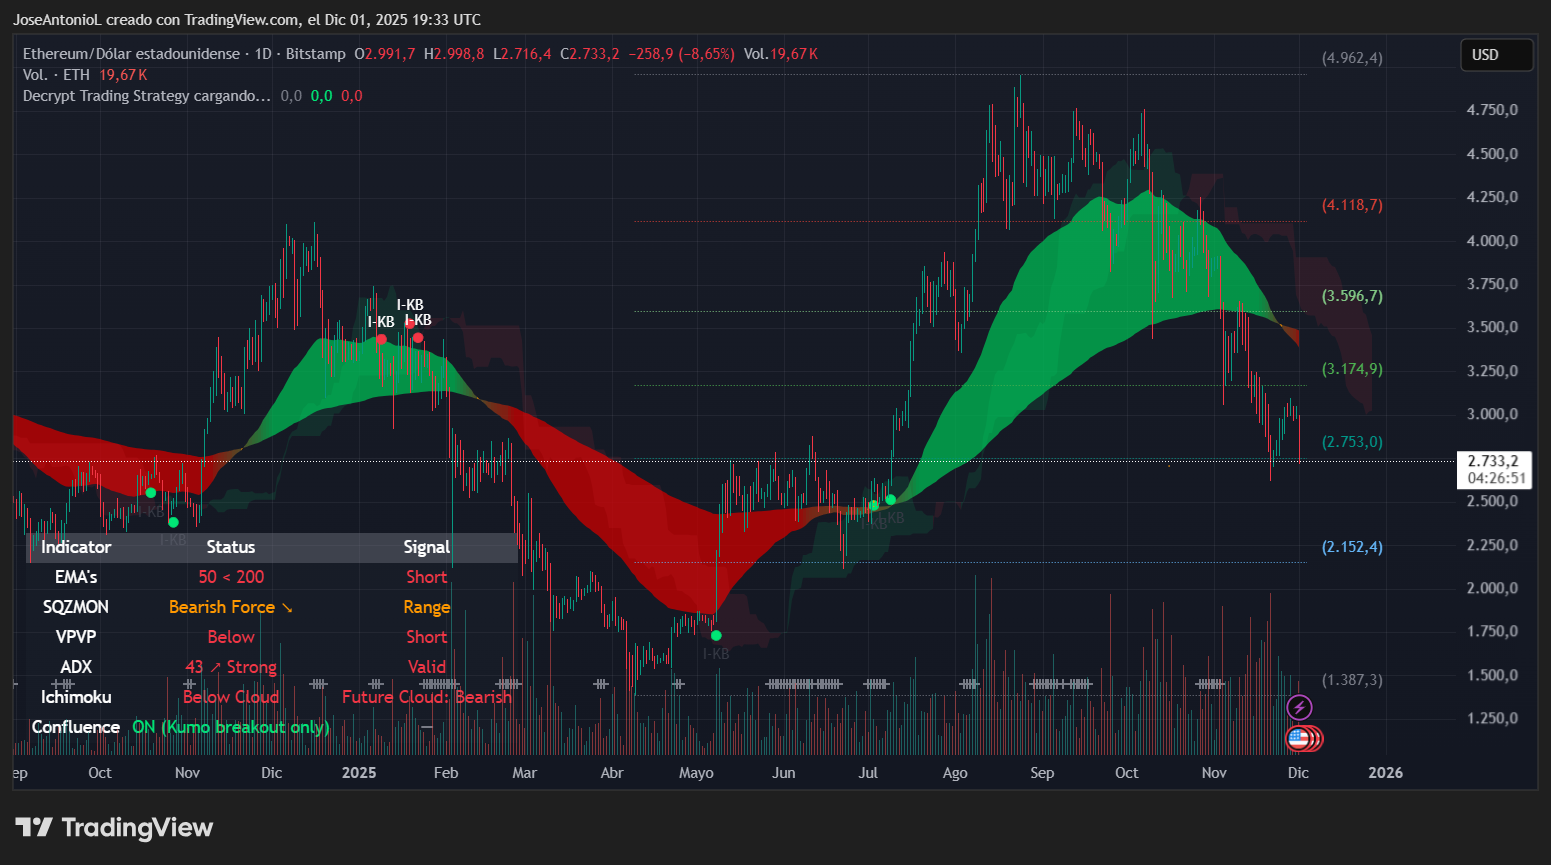
Ethereum (ETH) price date. Image: Tradingview
The technical indicators mirror Bitcoin's bearish setup but with even more concerning readings. The 50-day EMA sits below the 200-day EMA, confirming the short-term bearish trend. Ethereum is trading significantly below both moving averages, suggesting the path of least resistance remains down.
The ADX for Ethereum reads 43—even stronger than Bitcoin's 40—indicating powerful bearish momentum is in play. When ADX climbs above 40, it signals to traders that the current trend (in this case, down) has strong conviction behind it. The Squeeze Momentum Indicator shows Bearish Force in Range mode, identical to Bitcoin, meaning there could be a price fight as Ethereum reaches a key support.
Prediction market traders on Myriad are even more bearish on Ethereum than Bitcoin. Traders are currently placing odds at a whopping 75% that ETH continues to head down to $2.5K.
Both Bitcoin and Ethereum charts are screaming caution, but even amid this brutal performance, prediction market traders either don't believe this crypto winter will last, or don't think it will be particularly severe.
On Myriad, the market questioning whether "Crypto Winter is coming" has 87% of the money betting “no,” based on the criteria.
免责声明:本文章仅代表作者个人观点,不代表本平台的立场和观点。本文章仅供信息分享,不构成对任何人的任何投资建议。用户与作者之间的任何争议,与本平台无关。如网页中刊载的文章或图片涉及侵权,请提供相关的权利证明和身份证明发送邮件到support@aicoin.com,本平台相关工作人员将会进行核查。


