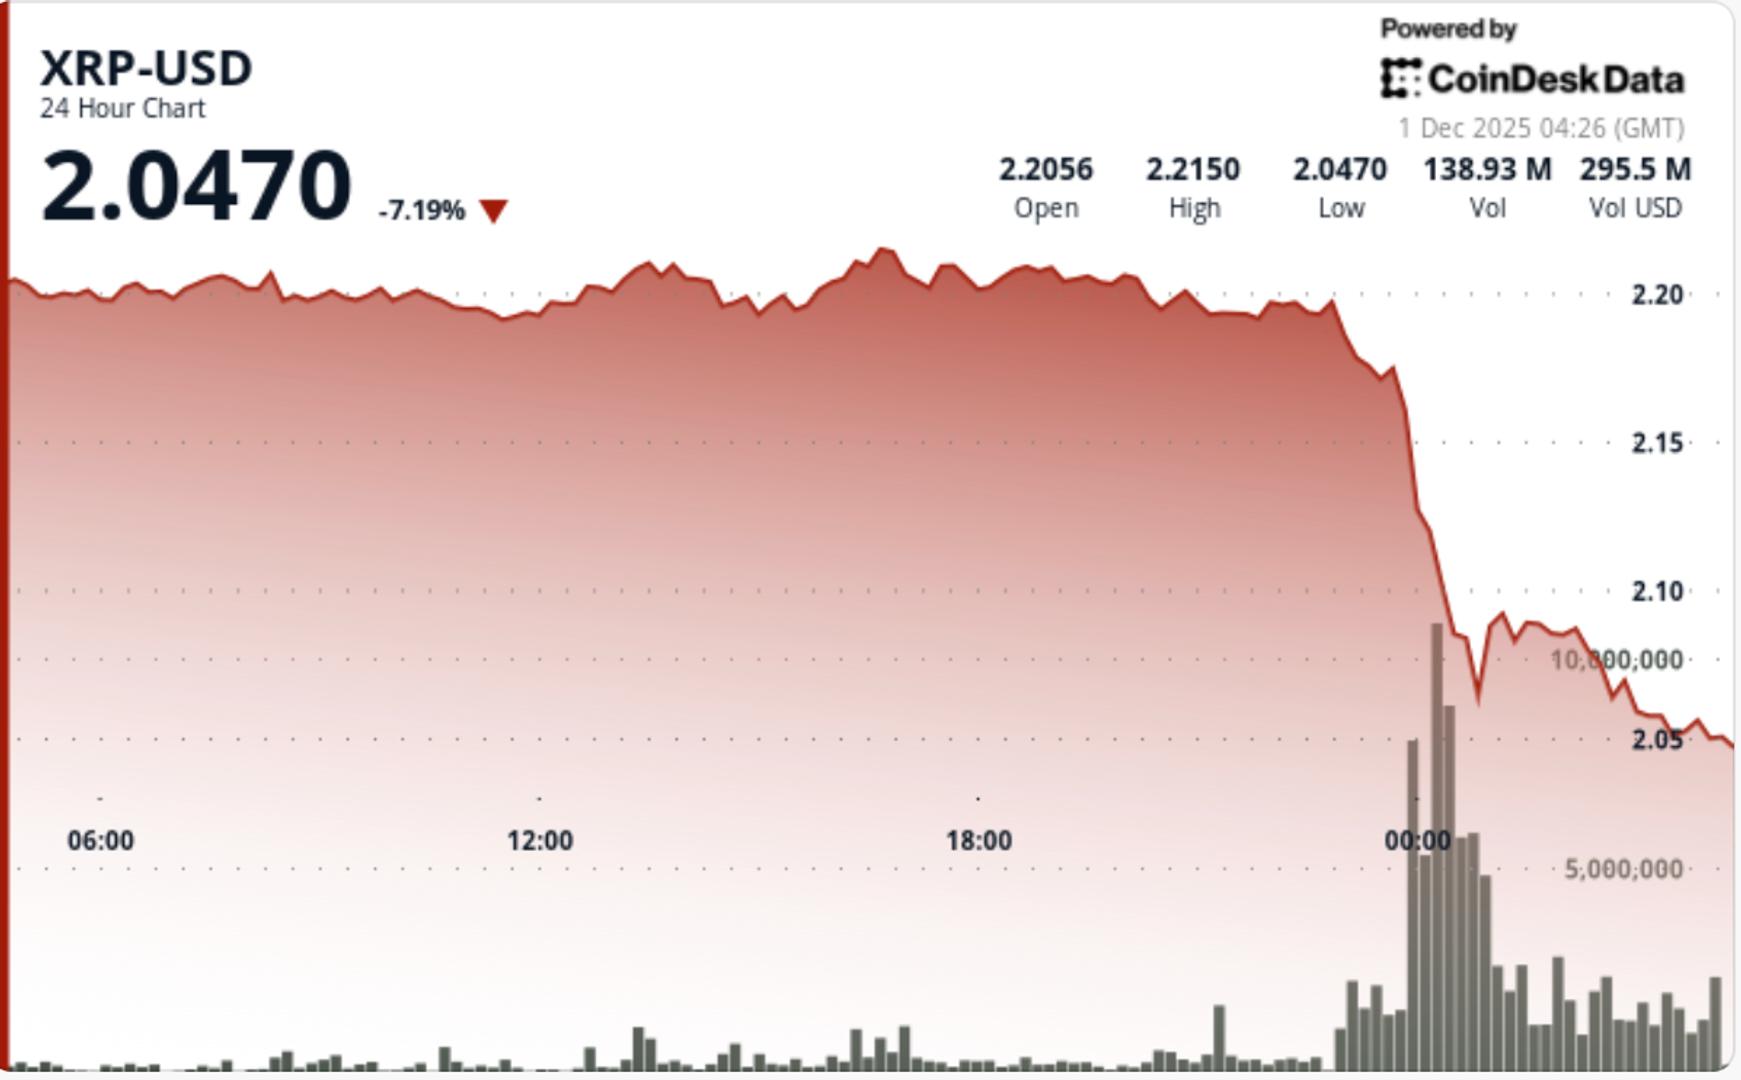
XRP plunged 7% to $2.05 as a violent wave of institutional selling broke through critical support levels, overpowering strong ETF inflows and forcing the token back into its November correction range.
News Background
• XRP spot ETF inflows reached $666.6M this month, led by 21Shares’ new TOXR listing
• Exchange supply dropped 45% over 60 days, showing large-scale accumulation
• Whale wallets added 150M XRP since Nov 25 despite the latest breakdown
• Selling pressure intensified Tuesday as risk assets weakened broadly
Despite expanding institutional infrastructure around XRP, short-term flows turned sharply bearish. ETF demand appeared unable to counter heavy derivatives unwind and large-lot selling through the afternoon session. Market liquidity thinned as broader crypto benchmarks softened, accelerating the downside.
Technical Analysis
The breakdown beneath $2.16 marked a decisive failure of XRP’s recent consolidation structure. That level served as a pivot during the last three weeks, making its loss a key signal that sellers regained momentum.
The move pushed XRP back into a descending channel defined by consecutive lower highs from $2.38, $2.30, and $2.22. The structure reflects increasing control by bears, with each bounce producing diminishing follow-through.
Volume confirmed the legitimacy of the breakdown—spiking to 309.2M, more than 4.6× the rolling average. This level of activity typically signals institutional exit flows rather than noise. Multiple intraday retests of $2.05—each accompanied by 3M+ spikes—showed buyers defending the psychological floor, but with no confirmed reversal.
Momentum indicators reflect deep short-term oversold conditions, yet not enough divergence to indicate a completed corrective wave. The $2.05–$2.00 zone remains pivotal; losing it exposes the larger November demand band between $1.80 and $1.87.
Price Action Summary
XRP fell from $2.21 to $2.05 during a steep 7.2% decline. The most aggressive selling occurred after $2.16 gave way, triggering cascading liquidations into the close. Volume surged to 309.2M—up 464% from the daily average—confirming intense distribution.
Hourly candles formed a descending channel with lower highs and tightening range behavior. Multiple failed recoveries near $2.12 indicated persistent sell pressure. Buyers repeatedly absorbed dips at $2.05 but without momentum strong enough to reclaim broken support.
What Traders Should Know
• Holding $2.05 is critical; a breakdown exposes $1.87–$1.80 next
• Reclaiming $2.16 is required to invalidate the bearish structure
• ETF inflows support long-term outlook, but short-term tape remains heavy
• Watch for bullish divergence on hourly RSI and MACD as early reversal signals
• A high-volume reclaim of $2.12–$2.16 would signal accumulation is resuming
免责声明:本文章仅代表作者个人观点,不代表本平台的立场和观点。本文章仅供信息分享,不构成对任何人的任何投资建议。用户与作者之间的任何争议,与本平台无关。如网页中刊载的文章或图片涉及侵权,请提供相关的权利证明和身份证明发送邮件到support@aicoin.com,本平台相关工作人员将会进行核查。