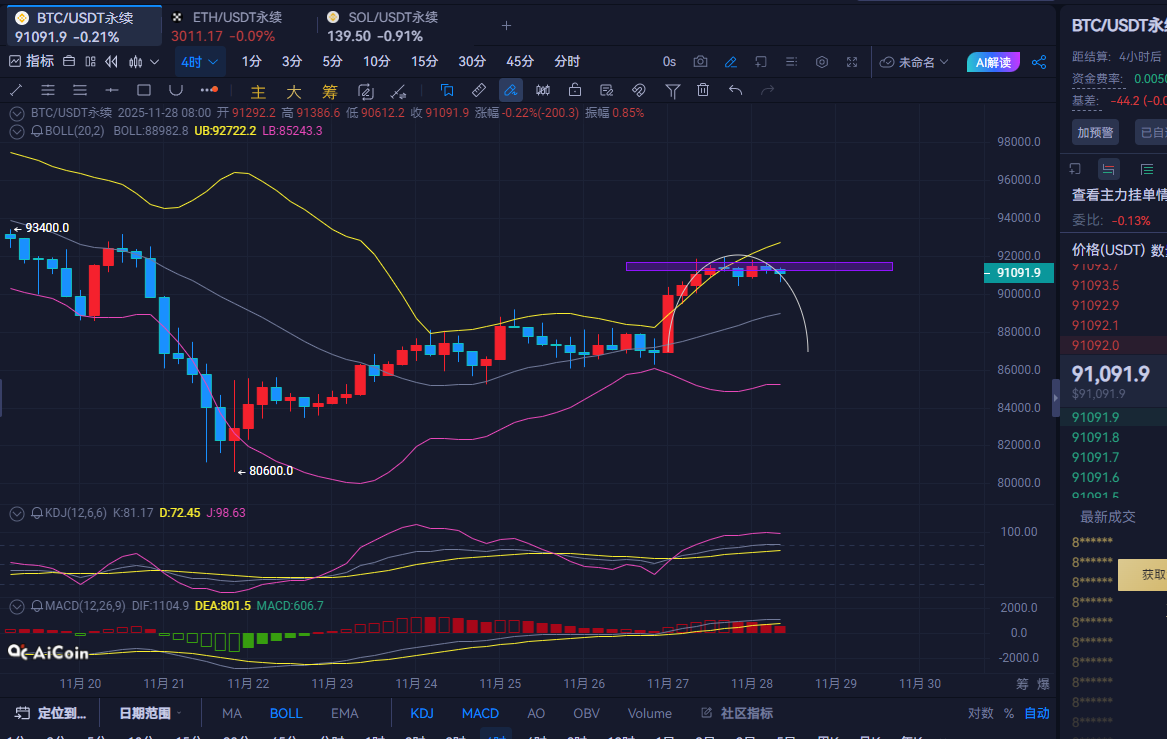
Bitcoin is currently fluctuating around $90,800. After a whole day of effort yesterday, the upward pressure at the resistance level of $92,000 was ineffective, and the price subsequently fell back. The technical indicators show that a three consecutive daily candlestick pattern has formed, and the MACD has issued a golden cross. Although the trend appears bullish, a long upper shadow has appeared on the 4-hour chart, and the daily chart has reached the pressure near the middle band of the Bollinger Bands. The trading volume is shrinking, and momentum is weakening, all indicating that there is selling pressure above.
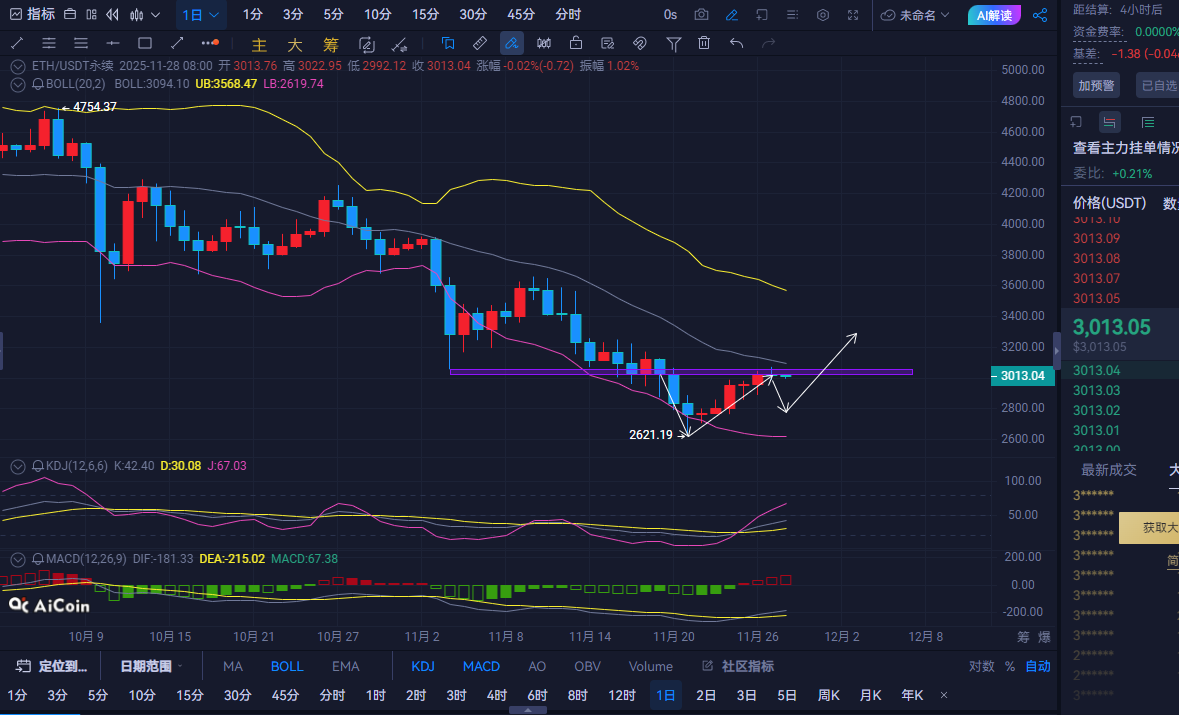
Ethereum is currently oscillating around $3,000, with the price reaching a high of about $3,070 before falling back. The current candlestick shows a slight rebound. On the daily chart, the market has reached the middle band of the Bollinger Bands. The EMA7 has crossed below the EMA30, and the RSI is below 50. The 4-hour Bollinger Bands are narrowing, and the MACD histogram is also continuously shortening, all indicating significant short-term pressure.
It is recommended to enter short positions for Bitcoin at the current price range of $91,000-$91,500, with targets around $89,100-$88,300.
It is recommended to enter short positions for Ethereum at the current price range of $3,010-$3,040, with targets around $2,960-$2,940.
免责声明:本文章仅代表作者个人观点,不代表本平台的立场和观点。本文章仅供信息分享,不构成对任何人的任何投资建议。用户与作者之间的任何争议,与本平台无关。如网页中刊载的文章或图片涉及侵权,请提供相关的权利证明和身份证明发送邮件到support@aicoin.com,本平台相关工作人员将会进行核查。