The market is in a weird spot, where a recovery is certainly possible, but the lack of volatility and liquidity is raising a lot of concerns regarding the future of the market. As holidays on the U.S. market conclude, we might see a spike of bearishness on the cryptocurrency market.
Bitcoin's recovery attempt
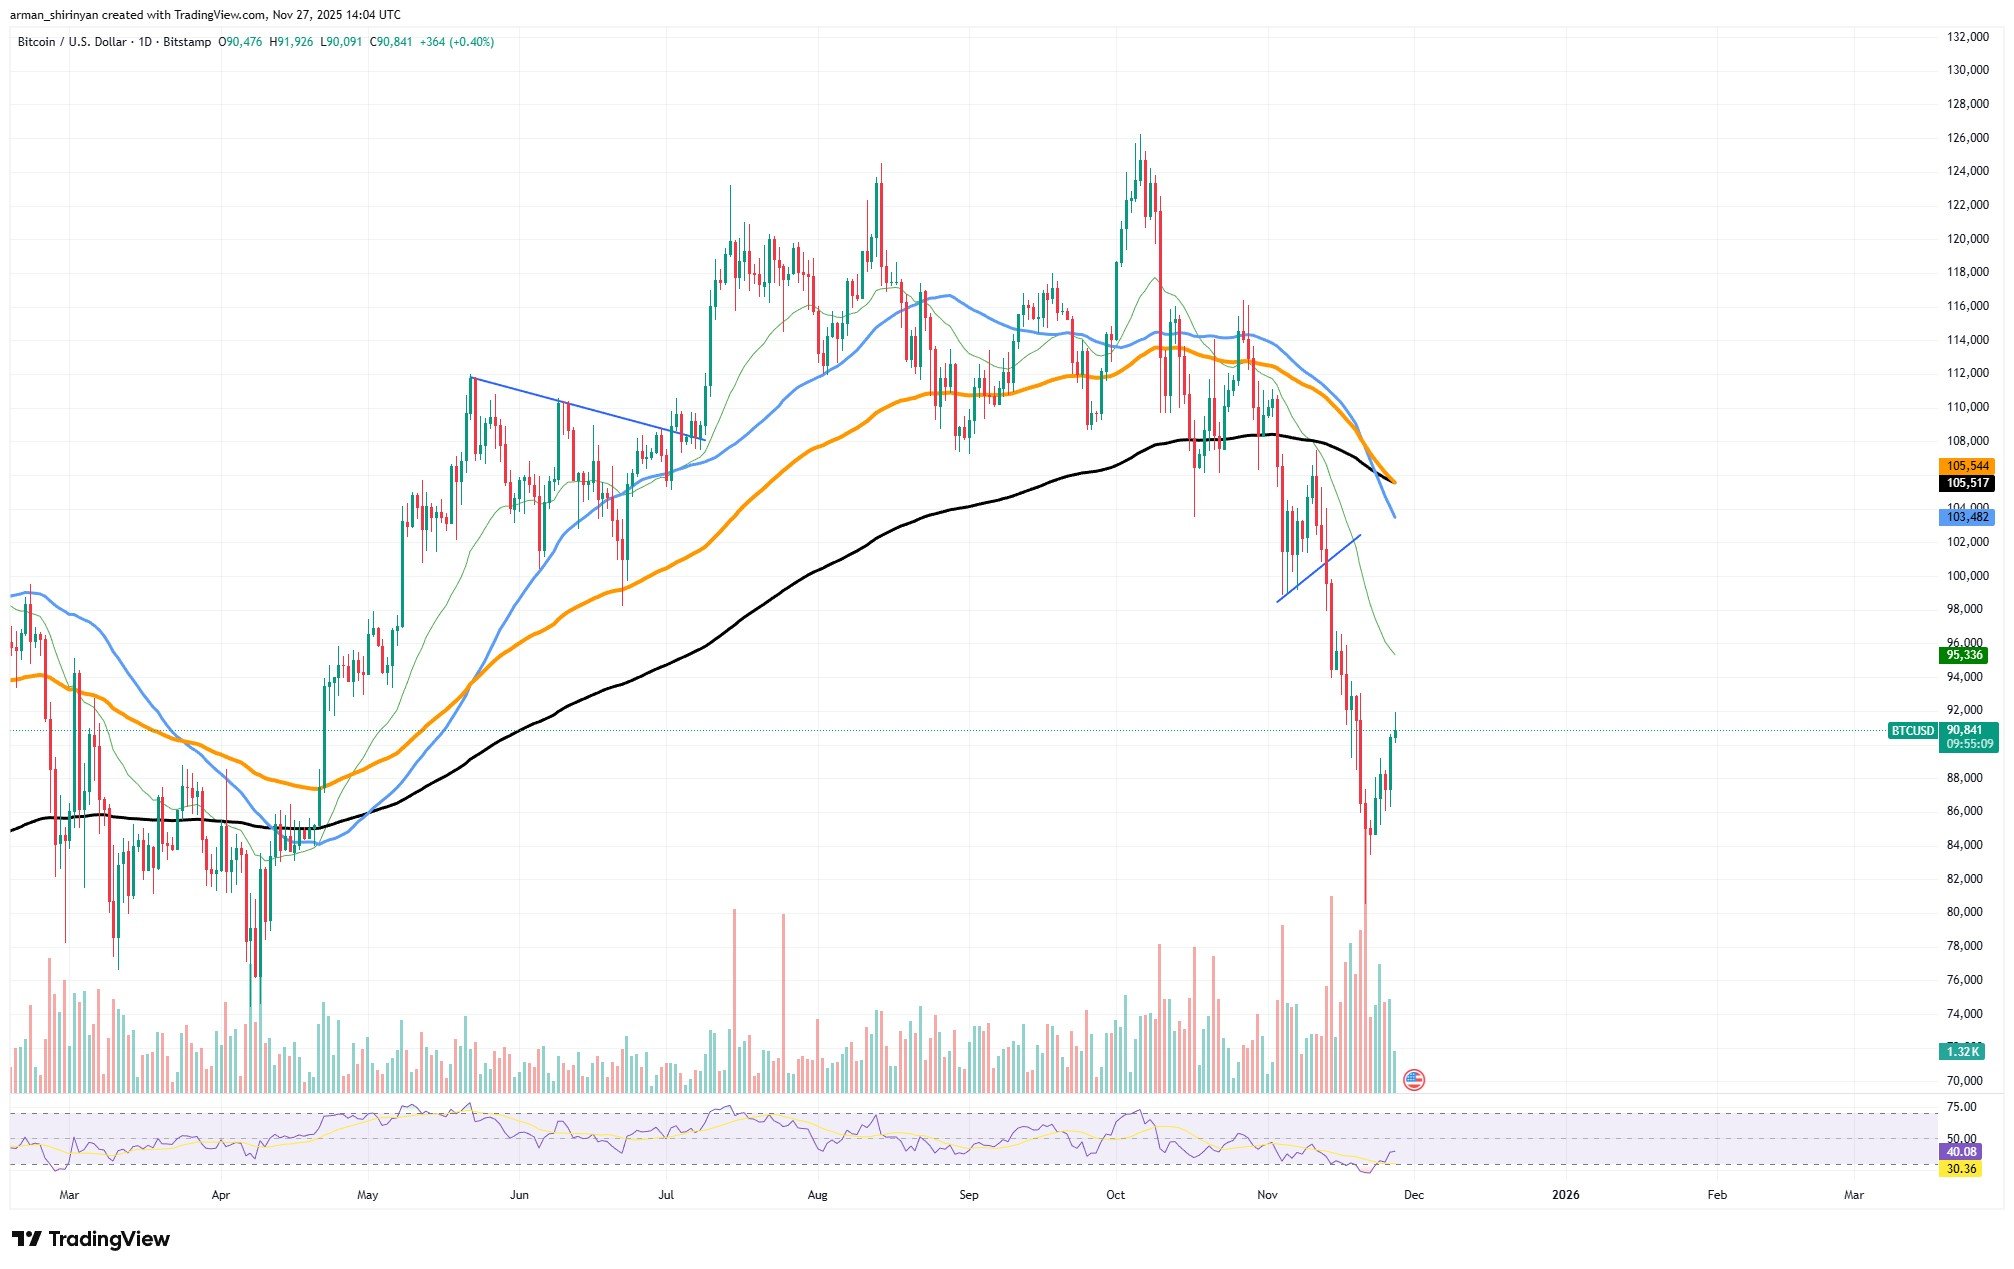
After a brutal breakdown in mid-November, Bitcoin has recovered, and the move off the lows is now exhibiting genuine intent rather than a dead-cat bounce. The price swiftly returned to the mid-$80,000s and momentum continued toward the $90,000 region, which is currently serving as a structurally significant point on the chart as well as a psychological barrier.
BTC/USDT Chart by TradingView
Technically speaking, the present recovery is valid. Extremely oversold conditions were brought about by the steep sell-off, and the recent increase in volume shows that buyers are not merely passive dip-collectors but are also prepared to push. The steady green volume bars over the past few sessions show that the flow is no longer dominated by panic exits, and the RSI has lifted off the floor, indicating improving momentum. However, it is not a soft ceiling.
HOT Stories Crypto Market Prediction: Can Bitcoin Break $90,000 on Recovery March? Shiba Inu (SHIB) Fresh Rally Starts, Is XRP Building Bullish Momentum?Coinbase's Armstrong Angers Bitcoin Maximalists by Praising Ethereum's ButerinShiba Inu (SHIB) Price to Remove Zero, XRP on Edge of 30% Breakout, Bitcoin (BTC) Prints Insane 36,380% Liquidation Imbalance – Crypto News DigestMorning Crypto Report: Is It Too Late to Buy Shiba Inu (SHIB)? Elon Musk's SpaceX Resumes Strange Bitcoin Activity, $1,000,000,000 Ripple Stablecoin Gains Traction in UAE
The 50-, 100- and 200-day EMAs are the three main moving averages that Bitcoin is still trading below, and they are all still on a steep decline. Recovering BTC is a multistep process, and the most recent breakdown pulled them below this entire cluster. Even when the short-term momentum is bullish, the structure's inertia is still bearish. The current price of $90,000 is where the first real challenge is located.
It makes sense for sellers to reappear at this level which served as support during the early stages of the decline. Nevertheless, the recovery push has been exceptionally powerful, and a breakout above $90,000 is very likely if buyers can maintain their pressure. The declining 50-EMA is waiting at $94,000-$96,000 if the daily close is clean and above $90,000. The real test will be that area; regaining it would change the discussion from relief rally to trend reversal attempt.
Shiba Inu's turning point
Shiba Inu is at a turning point where a new rally could start; the word "can" is important because the setup is encouraging but not certain. Following weeks of pressure and a clear structural decline, SHIB eventually recorded a series of higher lows along with a minor, but discernible, increase in buying volume. That is the first indication that sell-side fatigue may be beginning.
The price has now returned to the range of $0.0000085-$0.0000090, which has historically served as a short-term pivot. The market typically attempts at least a midsized recovery wave, and SHIB finds support here. Additionally, the RSI is rising from extremely oversold levels and is currently in the mid-40s, a neutral area that frequently precedes acceleration if buyers intervene forcefully.
You Might Also Like
Thu, 11/27/2025 - 11:14 Morning Crypto Report: Is It Too Late to Buy Shiba Inu (SHIB)? Elon Musk's SpaceX Resumes Strange Bitcoin Activity, $1,000,000,000 Ripple Stablecoin Gains Traction in UAEByGamza Khanzadaev
The actual opportunity, however, is a little bit higher. The declining 20-day EMA is getting closer to SHIB, and the 50- and 100-day EMAs are stacked downward just above it. The rally could pick up speed quickly if SHIB is able to break through this resistance-heavy cluster of moving averages. A period of grinding consolidation is followed by a sudden spike when liquidity flips, which is the same pattern we have frequently observed in prior SHIB cycles. Here, new inflows are completely feasible.
After recent volatility, the market is stabilizing, and once broader crypto confidence returns, meme assets usually function as high-beta plays. The next liquidity pockets are located at $0.0000095 and even $0.0000105 — if volume increases significantly from these levels.
Even so, nothing is certain. There is still a general downward trend. The 200-day EMA is angled downward and significantly higher than the current price, indicating that long-term sentiment has not changed. SHIB would swiftly return to the mid-$0.0000070s if the short-term EMAs are not regained.
XRP's underlying effort
Although XRP is making an effort to gain momentum, the chart indicates that the market is still caught between early signs of recovery and a more general bearish structure. Technically sound and clean was the bounce from the lower edge of the falling channel. Buyers firmly defended the $2.00-$2.10 range, which is precisely where XRP has historically experienced reactive demand. The current price is in the midchannel zone as a result of that reaction.
Momentum is increasing, at least temporarily. The RSI moved out of oversold territory and is currently moving in the direction of the mid-40s, which typically signals increased buyer activity if the price continues to rise. The volume during the bounce was also higher than usual; it was not a complete reversal spike, but it was sufficient to show that participants who had been sidelined had returned.
You Might Also Like
Thu, 11/27/2025 - 13:52 XRP Named Among Most Popular Cryptos on Major US Exchange: DetailsByTomiwabold Olajide
However, the ceiling above is significant. XRP is facing a group of declining moving averages that slope downward, including the 20-EMA, 50-EMA and 100-EMA. That is a classic indication that the market is still in a medium-term downward trend. Any bullish momentum is speculative until the price breaks through that compression zone, which is approximately between $2.30 and $2.50. While the asset is still respecting lower highs and a falling channel, we cannot declare a change in trend.
Two realistic scenarios should be anticipated by investors.
Persistence of momentum: The next area of interest is $2.50-$2.55, where the 50-EMA and horizontal resistance converge, if XRP moves above $2.36 (20-EMA) and holds. The channel is weakening, and buyers are gaining ground if there is a clean breakout above this zone. A more significant trend reversal may then begin to take shape.
The price will probably move back toward the channel midpoint, or even retest the lower boundary around $2.05-$2.10, if XRP is rejected around current levels. In that case, any recovery narrative is postponed, and the broader downtrend is maintained.
免责声明:本文章仅代表作者个人观点,不代表本平台的立场和观点。本文章仅供信息分享,不构成对任何人的任何投资建议。用户与作者之间的任何争议,与本平台无关。如网页中刊载的文章或图片涉及侵权,请提供相关的权利证明和身份证明发送邮件到support@aicoin.com,本平台相关工作人员将会进行核查。


