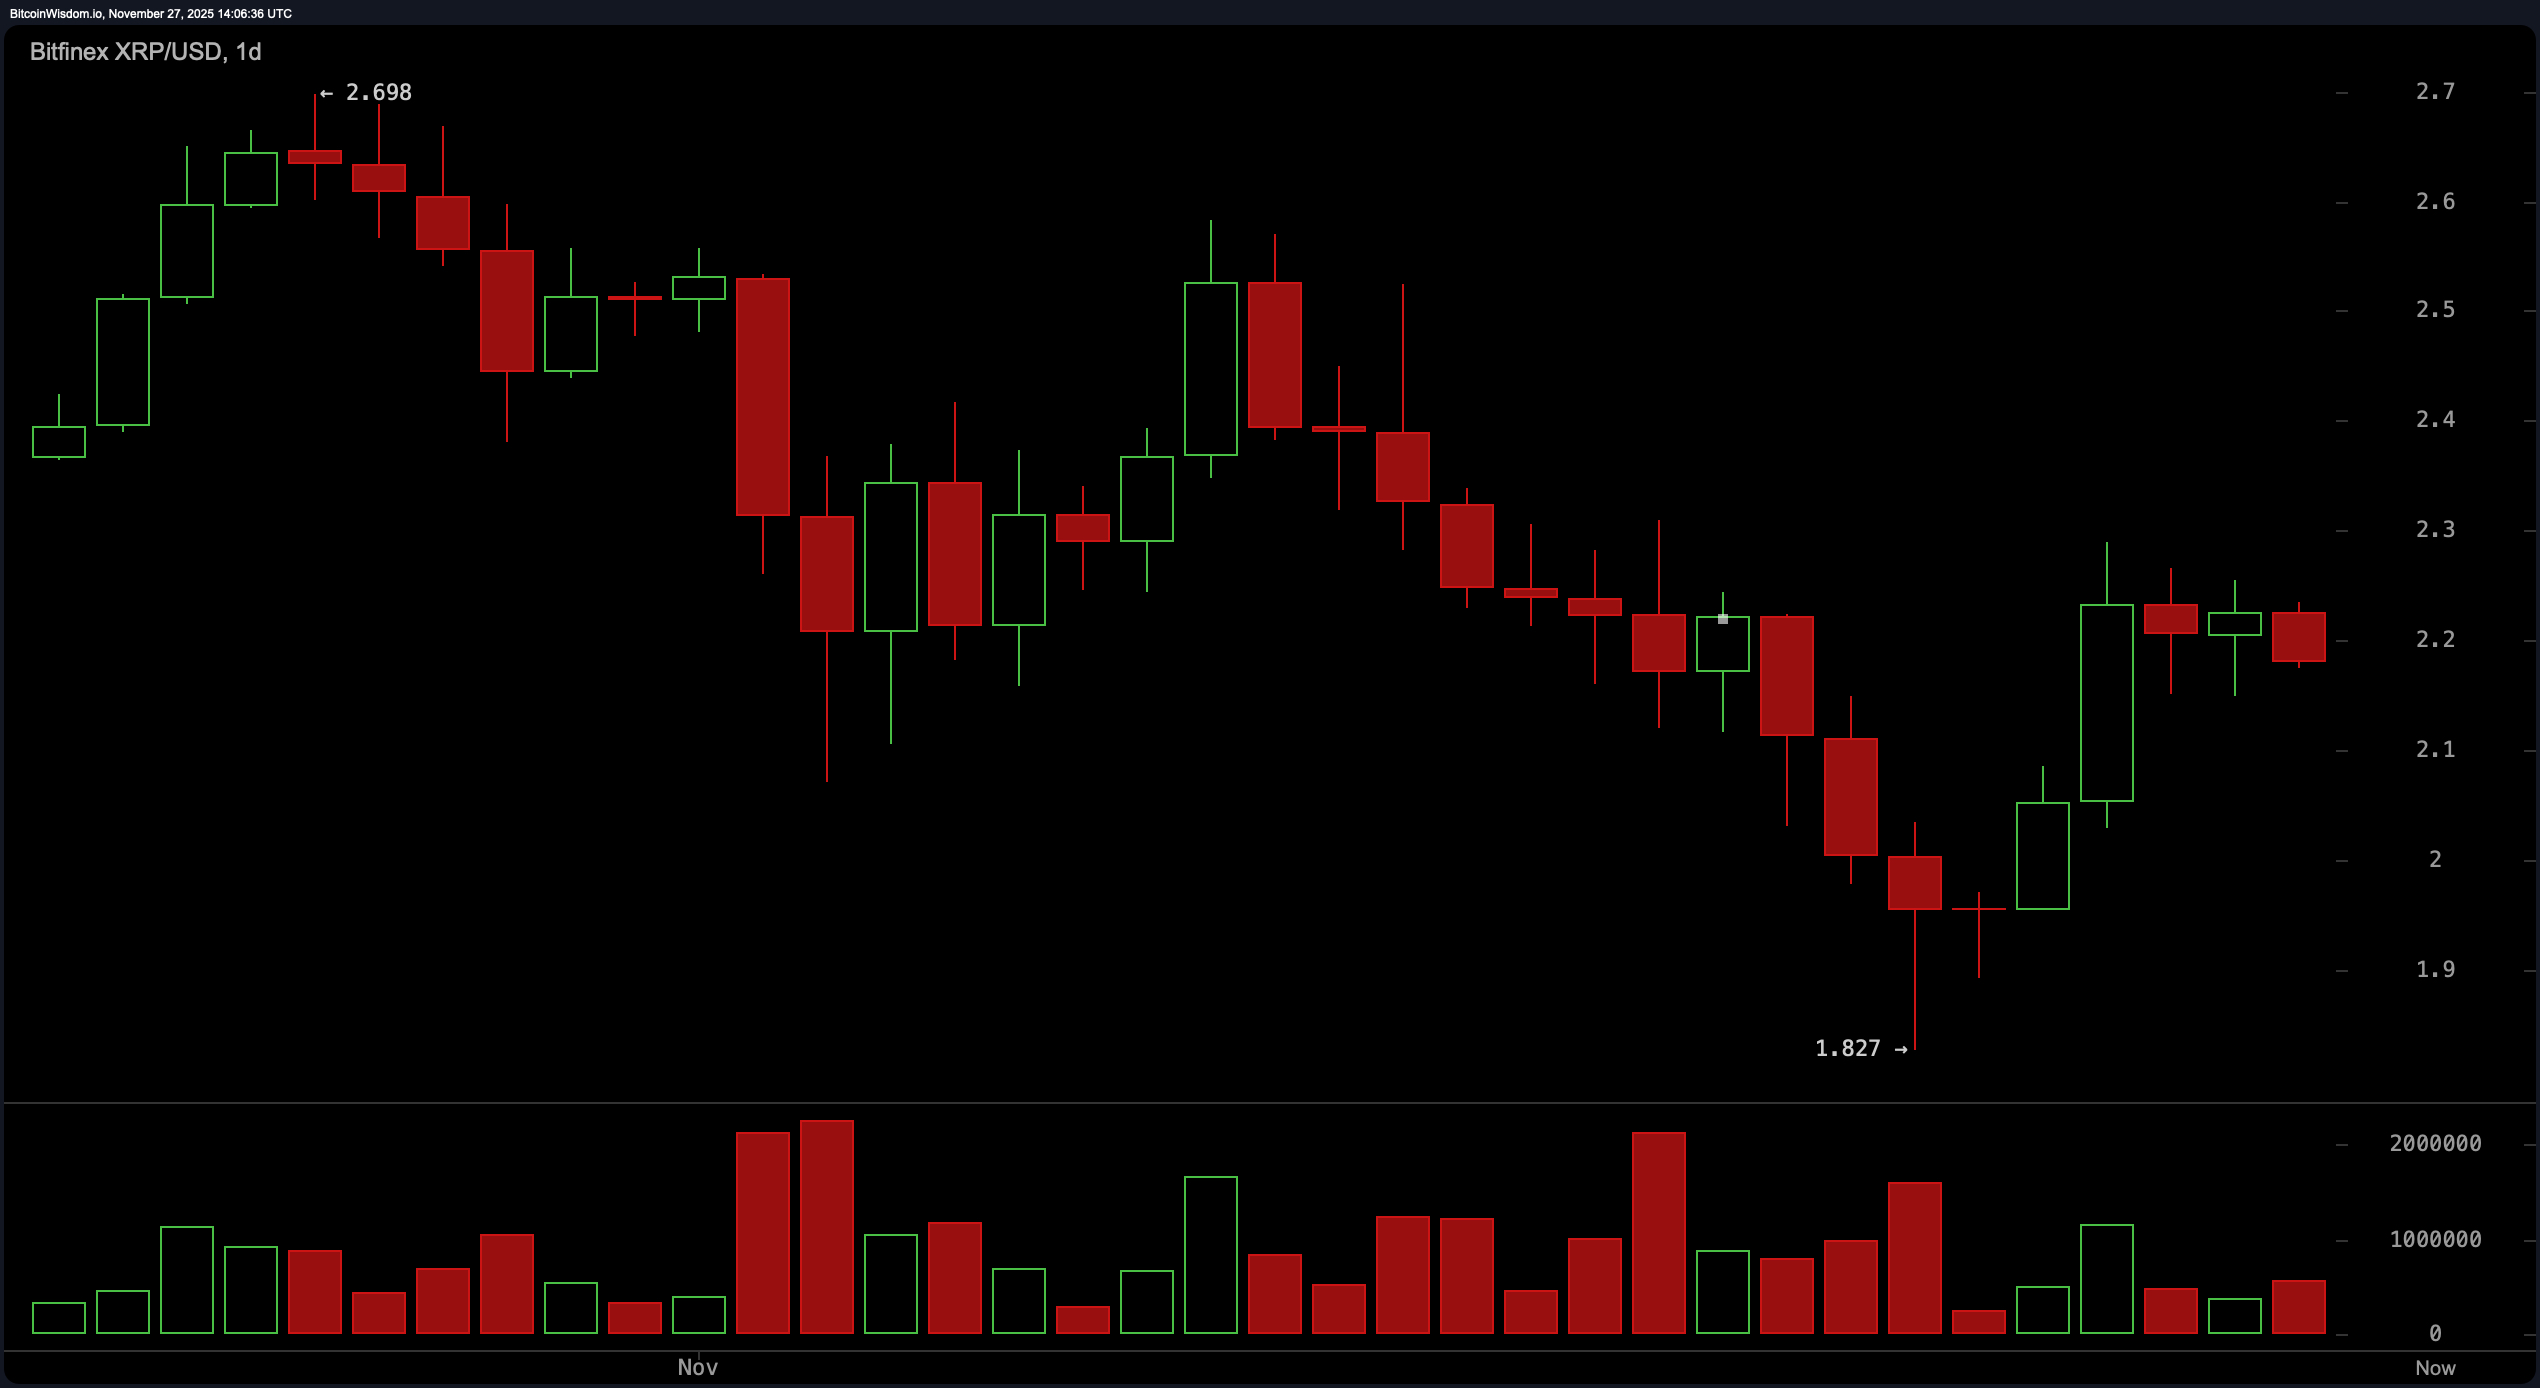
XRP’s broader structure on Nov. 27, 2025, reflects a market trying to shake off a corrective downswing while negotiating stubborn resistance zones across the higher time frames. The daily chart still carries the imprint of a downtrend, marked by lower highs extending from the $2.70 region and the capitulation low at $1.827, though a recovery back into the $2.20–$2.25 pocket suggests traders aren’t entirely ready to roll over.
A stall in this area, once support and now a firm ceiling, keeps momentum shoppers on edge, and while volume spikes near the lows signal interest, follow-through has been muted, leaving the daily bias leaning cautious. Support between $1.83 and $1.90 remains the fortress level to watch, with resistance set at $2.25 and then $2.40.

XRP/USD 1-day chart via Bitfinex on Nov. 27, 2025.
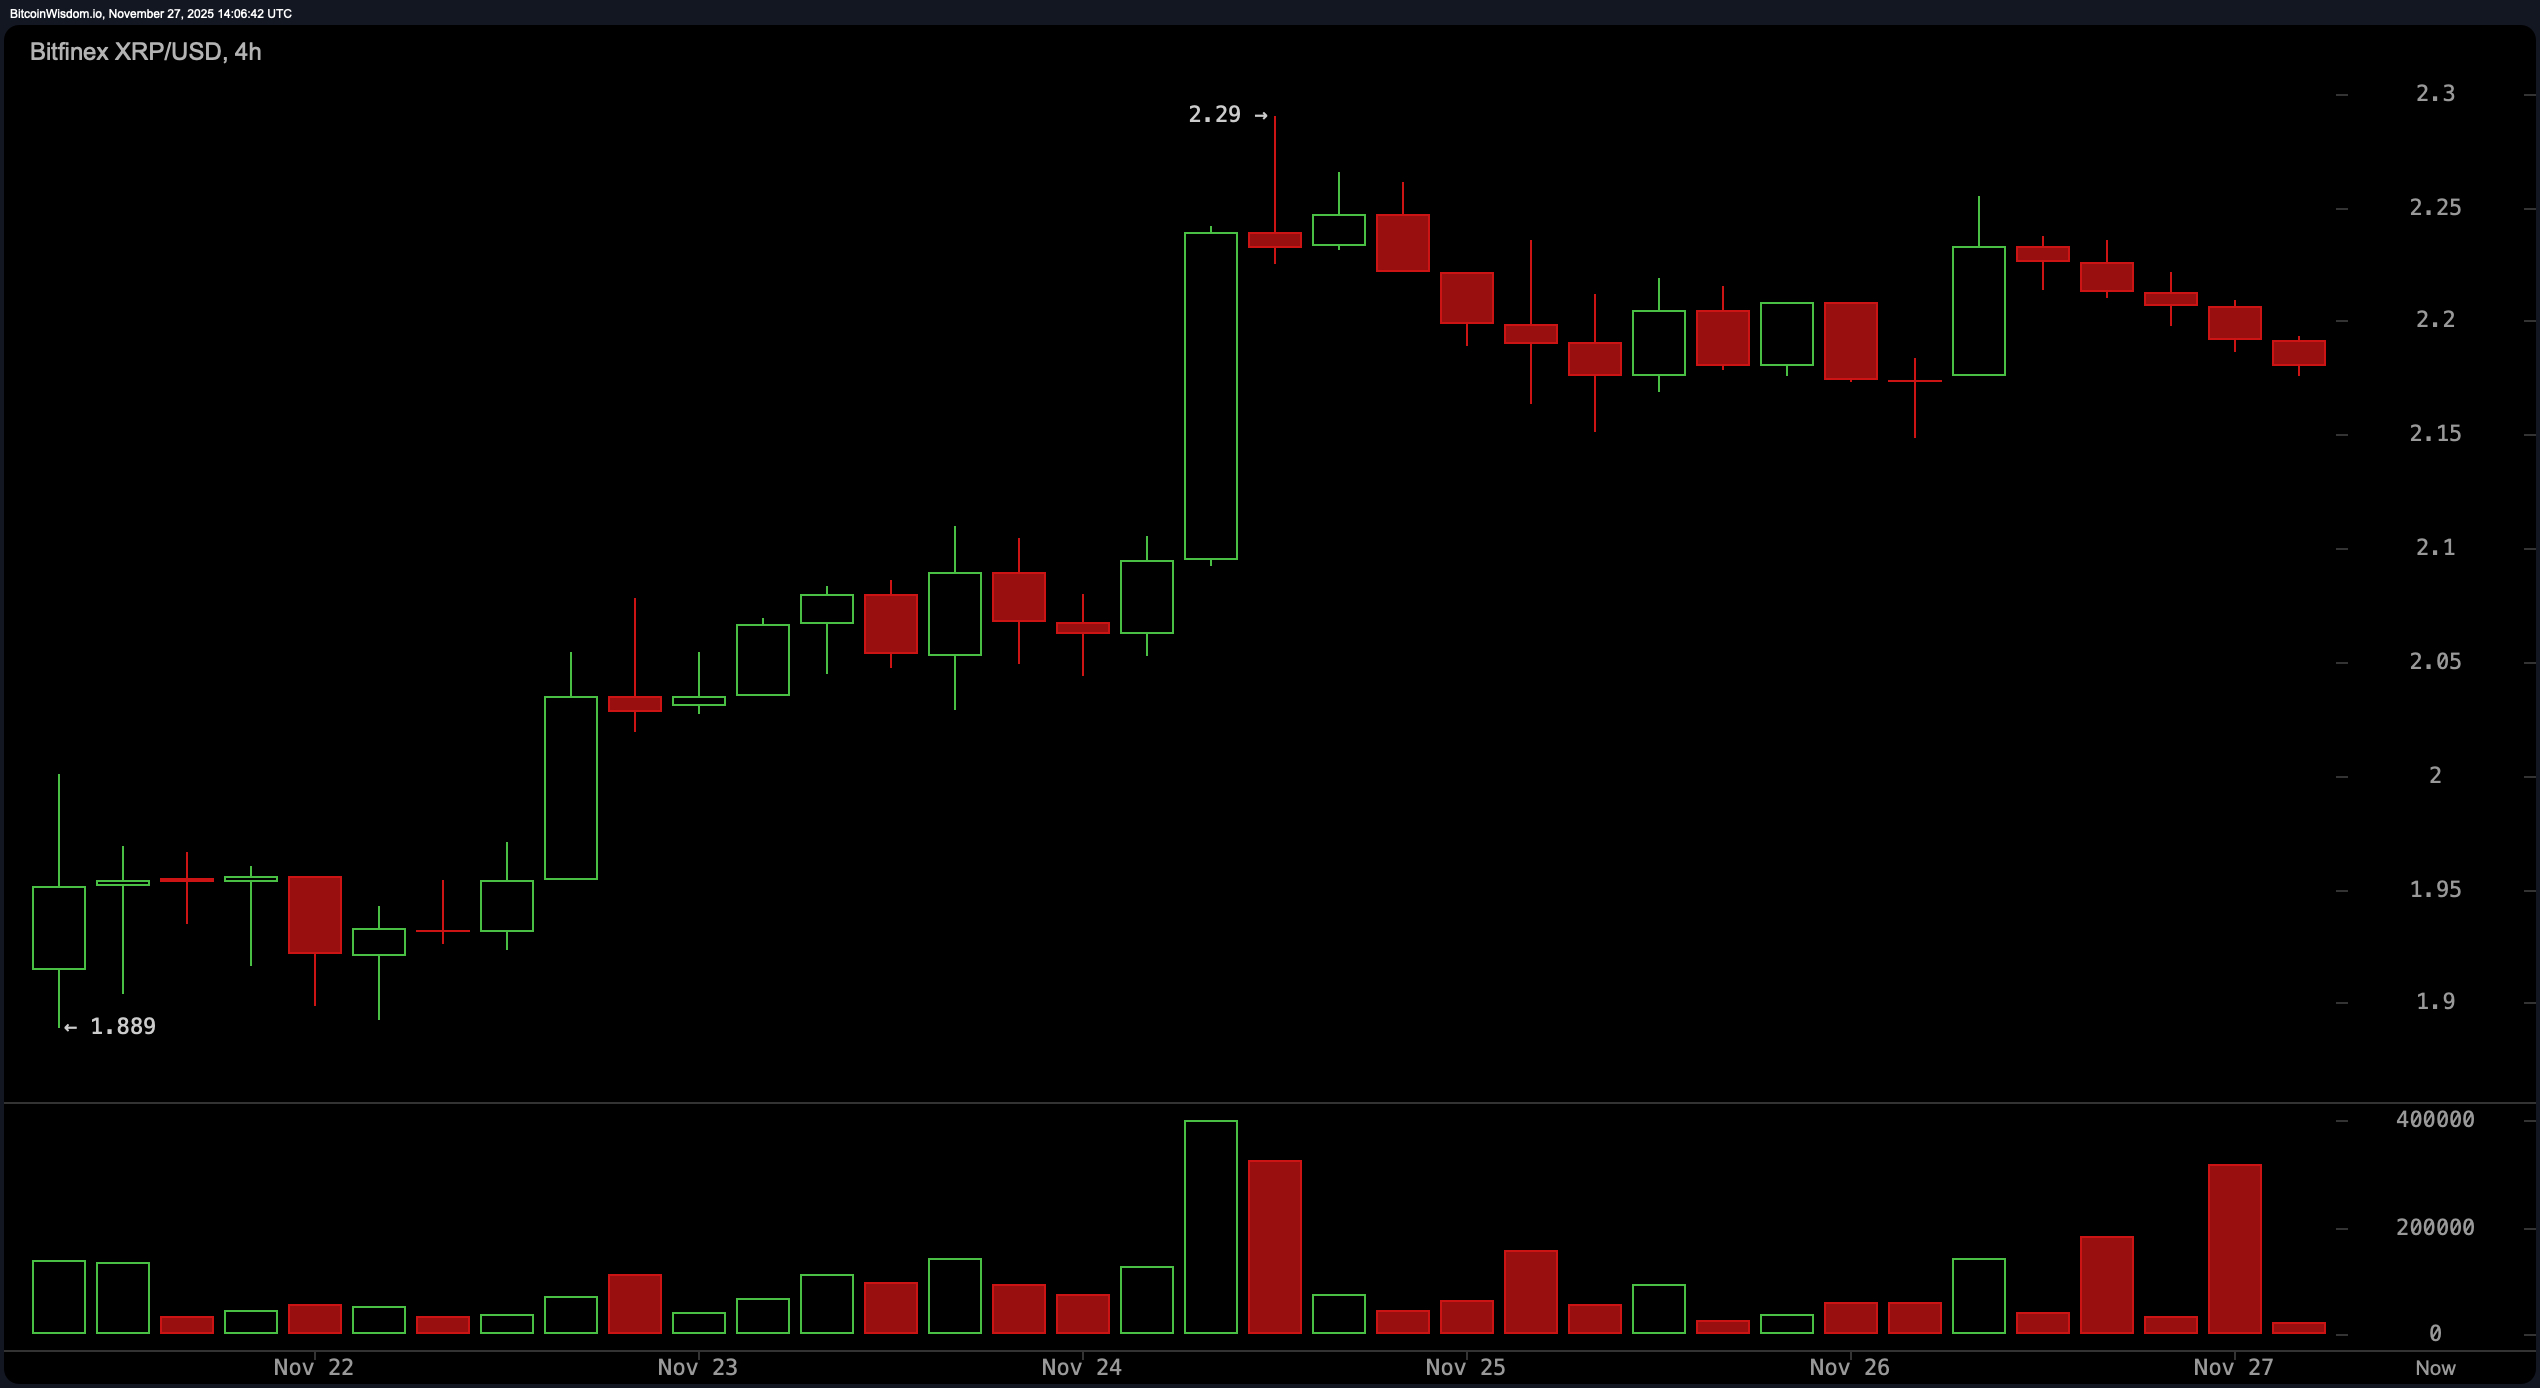
On the four-hour chart, XRP’s behavior shifts from heavy to tactically optimistic, with a mini-uptrend rising off the $1.889 low, followed by a push to $2.29 and a slow, steady fade. The decline isn’t chaotic — more like traders quietly leaving the party to beat the traffic. Price now lingers just under $2.20, and reclaiming $2.21–$2.25 is essential before the chart earns any real upward narrative. Support between $2.12 and $2.15 remains active, while resistance continues to clamp down from $2.21 upward. A flip of that level is the gateway to revisiting the highs.

XRP/USD 4-hour chart via Bitfinex on Nov. 27, 2025.
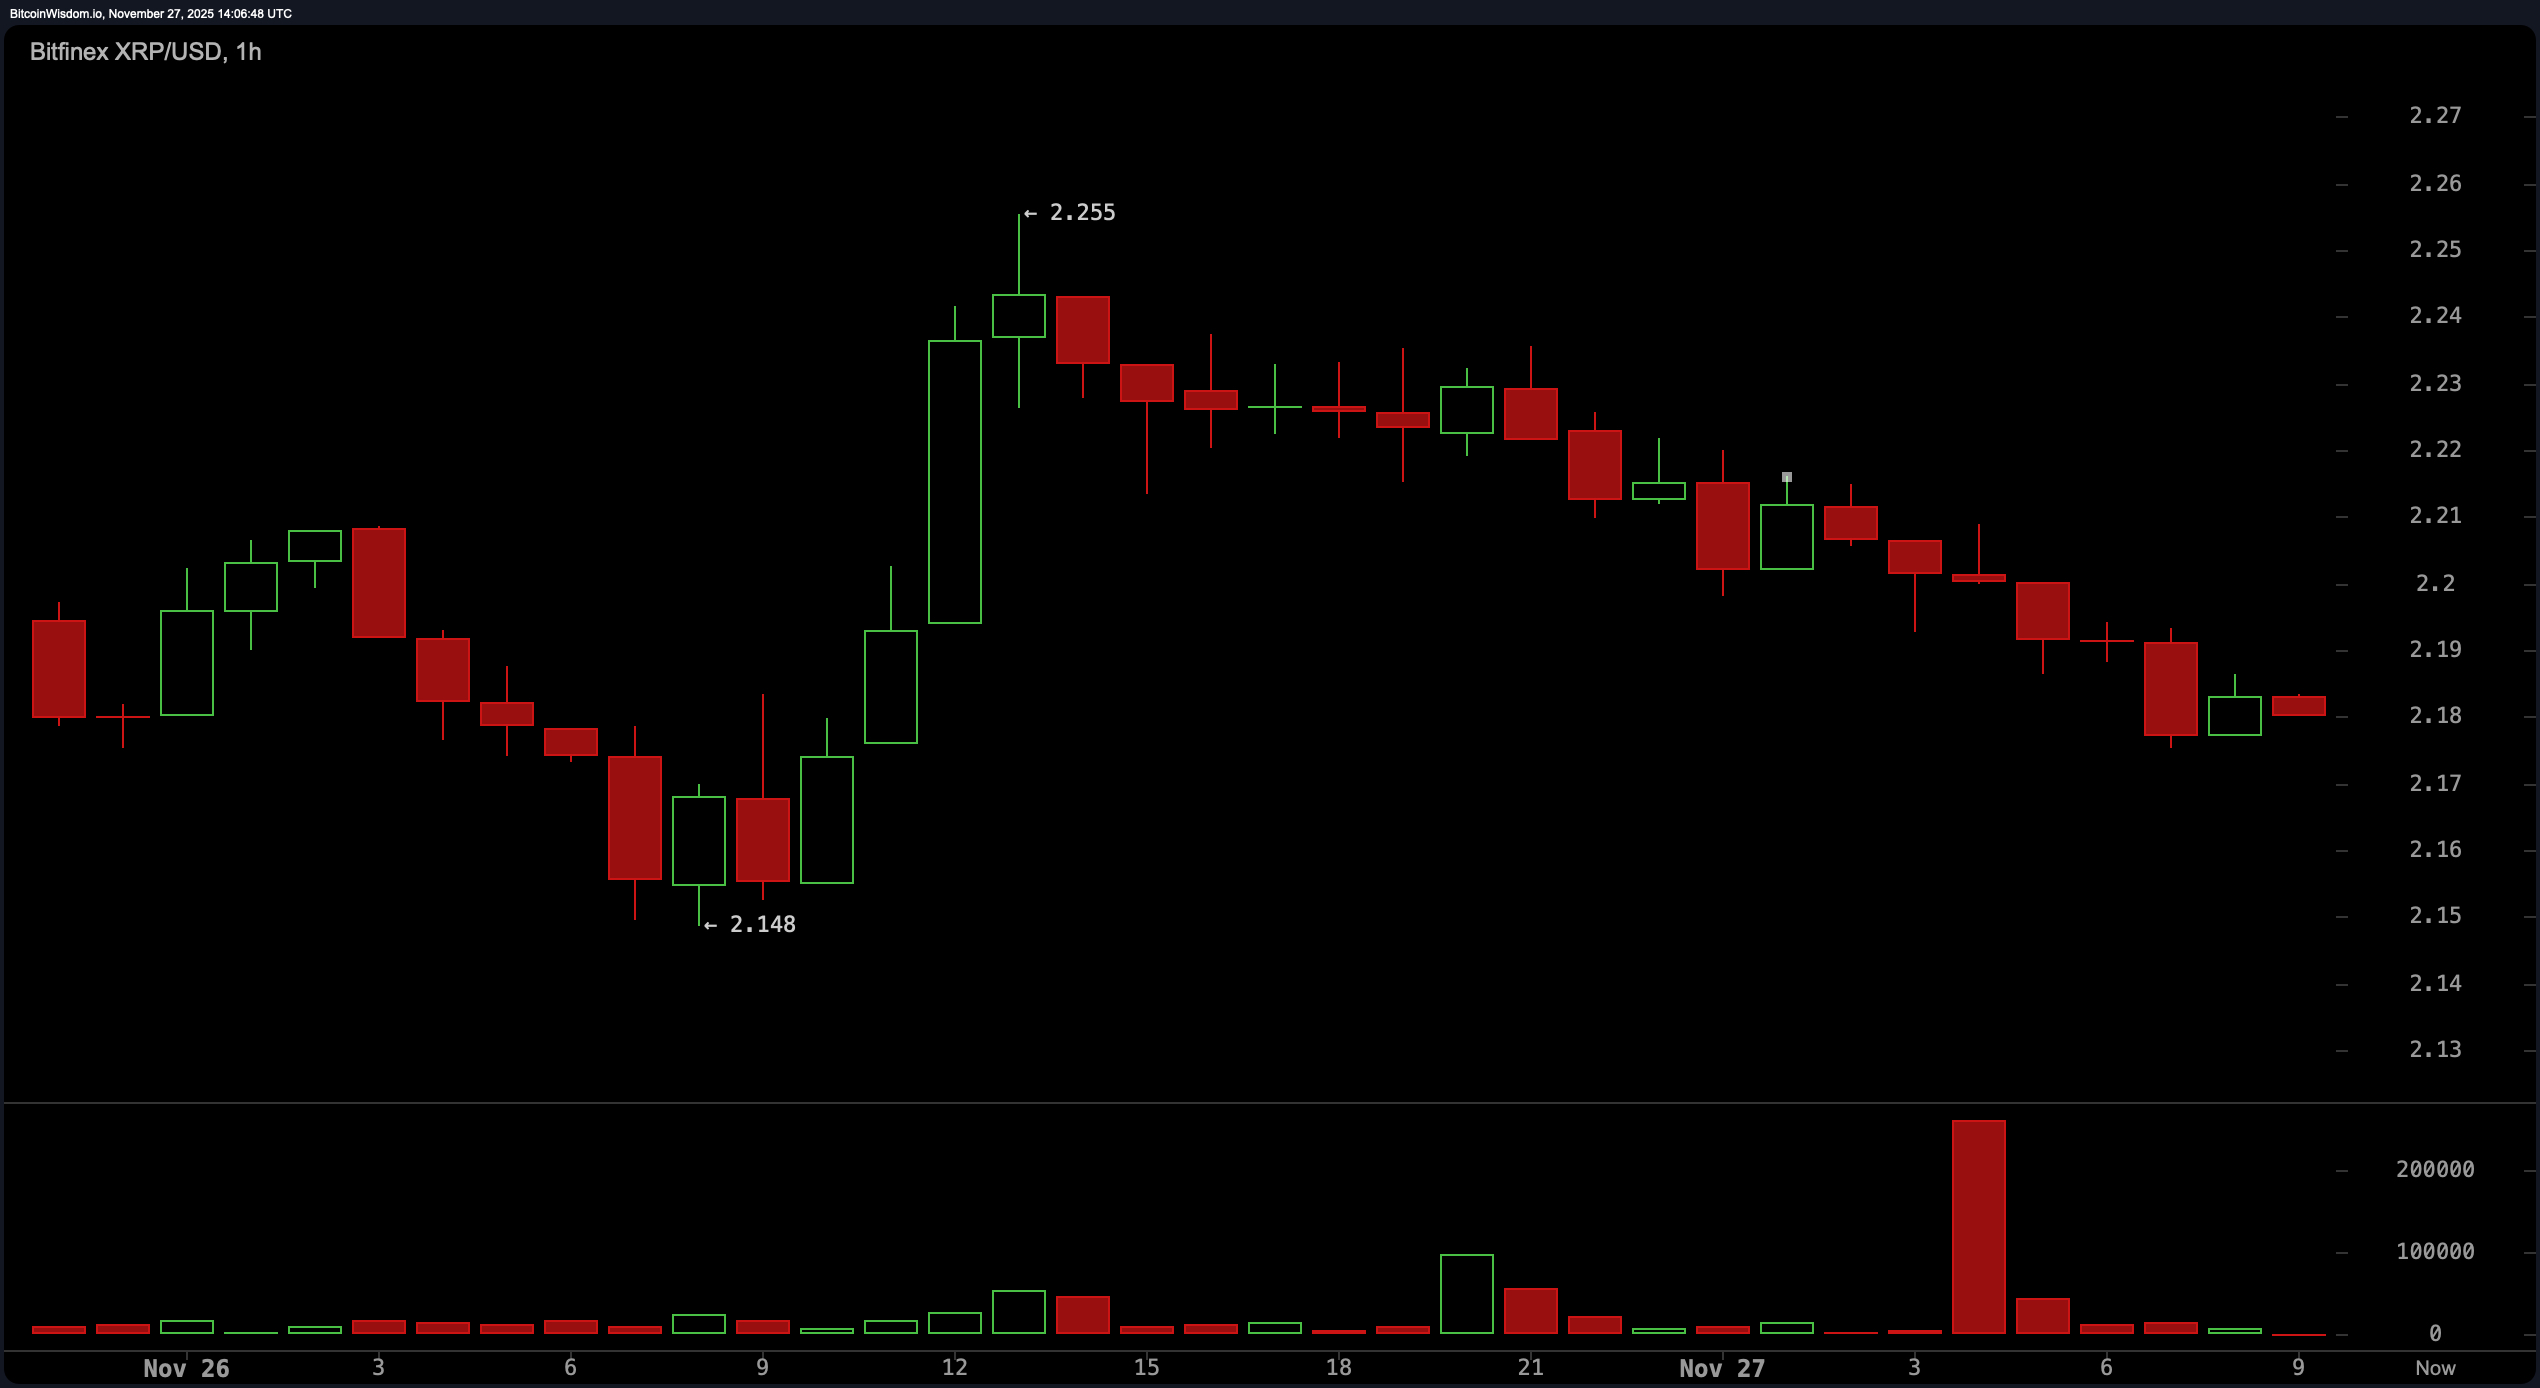
The one-hour chart paints a sharper story: a rally into $2.255, followed by a classic grind downward, signaling distribution rather than exhaustion. Price tries to settle around $2.18, but the sequence of lower highs remains unbroken, giving the short-term structure a heavier tone. With resistance parked at $2.21 and support hugging the $2.16–$2.18 zone, the one-hour setup favors brief tactical plays rather than sweeping trend calls. A reclaim of $2.21 would break this stalemate, while failure at that same level has already proven capable of dragging the price back toward the lows.

XRP/USD 1-hour chart via Bitfinex on Nov. 27, 2025.
Oscillators add another layer of mixed signals, but they lean toward neutrality rather than urgency. The relative strength index (RSI) at 46.28 sits right in the middle. The Stochastic oscillator at 60.16 keeps the meter balanced, the commodity channel index (CCI) at −10.01 stays muted, and the average directional index (ADX) at 25.96 signals trend strength that’s present but far from dominant. Tools like the Awesome oscillator at −0.158 and momentum at 0.017 whisper rather than shout, while the moving average convergence divergence (MACD) level at −0.07482 tilts gently bullish. It’s a cocktail of signals that invites patience over theatrics.
The moving averages tilt the longer-term narrative downward. While the exponential moving average (EMA 10) at 2.15856 and the simple moving average (SMA 10) at 2.10966 reflect short-term strength, everything from the EMA 20 through the SMA 200 leans in the opposite direction. The EMA 20 at 2.20477 and SMA 20 at 2.21122 reflect pressure right above current pricing, while the EMA 200 at 2.52062 and SMA 200 at 2.62451 show just how much ground XRP would need to regain before the long-term structure shifts meaningfully. It’s a blend of near-term resilience and broader-trend skepticism that encapsulates exactly where XRP sits today.
Bull Verdict:
XRP is attempting to carve out stability above the $2.16–$2.18 zone, and the short-term moving averages offering support give bulls a workable foothold. A decisive reclaim of $2.21–$2.25 would flip multiple time frames, unlock momentum from the moving average convergence divergence (MACD) and momentum indicators, and open the door toward retesting $2.29–$2.40 with conviction.
Bear Verdict:
With lower highs still intact on the one-hour chart and nearly all major moving averages from the 20-period through the 200-period pointing downward, XRP remains vulnerable if it fails to regain $2.21. A slip back through the $2.16–$2.18 support shelf exposes the $1.90 area, where the broader downtrend on the daily chart could reassert itself before bulls regroup.
• What is XRP’s current price today? XRP trades at $2.18 with a $131 billion market cap and $3.72 billion in 24-hour volume.
• What key levels matter most for XRP right now? The crucial range is $2.16–$2.25 based on multi-time-frame resistance and support.
• Are XRP’s technical indicators showing strength or weakness? Oscillators remain mostly neutral while longer-term moving averages lean bearish.
• What would improve XRP’s short-term outlook? Reclaiming the $2.21–$2.25 zone would strengthen momentum across several chart intervals.
免责声明:本文章仅代表作者个人观点,不代表本平台的立场和观点。本文章仅供信息分享,不构成对任何人的任何投资建议。用户与作者之间的任何争议,与本平台无关。如网页中刊载的文章或图片涉及侵权,请提供相关的权利证明和身份证明发送邮件到support@aicoin.com,本平台相关工作人员将会进行核查。


