Written by: Seed.eth
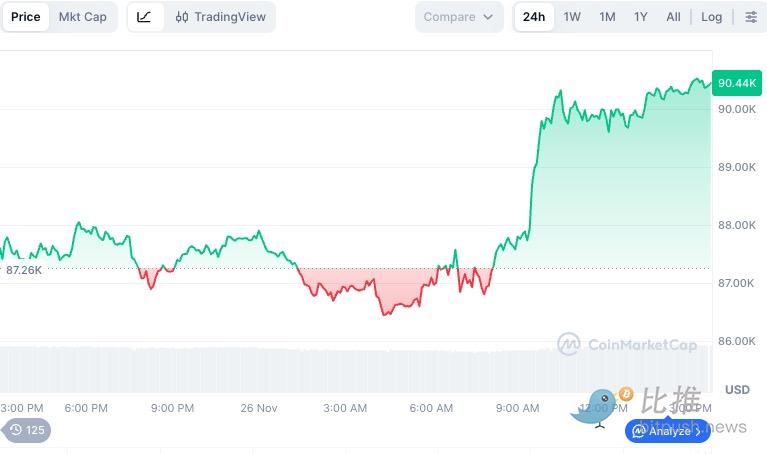
After several weeks of sluggishness, Bitcoin surged on November 26, breaking the $90,000 mark and reclaiming losses from Tuesday. This rise not only broke the market trend before Thanksgiving but was also the result of three favorable factors: macro expectations, capital inflow, and market structure improvement.
Macroeconomic Data Drives Market Confidence
The latest employment data from the U.S. shows that initial jobless claims have dropped to 216,000, the lowest level since mid-April, significantly boosting investor confidence. Although the PPI report indicated a slight increase in wholesale prices due to rising energy and food costs, the core PPI's increase (2.6%) is the smallest since July 2024. Analysts believe this report may prompt the Federal Reserve to consider cutting interest rates again in December.
Following the report, economists at JPMorgan urgently revised their forecasts, predicting that the Federal Reserve will initiate rate cuts in December, overturning their judgment from a week prior that policymakers would delay cuts until January. Their research team noted that several heavyweight officials from the Federal Reserve (especially New York Fed President Williams) have expressed support for recent rate cuts, prompting them to reassess the situation.
JPMorgan now expects the Federal Reserve to implement two 25 basis point rate cuts in December and January.
Under the catalyst of favorable macro conditions, Bitcoin's price rose nearly 4% to over $90,000 on the same day; Ethereum (ETH) increased by 2% to $3,025. Major altcoins, including XRP, Solana (SOL), and BNB, also saw gains. The total market capitalization of the entire crypto market reached $3.08 trillion, rebounding nearly 3% within 24 hours, with trading volume hitting $139 billion. Bitcoin's market cap share rose to 56.5%, while Ethereum accounted for 11.5%.
Capital Flow Reversal, ETF Shows Re-Siphoning Effect
The ETF capital situation has shown significant improvement.
Previously, the market faced severe capital outflow pressure, even breaking historical records. However, data from Wednesday indicated that Bitcoin ETFs attracted nearly $129 million, Ethereum ETFs saw inflows exceeding $78 million, Solana (SOL) ETFs increased by $53 million, and XRP ETFs attracted $35 million. Driven by macro confidence, institutional capital is being reallocated to the crypto market.
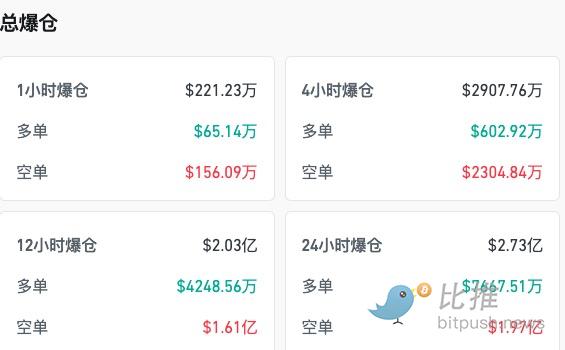
Coinglass data shows that over the past 24 hours, the crypto market experienced liquidations totaling more than $273 million, with short positions dominating (at $197 million), led by Bitcoin with $86 million in liquidations, followed closely by Ethereum and HYPE.
Bottom Characteristics Gradually Emerging?
CryptoQuant analyst Abramchart pointed out that the market has just completed a deep "leverage washout," with the total open interest dropping sharply from $45 billion to $28 billion, marking the largest decline in this cycle. This is not a bear market signal but rather resembles a major market bloodbath, clearing out excessively inflated speculative positions and accumulating healthier momentum for future rises.
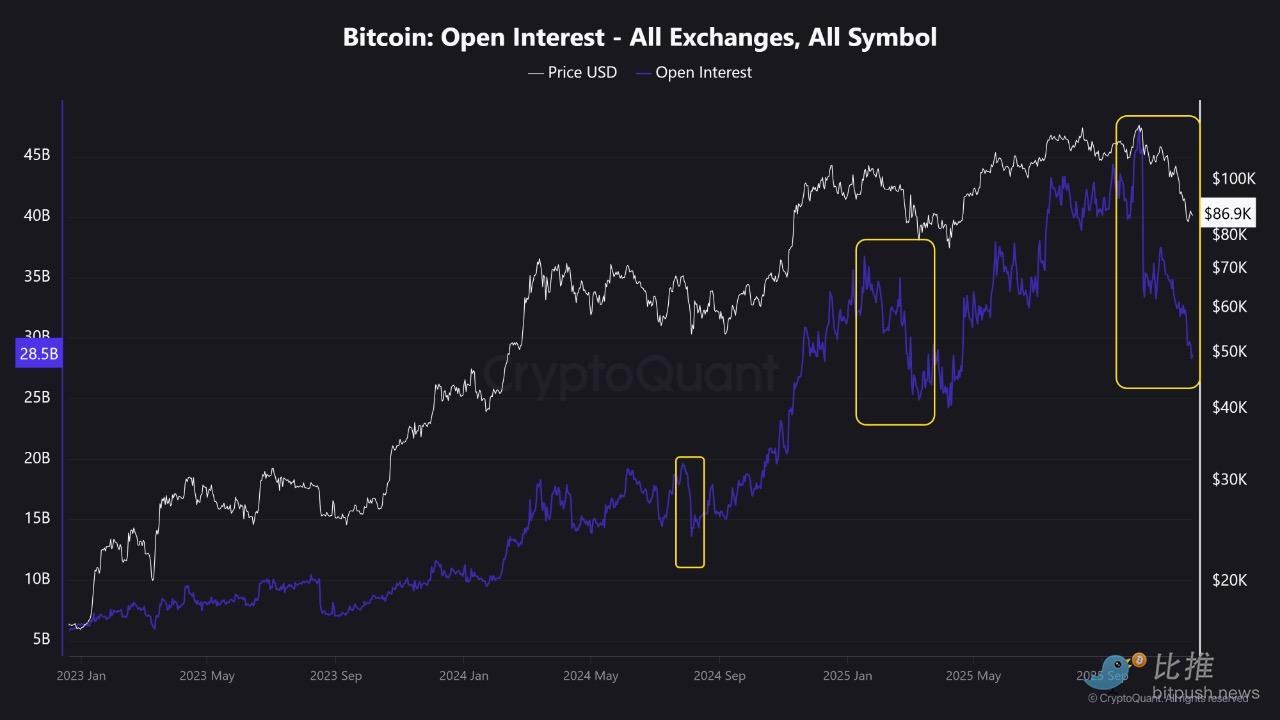
Additionally, after significant volatility, BTC remains stable above the average ETF cost price of $79,000, indicating that large institutional funds have not engaged in exaggerated selling. This provides important psychological and financial support for the market.
Combining several indicators that the market has recently focused on, deeper structural changes can be observed:
Puell Multiple Approaching Cycle Bottom
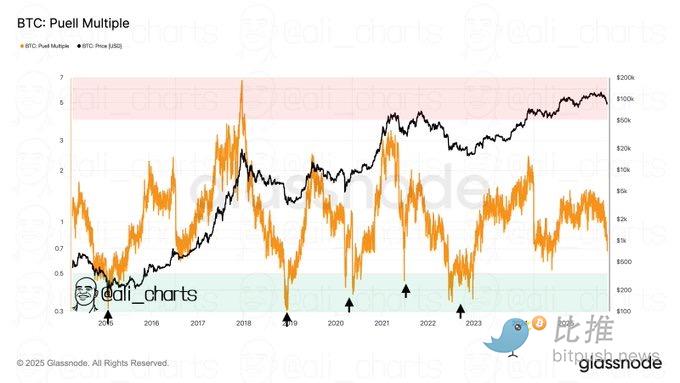
On-chain analyst Ali observed that the Puell Multiple indicator is currently at 0.67. Although it has not yet fallen below the critical threshold of 0.50 for historical cycle bottoms, it is very close.
The Puell Multiple is an on-chain analysis indicator created by David Puell to assess Bitcoin miners' profitability and its impact on the market. It is calculated as follows: Puell Multiple = (USD value of daily newly issued Bitcoin) / (365-day moving average of the USD value of daily newly issued Bitcoin).
In simple terms, it measures the current selling pressure of miners (or the value of Bitcoin they earn daily) compared to the average level over the past year.
Historical data shows that since 2015, when this indicator falls below 0.50, it often signals the bottom of the Bitcoin cycle. This suggests that miners' selling pressure may be easing, and the market is entering an important observation window, potentially indicating the arrival of a mid-term bottom.
Technical Outlook Turns Positive
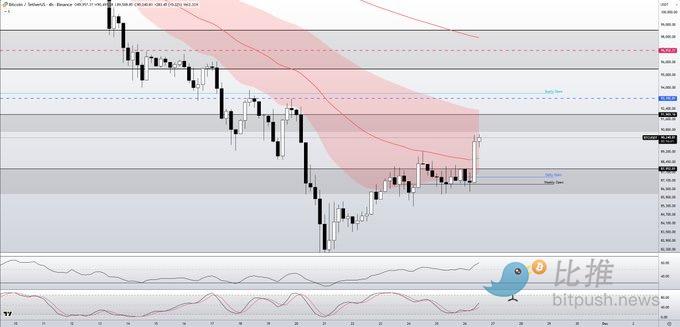
Technical analyst Skew Δ pointed out that on the 4-hour chart, Bitcoin currently presents a bullish-friendly technical structure, with multiple momentum and trend indicators (50EMA, RSI, Stoch RSI) pointing positively.
$88,000 is the lifeline for bulls, while the $90,000 to $92,000 range will be the key resistance/contested area to confirm whether the market can initiate a stronger structural upward trend. Traders should closely monitor price performance around these key levels.
Risks and Expectations
Despite the short-term improvement in sentiment, the lack of liquidity during Thanksgiving may amplify volatility. Wintermute trading strategist Jasper De Maere noted that the options market shows traders generally expect Bitcoin to oscillate in the $85,000-$90,000 range, betting that the market will maintain the status quo rather than exhibit a breakout trend.
In the medium to long term, $74,000 is a key level to watch. If Bitcoin's weekly closing price falls below this level, the market may face a broader adjustment. Currently, Bitcoin is still down nearly 30% from its historical high of $126,000. Whether this rebound can truly transform into a sustainable upward trend ultimately depends on whether macro policies and capital flows can provide continuous and strong support.
免责声明:本文章仅代表作者个人观点,不代表本平台的立场和观点。本文章仅供信息分享,不构成对任何人的任何投资建议。用户与作者之间的任何争议,与本平台无关。如网页中刊载的文章或图片涉及侵权,请提供相关的权利证明和身份证明发送邮件到support@aicoin.com,本平台相关工作人员将会进行核查。


