Bitcoin Returns to April Price Levels, Panic Spreads, Can It Recover?
Author: Ryan Yoon
Source: Tiger Research
Translation: Baihua Blockchain
Bitcoin has fallen below $90,000 and then dropped to $80,000. Now, it has returned to the price range of April.
What is the current market status? What factors might determine the next move?
1. All Risk Assets Decline, but Cryptocurrencies Decline More Sharply
The entire crypto market was already showing weakness, and with the global market pullback, the decline has further intensified. Bitcoin is not the only asset affected. The total market capitalization of cryptocurrencies has now fallen back to April levels.

Compared to the S&P 500 and Nasdaq indices, the pullback in cryptocurrencies is much deeper.
The reasons are not singular. Concerns about the AI bubble, expectations of interest rate cuts, and a breakthrough in safe-haven funds have all played a role. However, panic itself seems to be the main driving factor. The "Fear and Greed Index" for cryptocurrencies is now close to one of its lowest levels in a year.
So, what do Bitcoin's on-chain signals tell us now?
2. Strong Buying Support Around $84,000
As Bitcoin declines, a clear "buy the dip" demand has emerged.
This area corresponds to the range where Bitcoin consolidated before its rise in April. Many buyers are entering the market again, and their demand has resurfaced. The chart shows a dense buying zone around $84,000.
This forms a potential support area. However, if the price falls below it, these buyers will be in trouble, which could increase selling pressure.
This could lead to two different trends:
For medium to long-term buyers: This area is suitable for slow, incremental buying.
For short-term traders: Setting strict stop-loss orders below the support level is a more rational approach.
3. Long-Term Holders Continue to Sell, but the Pattern Has Changed
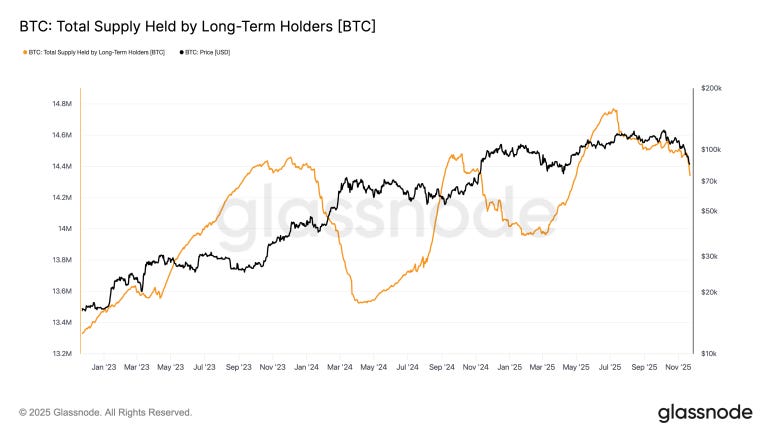
Long-term Bitcoin holders (LTHs) tend to accumulate in sideways or rising markets and sell when prices approach peaks. The notable feature now is that the scale of these sell-offs is continuously shrinking, with a significant reduction compared to 2024.
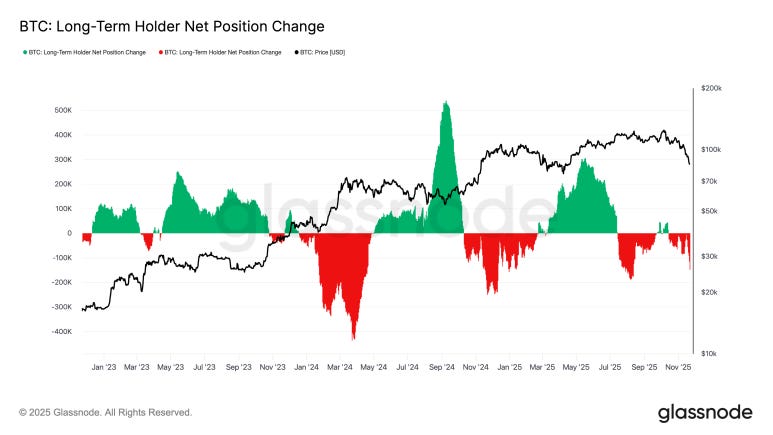
I believe this pattern is the result of a significant shift in long-term supply in 2024, when Bitcoin flows steadily from individual long-term holders to institutions.
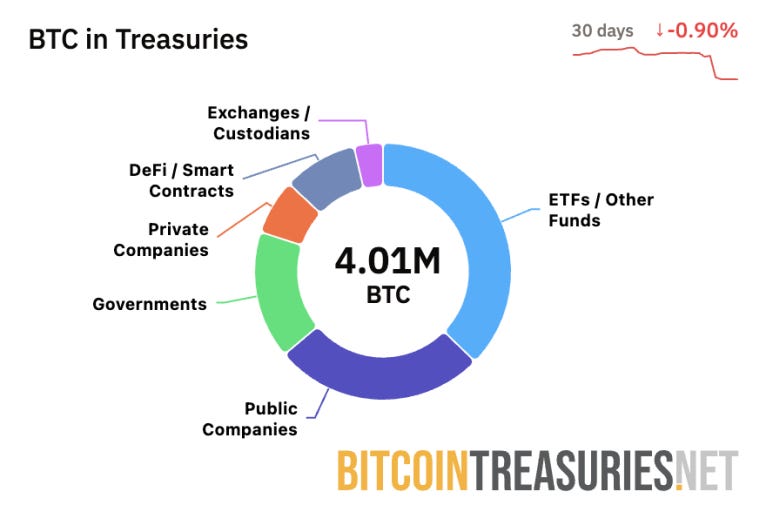
Data from BitcoinTreasuries shows that out of 21 million BTC, a total of 4 million are held by ETFs, companies, and governments. This means the market is now driven by participants who are less likely to sell quickly.
The Bitcoin absorbed by institutions is also locked in as long-term supply. This has led to supply tightness, resulting in a decrease in the issuance of Bitcoin.
Therefore, long-term holders will still sell Bitcoin, but some large sell-offs from previous cycles have diminished. Most of the weaker holders have exited. What remains are mainly institutional rebalancing rather than forced selling.
4. Bitcoin MVRV Approaching Annual Low
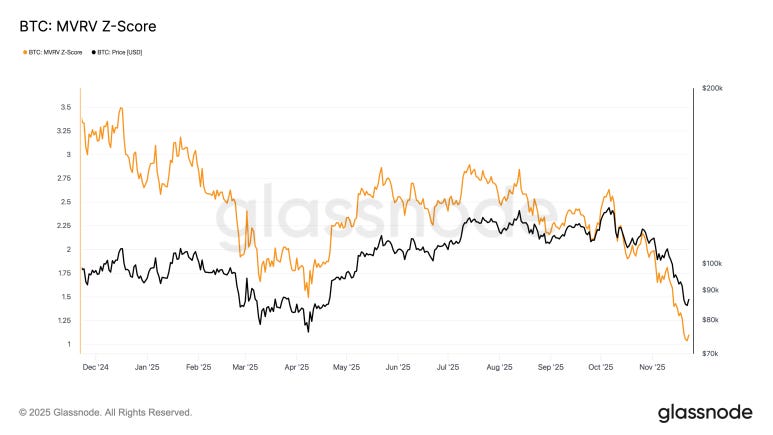
MVRV (Market Value to Realized Value) compares the market price to the average cost basis of all participants.
Low MVRV values indicate that prices are close to or below the entry levels of most investors. This typically occurs near market bottoms.
The MVRV-Z score has shown this more clearly. As of late November 2025, it has fallen into a critical zone.
The current Z-score is between 0.00 and 1.10, indicating an undervalued area.
This area usually marks a statistical turning point, where the slope of returns begins to steepen.
The recovery in early 2023 also began in this area, driven by institutions and long-term holders.
5. Support from Active Investors Has Broken

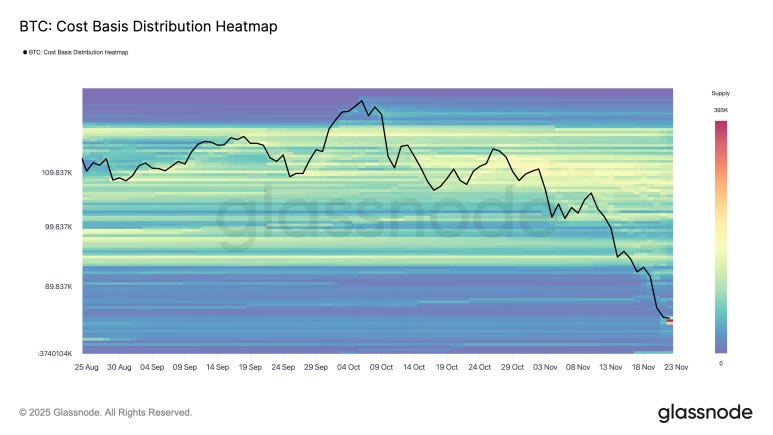
Despite stronger institutional demand and lower MVRV, the cost basis chart still shows risks.
Prices have fallen below the cost basis of short-term holders, and now it has also fallen below the average cost of active investors, which is the last major support.
The implication is simple: active investors who once supported the market are now in a loss position. In past bull market pullbacks, prices typically rebound here. But this time, they did not.
This line, around $87,000 to $88,000, has now become a strong resistance level that the price must reclaim.
6. Incremental Buying and Strict Stop-Loss
The signals appear mixed.
Bitcoin is undervalued on the MVRV, and falling below the cost basis level indicates that downside risk still exists. Underestimation may lead to a sharp drop.
Therefore, chasing highs or panic selling is less effective than focusing on two panic checkpoints:
Key Support: Monitor whether the $84,000 buying zone can hold.
Reclaim Signal: If the price rises above $88,000, a rebound may occur.
Currently, most driving data plans are to buy slowly and incrementally, focusing on these two levels.
Article link: https://www.hellobtc.com/kp/du/11/6137.html
Source: https://reports.tiger-research.com/p/bitcoin-back-to-april-eng
免责声明:本文章仅代表作者个人观点,不代表本平台的立场和观点。本文章仅供信息分享,不构成对任何人的任何投资建议。用户与作者之间的任何争议,与本平台无关。如网页中刊载的文章或图片涉及侵权,请提供相关的权利证明和身份证明发送邮件到support@aicoin.com,本平台相关工作人员将会进行核查。


