The market is showing its first signs of recovery. However, it is too premature to anticipate a quick recovery that would bring back all the losses we have experienced in the last few weeks. XRP is seeing a solid gain in volume and capitalization and Ethereum is still struggling, while SHIB is adding more than a trillion in bullish volume. In other words, the picture is mixed.
XRP's massive spike
Due to exceptionally high transactional activity throughout the network, XRP recently saw one of its biggest upside movements in weeks, rising 13% in a single session. This was a coordinated spike in exchange volume and on-chain payments, rather than a speculative wiggle or an oversold bounce, and the price chart shows that the market responded sharply.
The rebound began precisely at the lower edge of XRP’s declining channel, where buyers intervened forcefully enough to produce the biggest green candle since early November. The move restored short-term momentum and temporarily halted the downtrend by pushing the price directly toward the mid-channel region.
HOT Stories Crypto Market Prediction: XRP Rockets 13% on Heavy Multimillion Flow, Ethereum (ETH) Hit With Mini-Death Cross, Shiba Inu (SHIB) Adds Trillion, What Does It All Mean?Shiba Inu (SHIB) Sees New Hope, XRP Price Has 6 Days to Rebound, BlackRock Dumps $314 Million in Bitcoin and Ethereum – Crypto News DigestPro-Crypto Dove Emerges as Top Candidate to Replace Powell Morning Crypto Report: XRP Bags $164 Million for ETF, Shiba Inu (SHIB) to Lose Zero, Insane $1.75 Billion Option Bet on Bitcoin Price to Rise
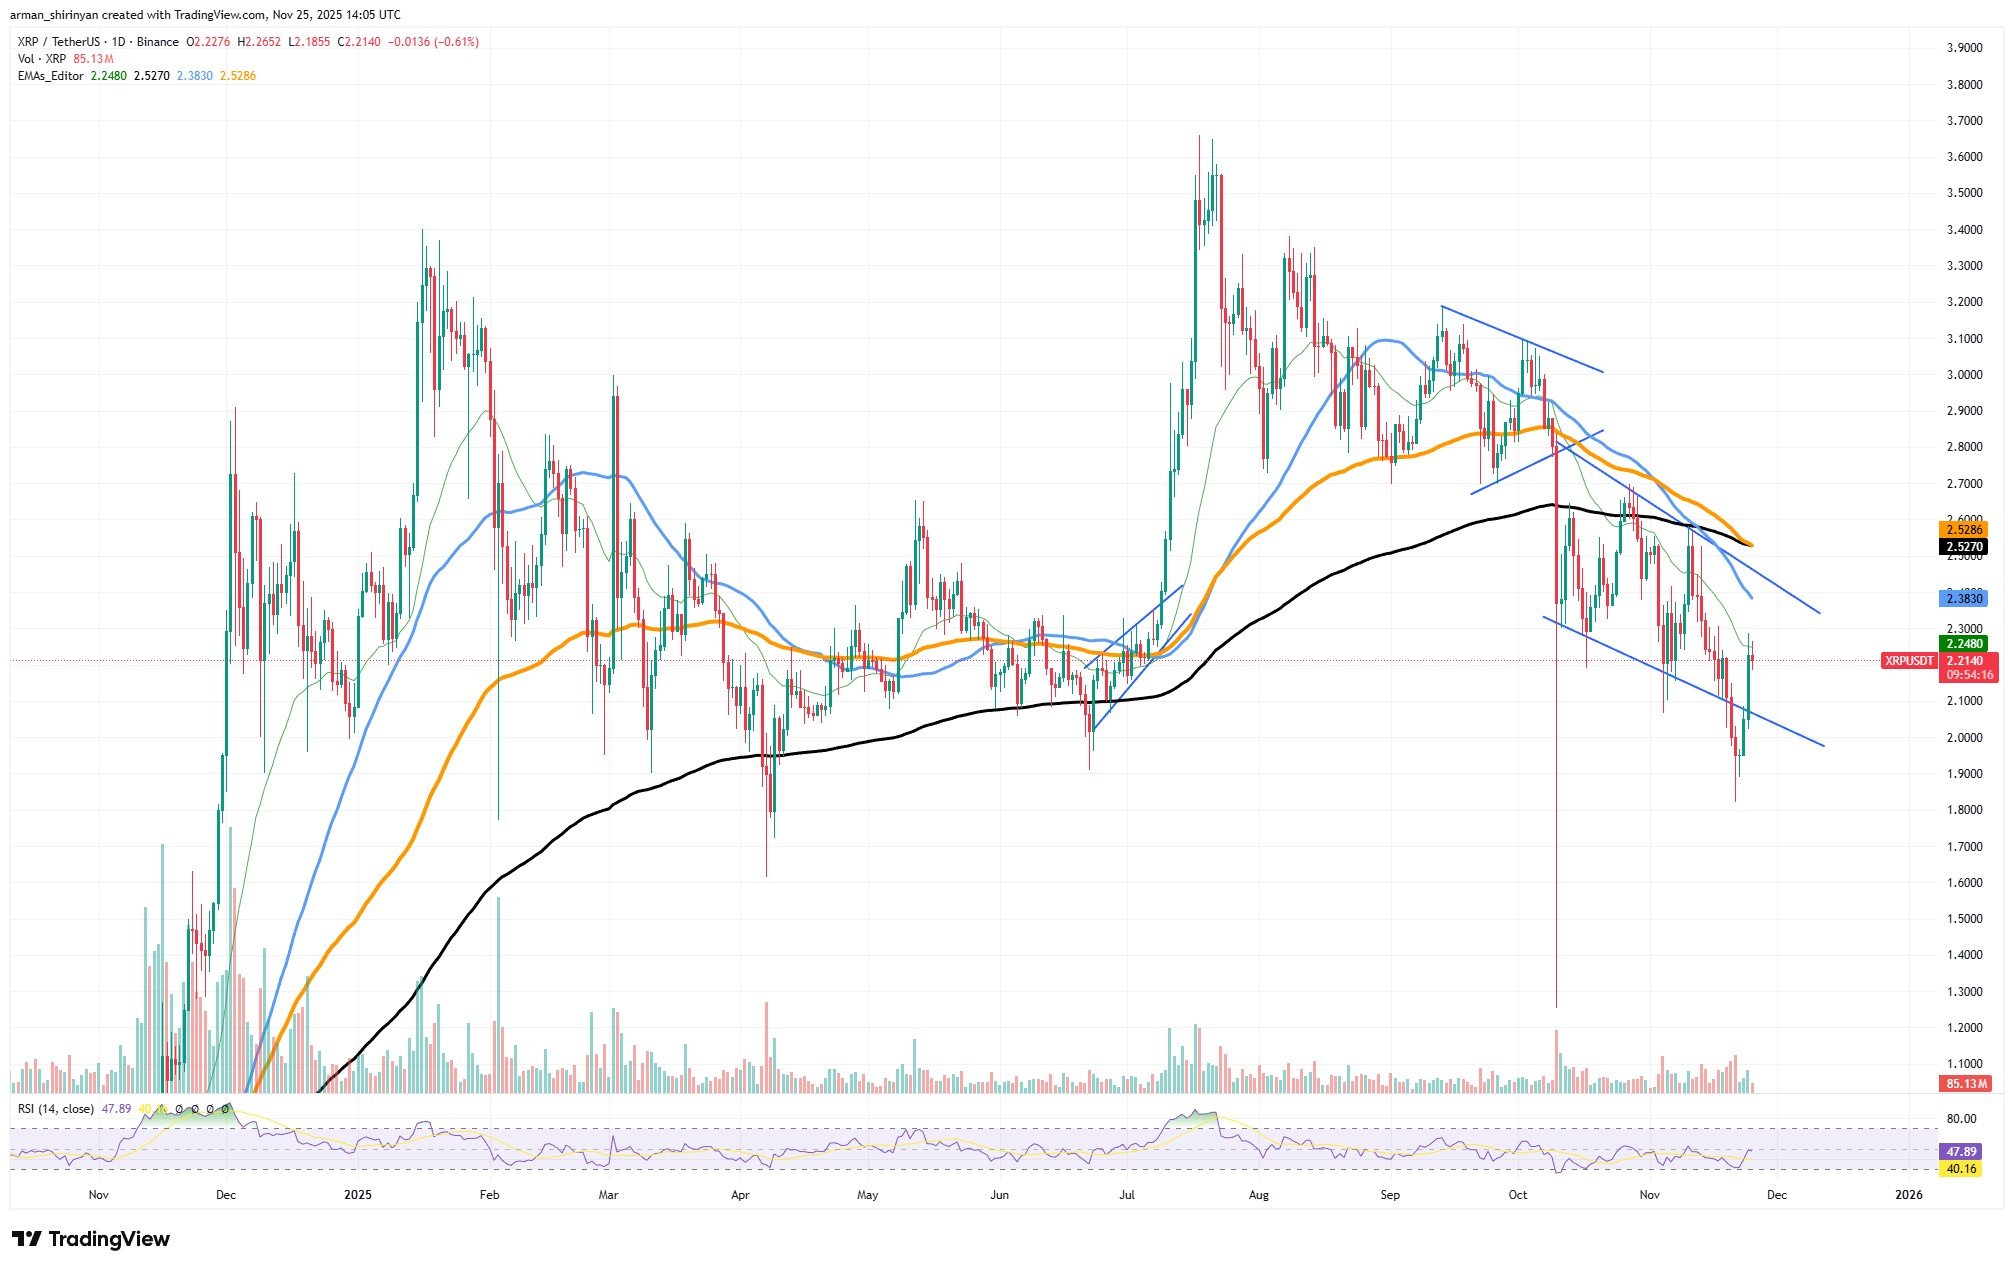
XRP/USDT Chart by TradingView
Importantly, this occurred as XRP Ledger payments skyrocketed into the multimillion range, demonstrating that network usage was not only alive but also accelerating. This is significant because price weakness has not been the only issue facing XRP over the last two months. Lack of network confirmation has been the cause.
On-chain utility appeared stagnant, transaction volume fluctuated and payment counts waned close to local bottoms. This pattern is finally broken by the most recent surge in activity, which was accompanied by a clear market reaction. To put it another way, the price did not rise on its own. Something genuine happened within the network, which caused it to rise.
What, then, should investors anticipate? First, continuation is not assured, but it is possible. The 20-day, 50-day, 100-day and 200-day major moving averages are still above XRP, which is still trapped in its declining macro channel. They serve as dynamic resistance and usually impede any reversals in the early stages.
Second, if network activity stays high, this move will not be sustainable. XRP has a good chance of testing the channel’s upper boundary, which is between $2.40 and $2.55, if the payment volume spike continues over the coming days. This would be the first real attempt to break the larger downtrend.
Ethereum's dreadful state
The timing of Ethereum's recent mini-death cross, which saw the 50-day EMA cross below the 100-day EMA, could not be worse for a market that was already having trouble gaining momentum. This shorter-term version, in contrast to the traditional 50/200 EMA death cross, confirms that medium-term trend deterioration is speeding up but does not indicate a macro collapse. This is fully supported by ETH’s chart.
You Might Also Like
Tue, 11/25/2025 - 00:01 Crypto Market Prediction: $1,400,000,000 Bitcoin (BTC) Carnage Over, Ethereum (ETH) Crash Might Not Stop, Shiba Inu (SHIB) Market Collapse Ending ByArman Shirinyan
For weeks, the price has been stuck beneath a string of declining EMAs. Every bounce has been shorter, weaker and met with sell pressure right away. Now that the 50 and 100 EMAs have flipped into a bearish alignment, ETH’s capacity to maintain upward movement is further diminished. These crossovers basically indicate that momentum has shifted decisively in favor of sellers and that recent price performance has been much worse than in the previous few months.
Even the shortest moving averages could not be recovered despite the recent bounce from the $2,800 zone. Rather, ETH surged into resistance. When a death cross establishes the tone, EMAs shift from dynamic support to dynamic resistance. Bulls must fight uphill, and each upward move carries the risk of turning into a downward one.
Even worse, the rounding bottom that Bitcoin and Shiba Inu are starting to exhibit is not being formed by ETH. This is just a steep decline, a feeble countertrend push, and still-declining EMAs are directly overhead. The mini-death cross, in this situation, confirms that the downtrend has room to continue and is more than just a signal.
Shiba Inu trying to recover
Just as the token was attempting to reverse its most recent sell-off, Shiba Inu printed one of its busiest trading days in months, adding about one trillion SHIB in volume. That level of volume typically indicates either early accumulation from larger players or peak capitulation; it does not just happen.
On the chart, the impact is evident right away: SHIB easily recovered from the $0.0000075-$0.0000080 support zone, which is also where the RSI reached extremely low levels. Since SHIB has not had significant participation all month, the trillion-unit volume spike is significant. The majority of the candles in November were thin, broken and dominated by vendors cutting prices.
You Might Also Like
Tue, 11/25/2025 - 13:39 Satoshi-Era Bitcoin Holder Rakes in 965,517,137% Profit After Recent Sell-OffByGodfrey Benjamin
It only takes one strong day to reverse market dynamics when a downtrend becomes this linear and volume stops. That is precisely what occurred just now. Although a complete reversal is not confirmed by the subsequent bounce, it does indicate that the worst of the selling pressure may be abating.
At lows, volume spikes usually indicate either (1) capitulation, which is the final significant wave of panic-selling, or (2) accumulation, which is large holders stepping in to absorb weakness. SHIB’s candle appears to have leaned toward the second based on its structure. Instead of allowing prices to plummet, buyers absorbed supply and drove the market higher from its lowest points.
免责声明:本文章仅代表作者个人观点,不代表本平台的立场和观点。本文章仅供信息分享,不构成对任何人的任何投资建议。用户与作者之间的任何争议,与本平台无关。如网页中刊载的文章或图片涉及侵权,请提供相关的权利证明和身份证明发送邮件到support@aicoin.com,本平台相关工作人员将会进行核查。


