Good evening everyone, I am Jiang Xin. Long time no see, although it hasn't been that long, but the intensity of the market in the past few days seems to have gone through what should have taken a long time.
Looking at the one-hour candlestick chart, Bitcoin experienced a significant drop at 3 PM, hitting around 81200. The next hour's candlestick closed with a spike of 3500 points, reaching around 84600. Due to the massive options expiration on Friday, the drop was undoubtedly influenced by bearish news that triggered a sell-off of call options. As for the put options, those that weren't cleared before the sudden rebound at 4 PM didn't yield much profit. At 8 PM, Bitcoin tested the bottom again, and after a spike down to 80600, it received buying support. The KDJ and RSI indicators showed a golden cross at low levels, and this one-hour candlestick broke the previous rebound high of 84600, indicating that the market's recovery will tilt upwards. In the following hours, the price fluctuated around 84000.
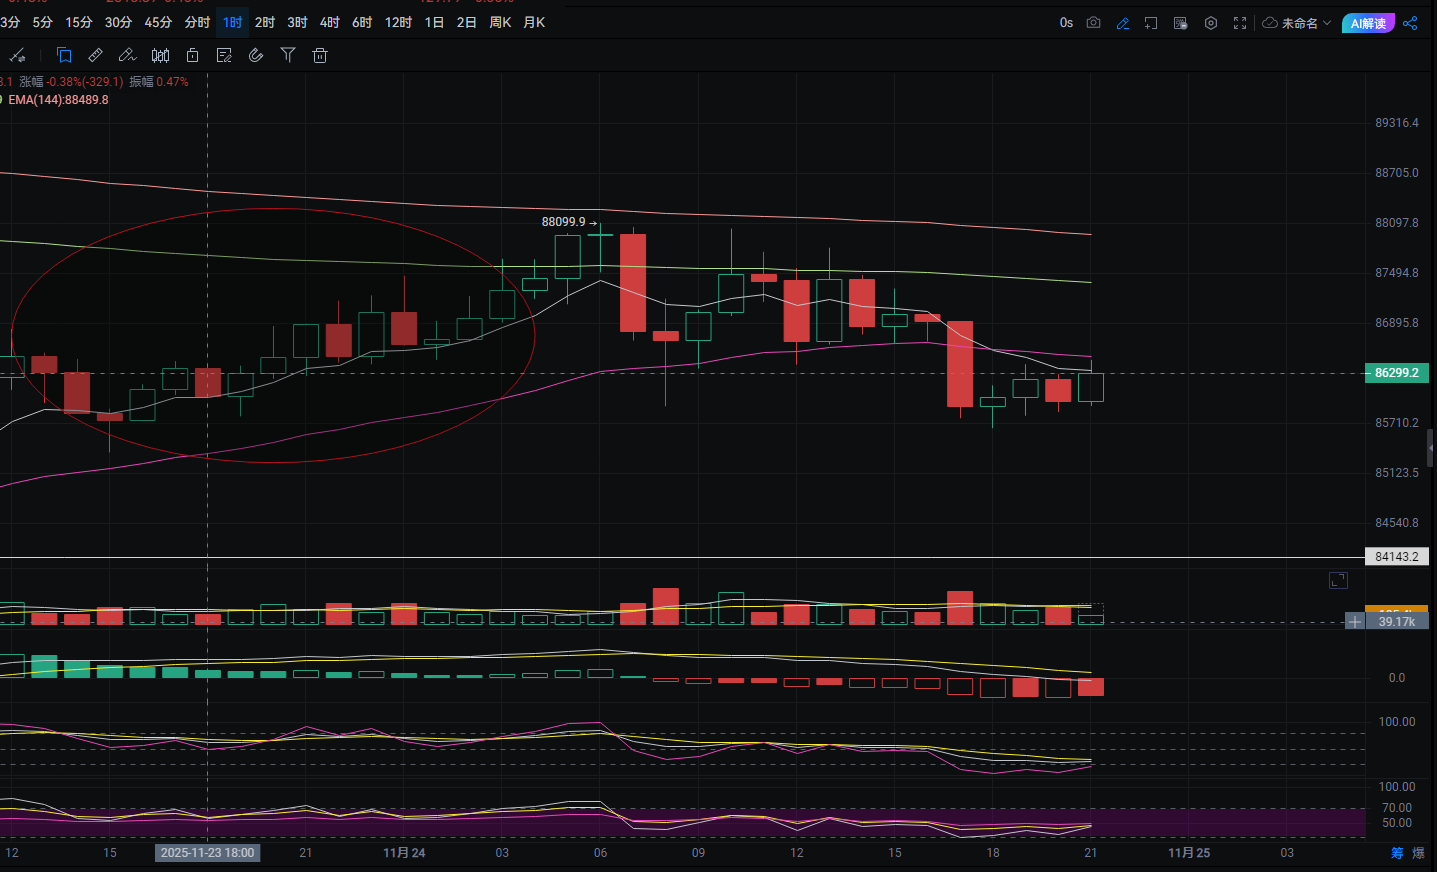
In fact, looking at the four-hour level, the recovery momentum can be felt more clearly. From 8 PM on the 21st to 4 AM on the 22nd, three one-hour candlesticks showed reduced trading volume and rising prices, with both indicators showing a golden cross at low levels, and MACD showing a bullish divergence. As it was the weekend, the market naturally saw reduced volume for recovery, and the overall process was dominated by bulls. In the early hours of the 22nd and 23rd, as well as the evening of the 23rd, there were three consecutive bullish four-hour candlesticks, indicating a tug-of-war. Bitcoin first rebounded to around 84000, then pushed up from the 84000 divergence point to around 88000. The overall process lacked strong trading volume, but this is a positive signal for future upward recovery.
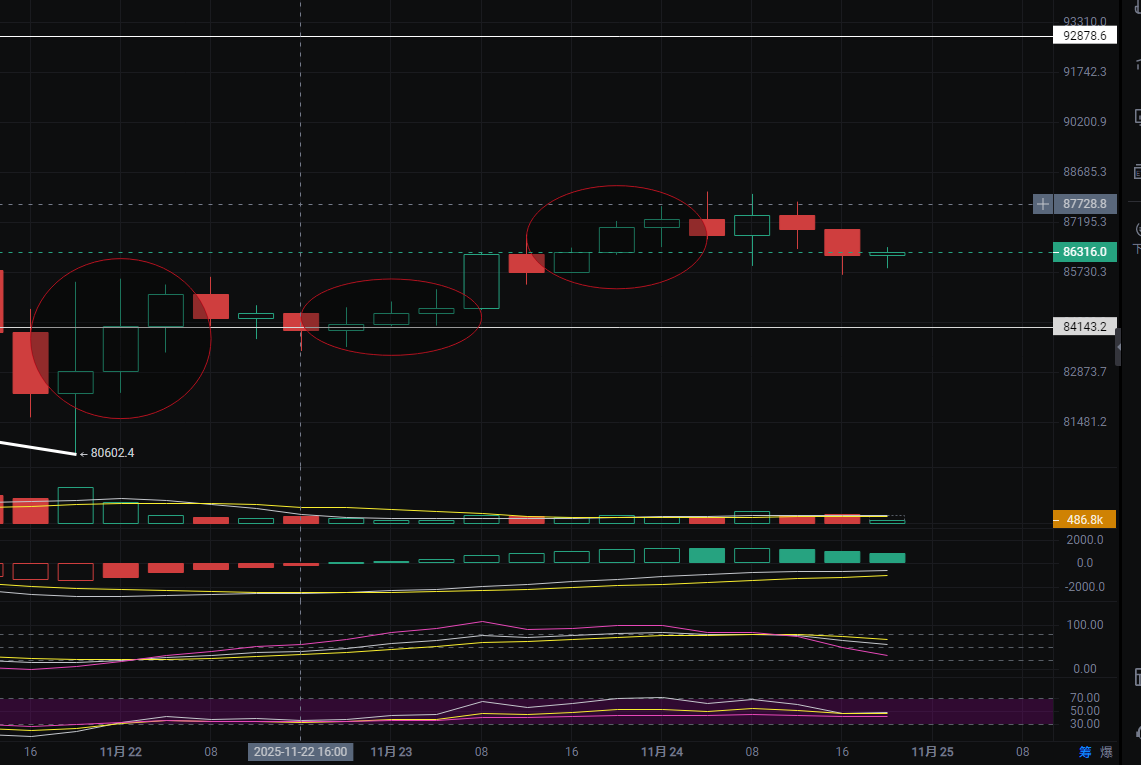
We should focus on the key tug-of-war points, specifically the two cross candlesticks at 8 PM on the 22nd and 12 PM on the 23rd, which are around 84150, 86000, and 87200. Due to the lack of trading volume during the weekend consolidation, this can only be seen as a test of the bulls' recovery willingness and the bears' expectations. Currently, the four-hour EMA30 and EMA120 are both around 87500, with MACD lines approaching the zero axis and the RSI indicator hovering around the 50 midpoint, suggesting further testing in the future.
If the bullish recovery continues, the 86000 level can serve as the next tug-of-war point for an upward move, with the first target at 88800. If strong, it may even reach the 90000s in one go. If relatively weak, with bears resisting, the market may fluctuate around the 84150-87500 range. The worst-case scenario would consider the first segment of the tug-of-war in the four-hour chart, taking the second candlestick's lowest point of 82800 as the recent lowest expectation.
Therefore, we can enter at 86000, add positions at 84800, and conservatively enter at 84800 and add at 83500, with the first target at 87500. The second target is 88800. As for the highest point in this medium-term round, it can be seen around 91500, but there may be repeated fluctuations before that. A stop-loss for long positions can be set at 82500. Under normal circumstances, there will still be buying support at 84000, as the weekend has already undergone testing.
If considering short positions, only at 87500 can it be contemplated, with a stop-loss set above the multiple resistance levels at 88200. The greater the divergence, the more opportunities there are; short-term trades can be handled freely, otherwise, it’s fine to follow along.

Ethereum's movement is very similar to Bitcoin's, but the process has more divergence. We only need to consider a few four-hour cross candlesticks representing divergence points, specifically those at 8 AM and 8 PM on the 21st, and at 12 PM on the 22nd and 23rd. The important divergence and tug-of-war points can be seen around 2800, 2650, 2700, and 2750. The large-scale divergence in Ethereum contains many one-hour divergences, but the first triangular and the second repair channel are very stable.
We can go long around 2800, adding at 2750, targeting 2880. Conservatively, we can enter at 2750 and add at 2700, targeting 2868. For short positions, only at 2875 can it be considered, with a stop-loss at 2915.
Due to the disputes in Ethereum being hidden in smaller levels, the 2750-2880 range will see significant competition. As the repair channel trends upwards, the box fluctuations should reference the upper side, and the channel may be expanded, adjusting as per the actual situation.
The recent market is complex, and the direction can easily change. Recently, there has been a quiet buildup, but you all already know that.
For more insights with Jiang, you can refer to the public account: Jiang Xin on Chan.

免责声明:本文章仅代表作者个人观点,不代表本平台的立场和观点。本文章仅供信息分享,不构成对任何人的任何投资建议。用户与作者之间的任何争议,与本平台无关。如网页中刊载的文章或图片涉及侵权,请提供相关的权利证明和身份证明发送邮件到support@aicoin.com,本平台相关工作人员将会进行核查。


