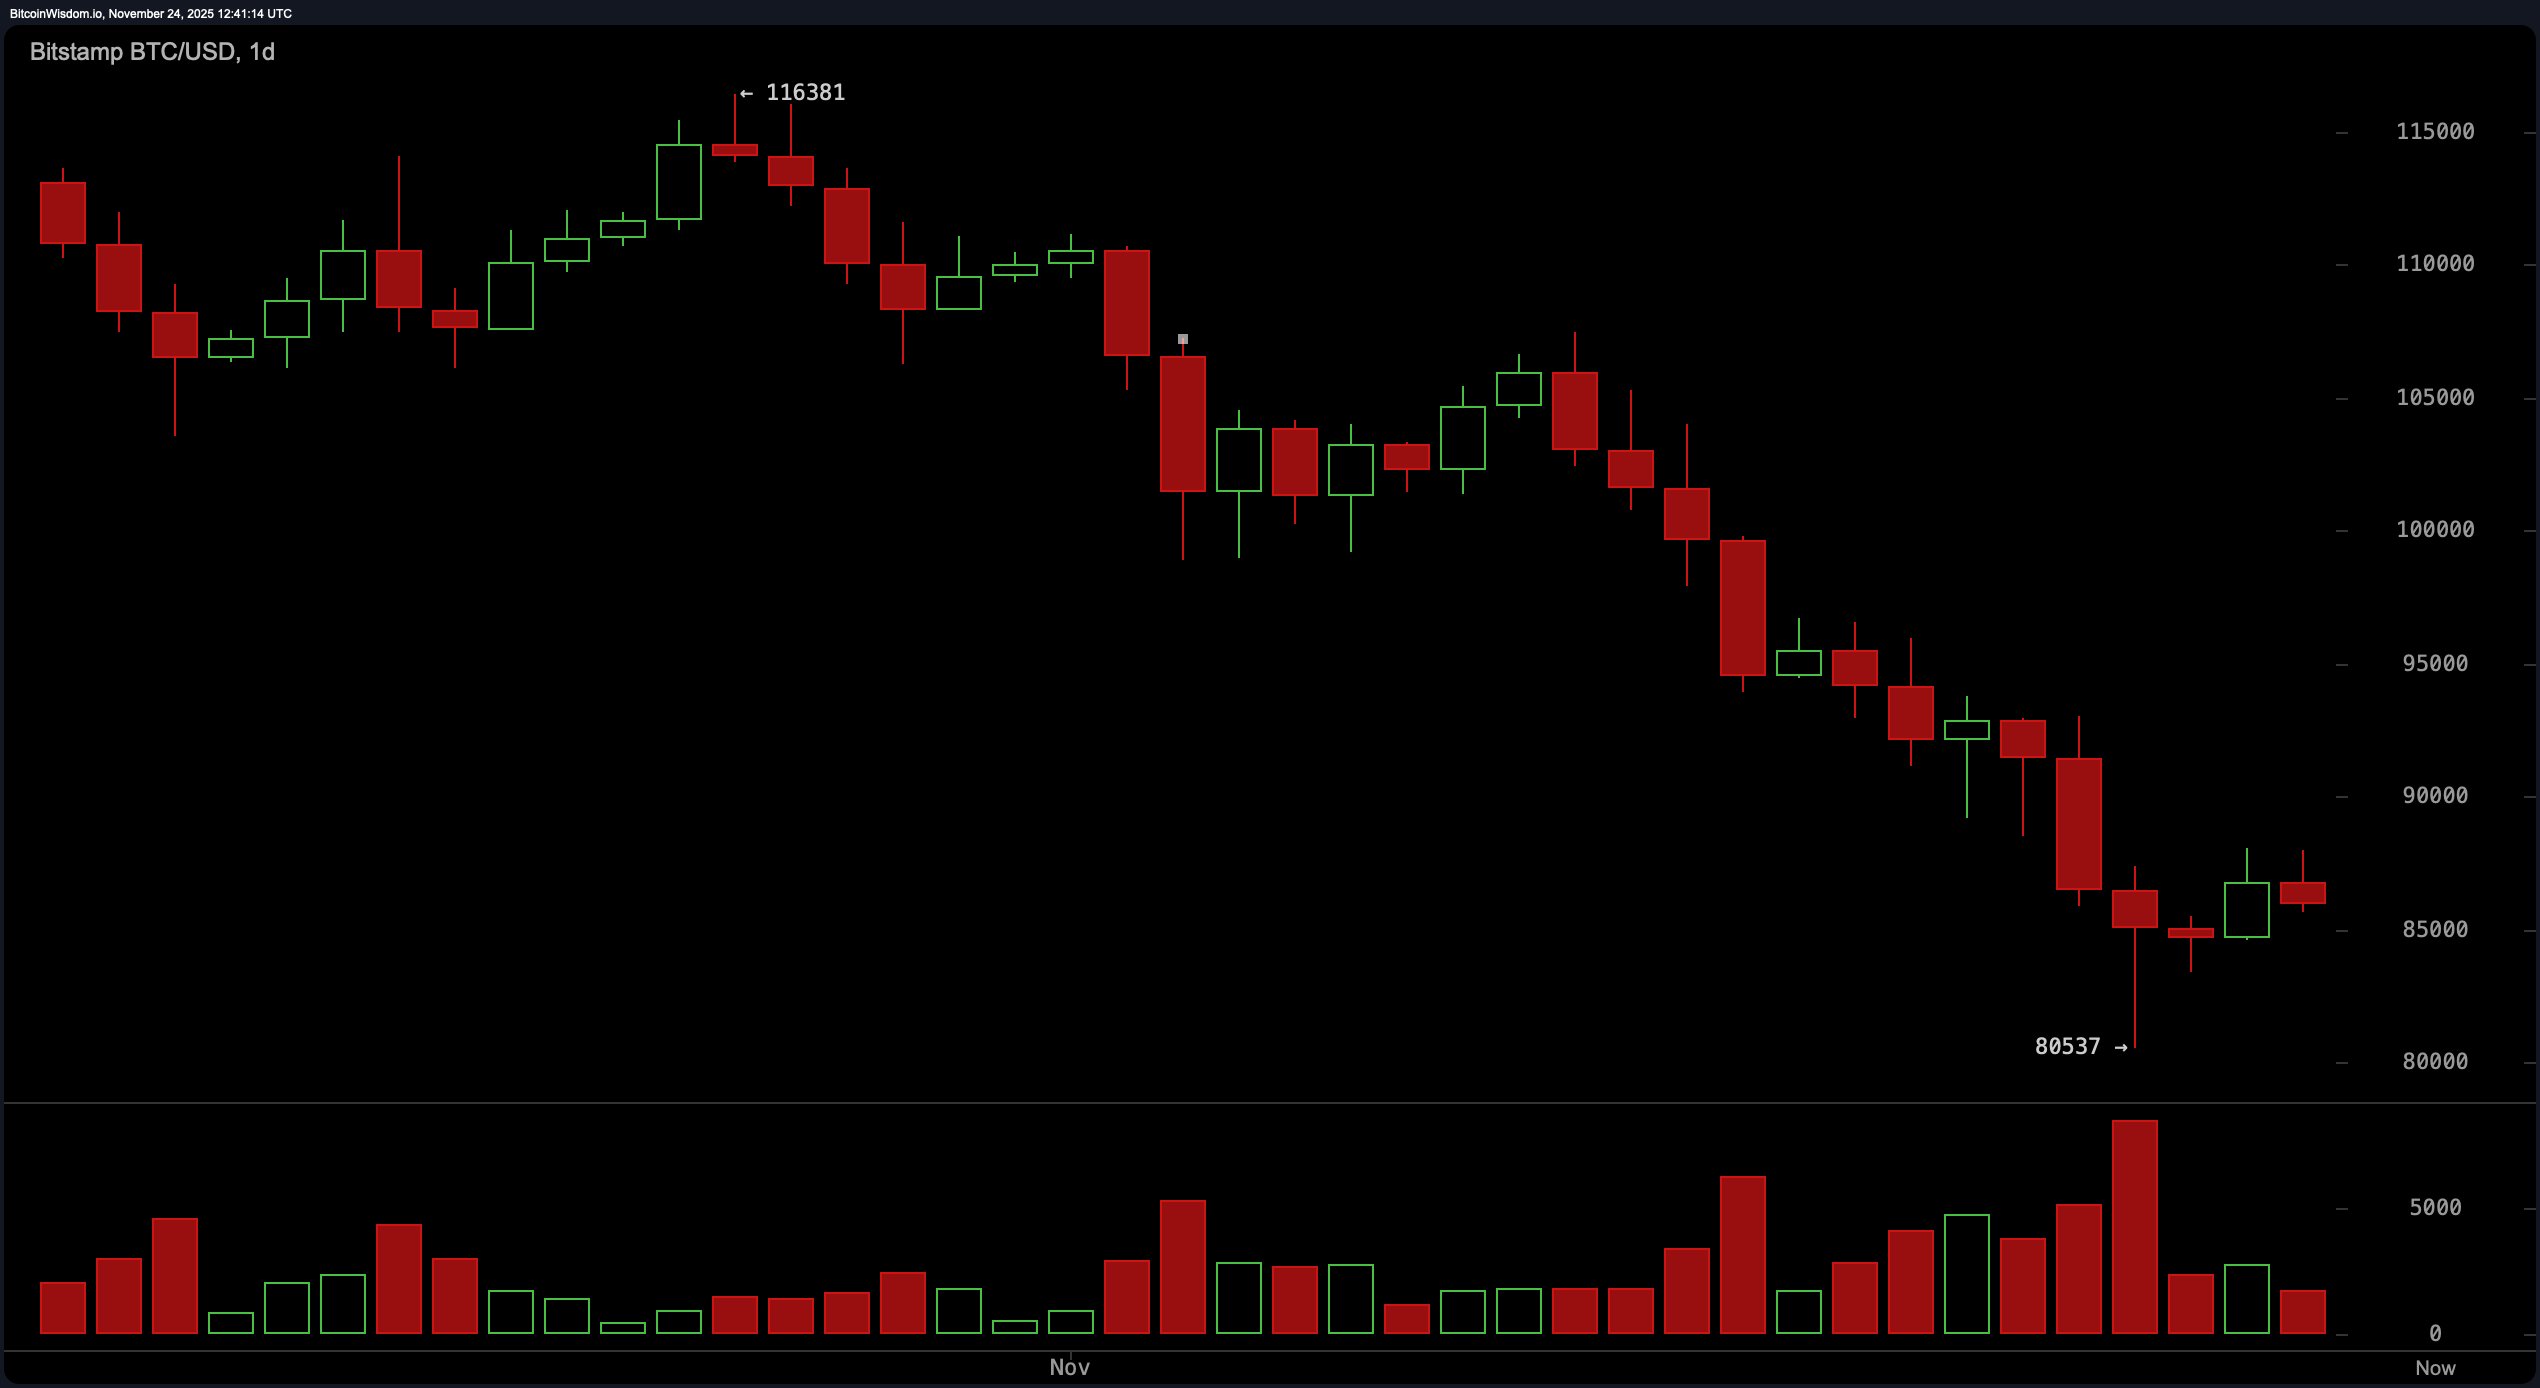
In the daily timeframe, bitcoin is riding a downward escalator, marked by lower highs and lower lows, all while volume spikes like it’s had one too many espressos. Despite this bearish macro structure, the asset has flirted with the $80,537–$85,000 level, showing signs of a short-term bottom.
The resistance zone looms overhead at $95,000–$100,000, a formidable ceiling not easily shattered. Until a higher high is formed, any optimism here is more counter-trend ambition than solid reversal. The trend remains as charmingly stubborn as ever.

BTC/USD 1-day chart via Bitstamp on Nov. 24, 2025.
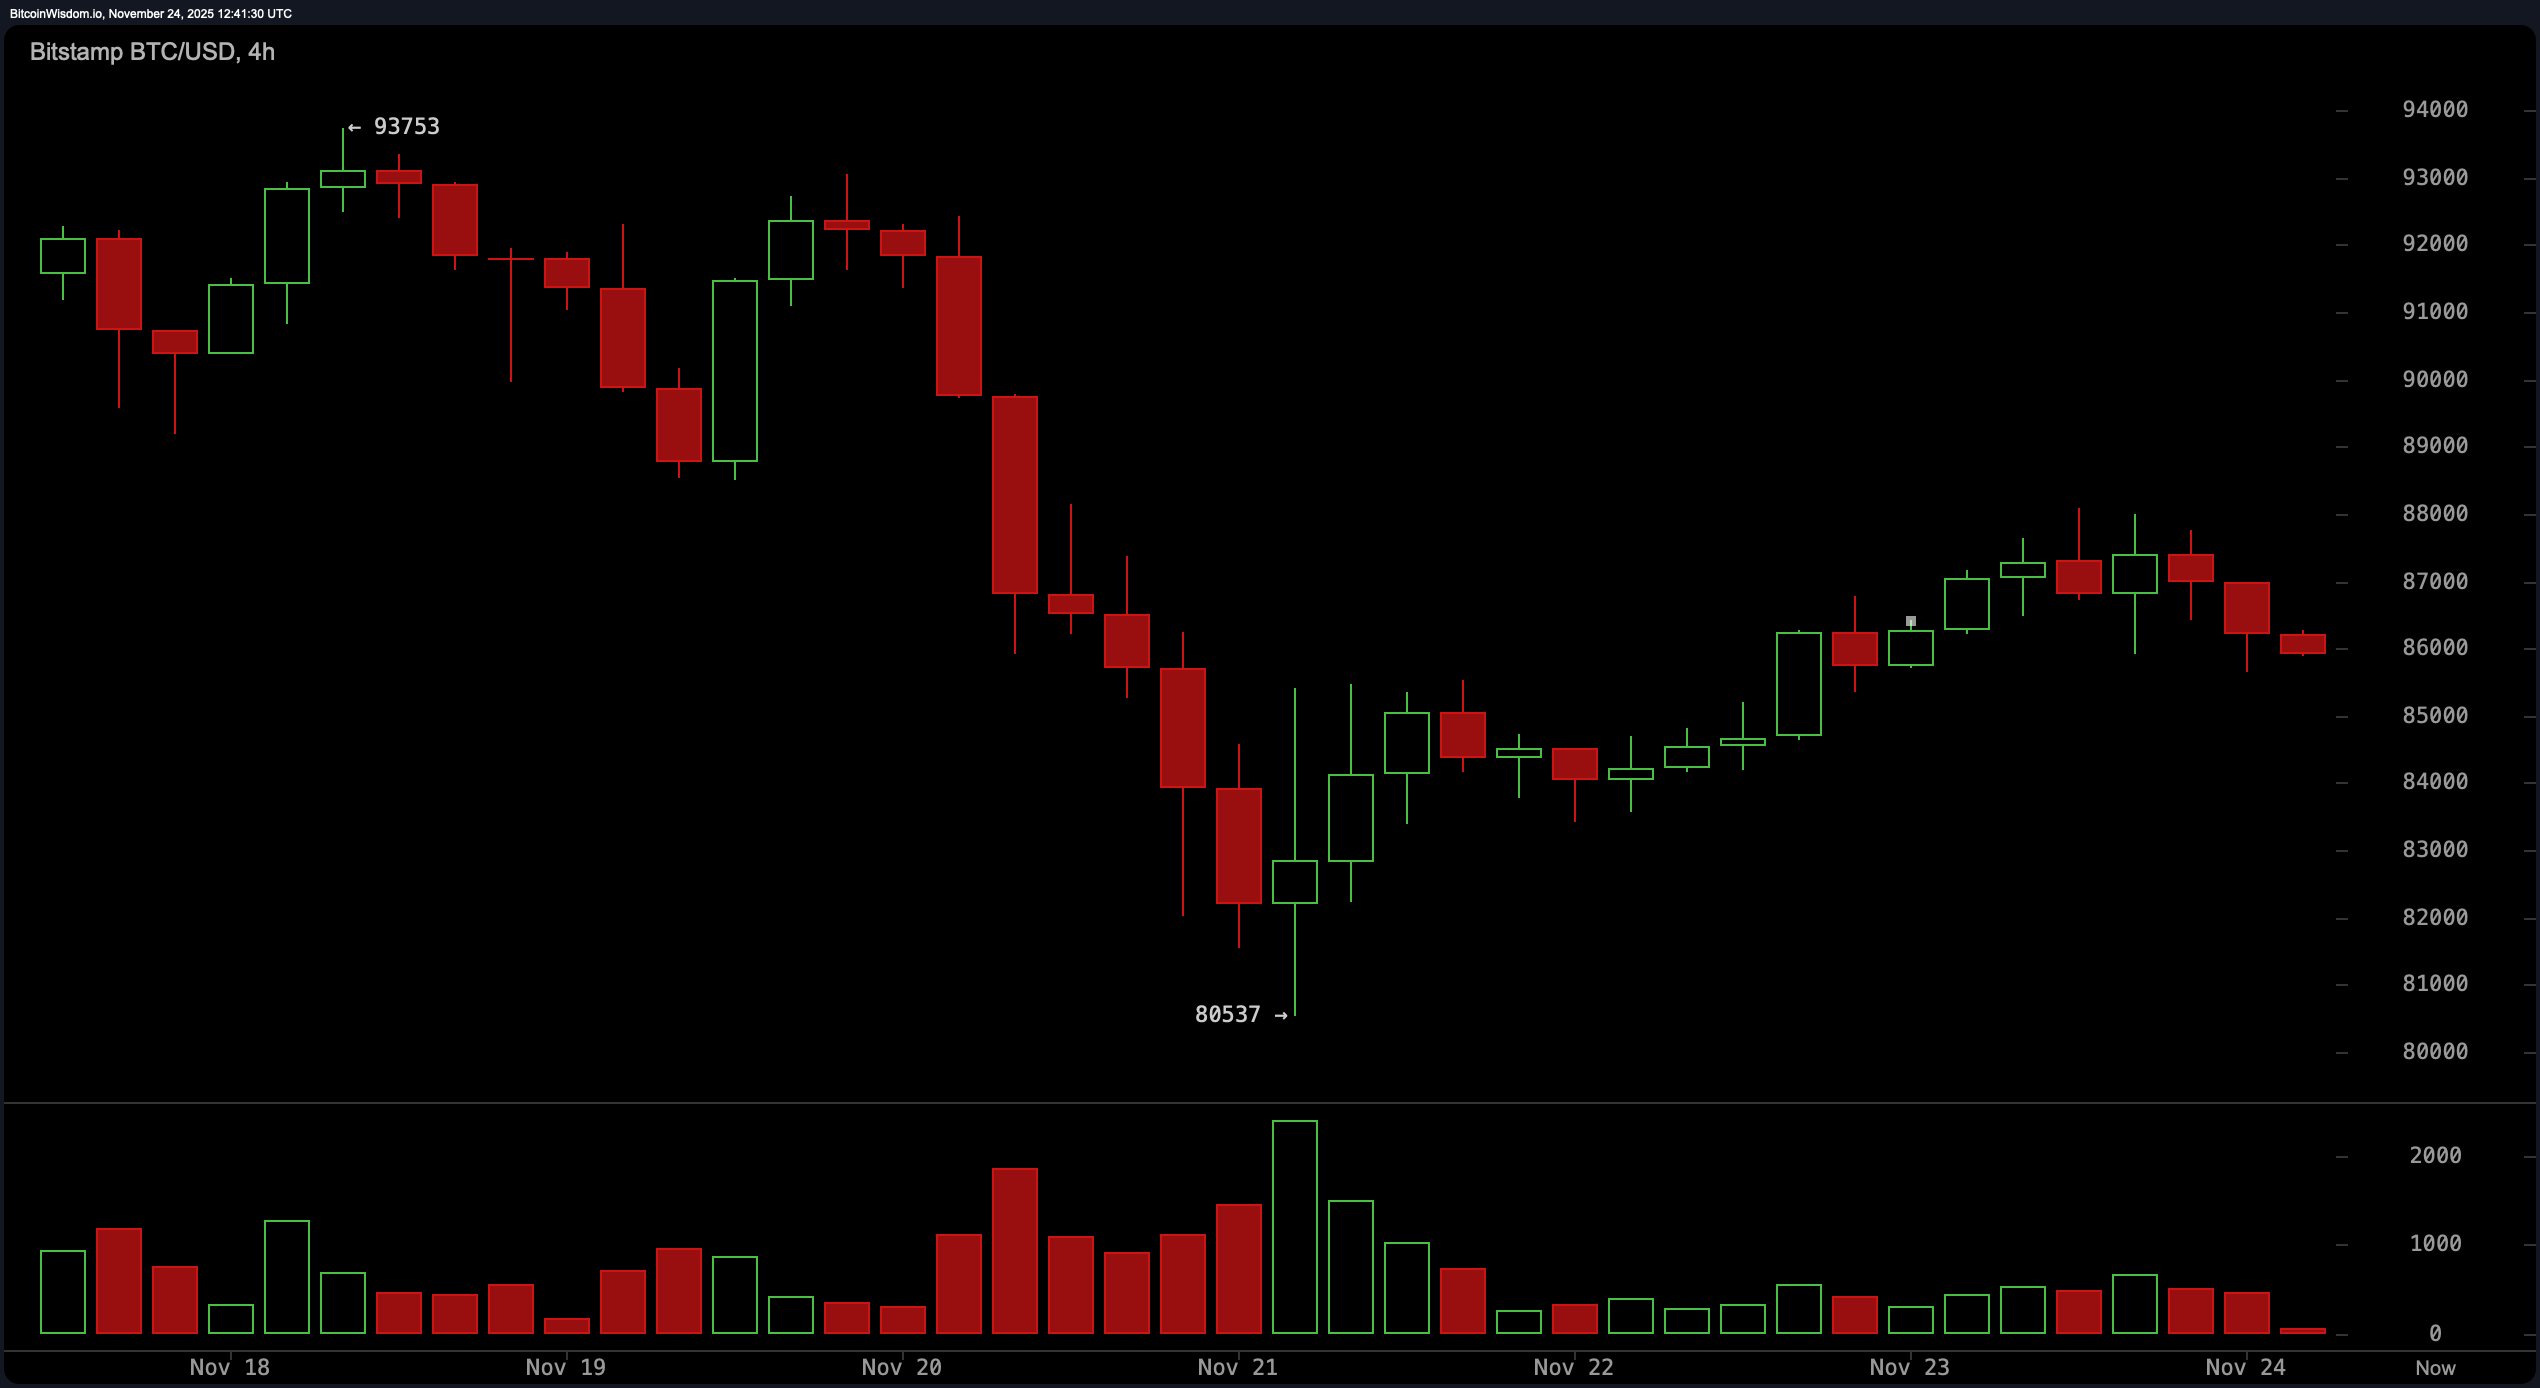
Zooming in to the 4-hour chart, bitcoin appears to be staging a bit of a comeback—albeit with a cautious side-eye from the broader bearish backdrop. The price bounced from $80,537 and is now forming higher lows, indicative of a short-term uptrend. Still, resistance around $87,000–$88,000 is proving to be a stiff drink to swallow. Momentum is shifting like a sleepy tide, and while there’s potential for near-term gains, the real test lies in whether bitcoin can confidently breach $90,000 with volume riding shotgun.

BTC/USD 4-hour chart via Bitstamp on Nov. 24, 2025.
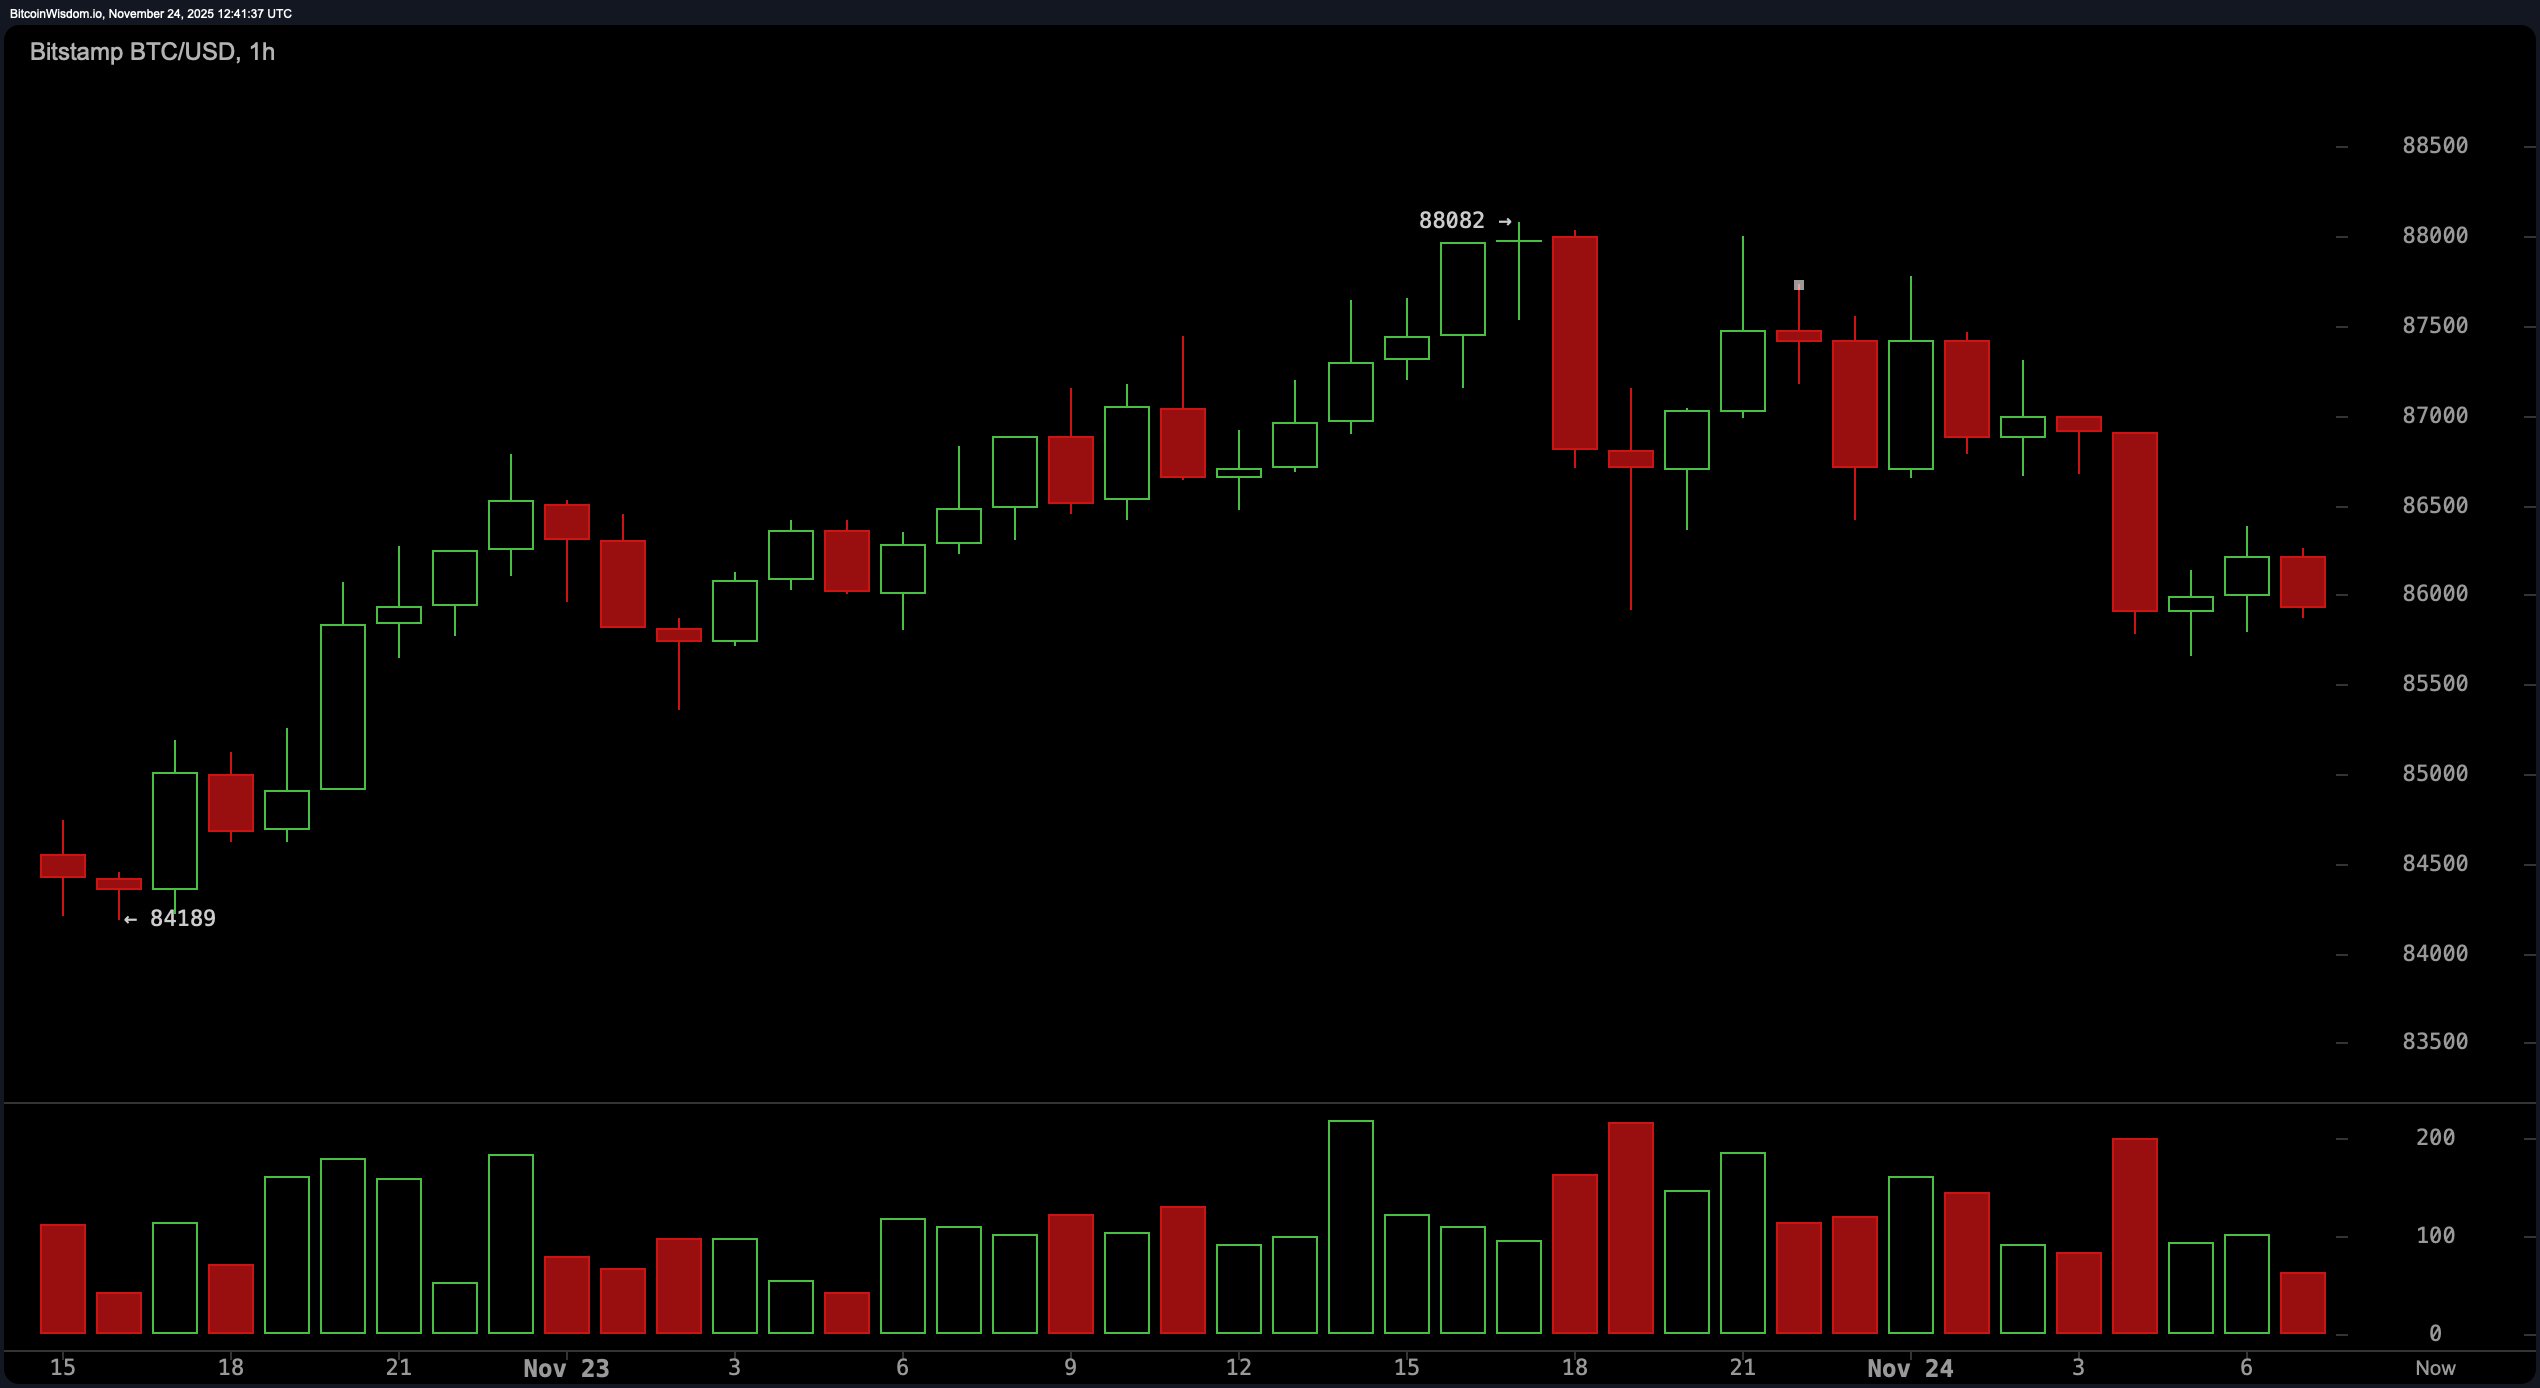
The 1-hour chart paints a picture of micro-chaos and finesse, as bitcoin made a short climb from $84,000 to nearly $88,000 before softening into a consolidation phase. We’re currently witnessing a suspicious drop in volume—never a good sign when price keeps nudging up—which might hint at a bearish divergence brewing. A support break below $85,000 could trigger a quick retest of recent lows, while upward targets at $87,500–$88,000 remain viable for the nimble-fingered.

BTC/USD 1-hour chart via Bitstamp on Nov. 24, 2025.
Oscillators are serving up a cocktail of mixed signals. The relative strength index (RSI) is at 28, a rather noncommittal stance, echoed by the Stochastic at 20 and the commodity channel index (CCI) clocking in at –100. The average directional index (ADX) sits at 46, hinting at a decent trend strength, though not directional enough to pop champagne. Momentum shows promise at –8,491, while the moving average convergence divergence (MACD) flirts with pessimism at –5,928—contradictory cues, as always in crypto’s grand performance.
Lastly, moving averages across the board are lined up like a pessimistic parade. From the exponential moving average (EMA) and simple moving average (SMA) at 10 periods all the way to the daunting 200-period duo, every single signal is positioned above the current price. The EMA (10) at $89,637 and the SMA (10) at $89,535 already set a chilly tone, while the 200-period EMA and SMA at $105,981 and $110,126, respectively, suggest that bitcoin would need a pair of rocket boots to catch up. It’s a stark reminder: until price begins a committed ascent, moving averages are the gatekeepers of gravity.
Bull Verdict:
If you’re rooting for the upside, the glimmers of hope come from short-term momentum on the 4-hour and 1-hour charts. A string of higher lows suggests that bitcoin might be attempting to dig itself out of the $80K range rut. If it can punch through the $88,000–$90,000 resistance band with strong volume, it could signal the start of a trend reversal. Until then, any enthusiasm is best kept cautiously optimistic.
Bear Verdict:
For those embracing their inner bear, the macro trend remains decisively unfriendly. Daily charts tell a sobering tale of lower highs and lower lows, with every major moving average glaring down from above the current price. The moving average convergence divergence (MACD) confirms downside pressure, and weakening volume on short-term rallies hints at fading strength. Unless bitcoin stages a breakout above $90K with conviction, the gravitational pull of sub-$85K zones may soon call again.
- What is bitcoin’s current market status? — As of Nov. 24, 2025, bitcoin is priced at approximately $86,187 with a market cap of about $1.71 trillion and a 24‑hour trading volume near $69.40 billion.
- What was the intraday trading range for bitcoin today? — The intraday price band for bitcoin ranged between roughly $85,700.98 and $87,995.
- Are key trend‑indicators showing strength or weakness? — On both daily and shorter time‑frames, moving averages are aligned above bitcoin’s price, and oscillators are mixed, suggesting more caution than conviction.
- What must happen for bitcoin to shift direction meaningfully? — A convincing breakout above roughly $90,000 with strong volume would be required for bitcoin to change its current technical trend.
免责声明:本文章仅代表作者个人观点,不代表本平台的立场和观点。本文章仅供信息分享,不构成对任何人的任何投资建议。用户与作者之间的任何争议,与本平台无关。如网页中刊载的文章或图片涉及侵权,请提供相关的权利证明和身份证明发送邮件到support@aicoin.com,本平台相关工作人员将会进行核查。


