It's the weekend, and I have managed to get through a hectic week. The main reason is that the pace of the decline has been too fast, and every day I've been hurriedly setting levels and adjusting my rhythm according to the market changes. After all, we are in the early stages of a bear market, and the speed of the decline does not allow me to proceed step by step. Today, I finally have some time to sort out what has been happening recently and the truth behind it.
If we understand the waterfall spike on October 11th as a behavior to clear leverage, we can tentatively consider it a bull market pullback. However, the decline in November is the real bear market.
In the current market, there are still many people stubbornly believing that this round of decline is a normal correction within a bull market. After all, a 30% drop is not uncommon in previous bull markets. I am starting to get confused about whether these people promoting the bull market are blinded by their own losses or are just talking nonsense for money. The former is foolish, while the latter is simply bad.
Let's not argue about whether this is a bear market or a bull market correction. According to the theory of these old dogs, a 30% correction in a bull market is a normal phenomenon.
What cannot be ignored is the principle behind a 30% correction in a bull market. It is a behavior to clear leverage and to prevent retail investors from entering in large numbers. Therefore, during the bull market's rise, a 30% correction accompanies the process. Once the leverage is cleared, the market can rise faster. According to this logic, the classic fluctuation of a correction in a bull market is a spike, where there is a rapid drop during the rise, clearing out leverage and then quickly rebounding, without giving a second chance to re-enter. By the time you react, you can only chase the high again. As long as you hold with leverage for the long term, you will not escape the next spike waterfall. This is what is referred to as a 30% correction in a bull market.
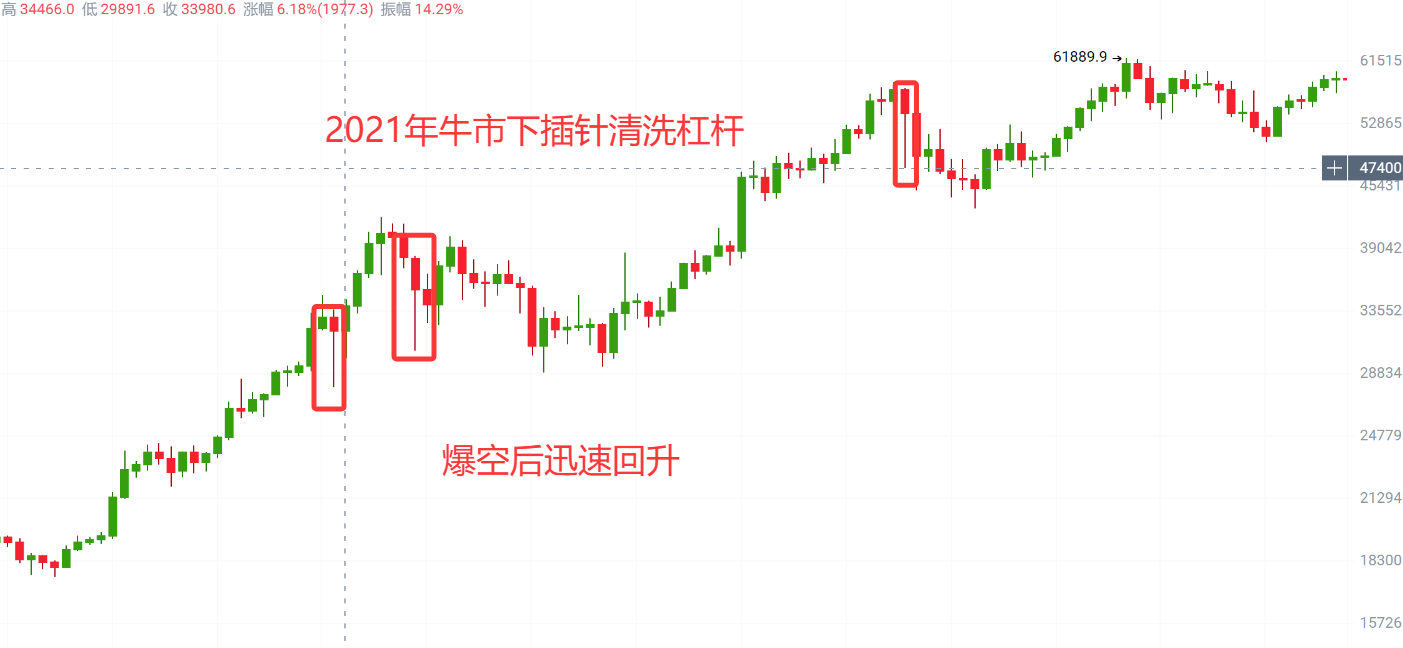
But what about now? You want to carve a boat to seek a sword. I will satisfy the curiosity of these gamblers. Look at the chart; this is the bull market in 2021, accompanied by rapid drop spikes during the rise, followed by a quick rebound, continuing to push the bull market forward.
Now look at last year's election, after Bitcoin broke 74,000, in early April this year during the tariff bill signing phase, Bitcoin corrected once at 74,000, starting the second phase of the bull market. Did you notice any rapid spike waterfalls in between?
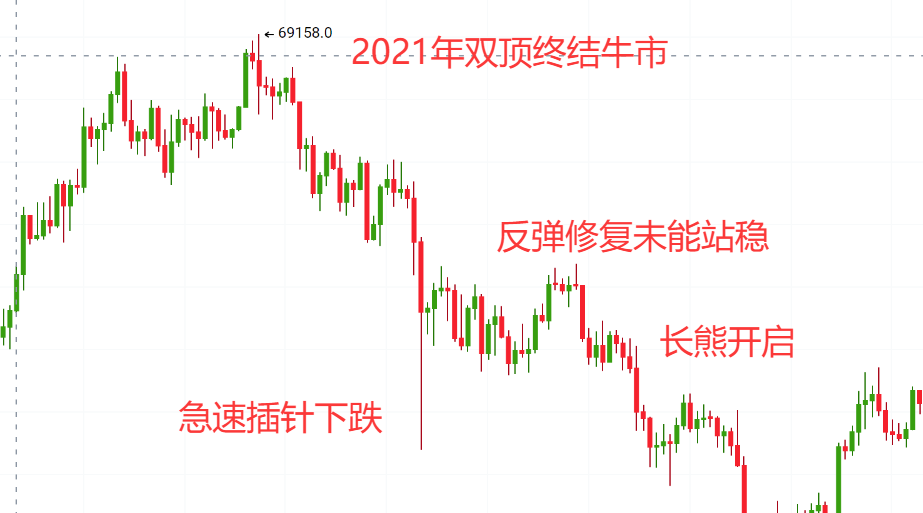
In May 2021, the bull market formed a triple bottom at the price of 29,000, which led to a surge to 69,000, forming a double top before transitioning to a bear market, with the first wave of rapid spike waterfalls followed by a rebound that failed to stabilize, leading to a steady decline afterward.
In the 2025 bull market, a triple bottom formed at the price of 74,000 in June, leading to a surge to 126,000, also forming a double top. Similarly, there was a wave of rapid spike waterfalls, followed by a rebound that also failed to stabilize, and recently it has been steadily declining.
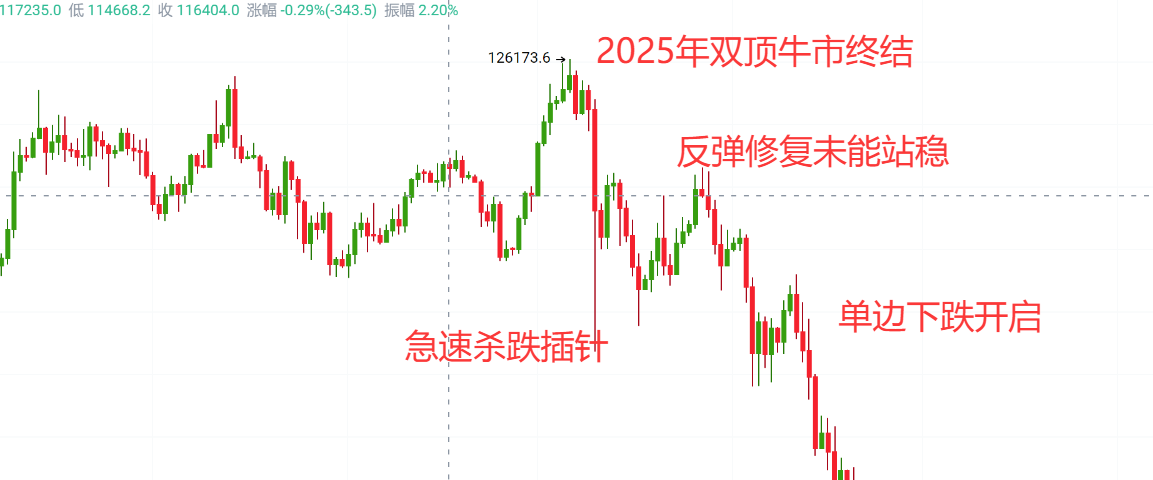
In terms of timing, the peak of the 2021 bull market occurred on November 10, while the highest point of the 2025 bull market at 126,000 occurred on October 6, with less than a month between them.
I have no subjective emotions or ulterior motives; I am merely pointing out the commonalities between the two bull markets. This is not nonsense; it is a market trend that has already unfolded in history. Come on, those who shout bull market, feel free to refute.
On a macroeconomic level—
The Bank of Japan has confirmed an interest rate hike in December. The long-term low interest rates of the yen have become the most popular borrowing product globally. What does this mean? Because the interest on the yen is extremely low, borrowing yen against assets and then converting it to dollars to invest in U.S. stocks is the largest hot money in U.S. stocks. Once the Bank of Japan raises interest rates, the cost of borrowing yen will increase, and the funds that previously borrowed yen to buy U.S. stocks will need to cash out to repay the yen; otherwise, the interest rates will be too high, and the cost pressure will be too great. The U.S. stock market can only follow with a decline. I declare that this is not my subjective prediction of the market, but rather the underlying logic of the yen's correlation with the U.S. stock market. If the U.S. stock market declines, can Bitcoin still rise? What is Bitcoin? It is merely a secondary reservoir for hot money from the U.S. stock market. If the big brother can't hold on, what can the little brother expect?
Regarding the U.S. stock market, specifically the Nasdaq and Nvidia—
The Nasdaq is currently the largest bubble area in the U.S. stock market, and it has not collapsed yet, largely supported by Nvidia. Last night, both Nvidia and Bitcoin experienced significant rebounds, largely due to Trump announcing that he is considering exporting the H200 to us. It seems that the former president is anxious; the U.S. stock market cannot collapse, so he quickly comes out to shout. Indeed, the effect is quite good; it has held up the market. But how long can you hold it? We didn't buy the H20 before; now you want to export the H200, can we still buy it? When the imperial army wasn't here, you bullied me; now that the imperial army is here, you still bully me. It turns out the imperial army came for nothing. Back then, you had the H20 around my neck, and I invested manpower and resources to break through chip research and development. Now you plan to use the H200 to undercut me, as if my efforts were in vain. Is that possible?
This news can drive market sentiment and help Nvidia halt its decline and allow Bitcoin to brake. To a large extent, it shows that the current market is in a state of panic and is grasping at straws; any good news is a lifeline, further indicating the market's fear.
If we consider the non-farm payroll data released last week, we can see the current White House's attitude towards the U.S. stock market. Employment numbers exceeded expectations last week, and the unemployment rate also rose. Don't you find it magical that both employment and unemployment have increased? How dare they release this data so grandly? It is truly a last resort. Employment needs to support the U.S. stock market, while unemployment needs to support U.S. Treasury bonds. The Federal Reserve is not listening and cannot be controlled, so Trump can only step in personally. You don't care whether it's reasonable or not; the Labor Department will act according to my wishes.
Look at the reaction of the U.S. stock market. In recent days, it has been very volatile, completely different from Bitcoin's stable decline. What is going on? Isn't it just telling institutions to run quickly? Through this shakeout, on one hand, it allows institutions to gradually offload without being trapped, and on the other hand, it cleans out the leverage in the U.S. stock market to prevent a rapid decline from causing a chain reaction that leads to a meltdown.
On the institutional level—
In the past ten days, the market has been steadily declining day by day. In the first few days, the market was still looking for reasons and analyses, trying to argue that the decline was merely due to unexpected news, attempting to comfort themselves not to panic.
However, as the 93,000 level was broken, everyone began to fall silent. This silence is the most terrifying.
Because everyone is gradually accepting reality, there is no shocking bad news in the market; in fact, there are many positives (the end of tapering on December 1). It is simply a decline.
Moreover, this decline is too strange. There has been no strong rebound touching key support levels (93,000 support, 98,000 support), nor has there been a panic sell-off (breaking 93,000, breaking 98,000).
It's like boiling a frog in warm water; every day, it steadily traps long positions. When you want to bottom-fish, it breaks down; when you want to cut losses, the market just consolidates and rebounds.
By the time you start to hesitate and observe, the market starts to decline.
This kind of trend is not something human traders can create.
Humans are emotional animals; being human means being greedy, hesitant, and panicked.
A traditionally human-operated market has peaks and troughs, with wide fluctuations, while this recent almost surgical precision in the decline leads me to conclude one thing.
AI computing power has completely taken over the market.
Today, with the rapid iteration and upgrade of AI computing power, traditional quantitative trading has long since exited. Whether we use quantitative methods or not, they are still based on human-defined indicators and strategies. Quantitative robots trading automatically still fundamentally require human control of the underlying logic; at most, they serve as auxiliary tools.
Now, AI computing power is writing its own underlying logic and executing strategies on its own.
So what does this have to do with Bitcoin's ten-day decline?
This is the terrifying aspect of this ten-day decline.
I call this behavior computational resonance.
What does it mean? It means that these large institutions and hedge funds, although they use different AI modules, are filling the same training data, all fed the same news, macroeconomic data, and learning the same historical trends, collectively referencing market liquidity.
Similar to AlphaGo, high computing power has completely grasped the market boundaries. Facing the current market, their conclusions are surprisingly consistent, leading to an orderly retreat.
Human retreats vary because each person's size and tolerance differ, which can cause a chain reaction. We can never know other people's true thoughts.
AI is different; AI can calculate the current market's absorption capacity through the thickness of order walls. When it calculates that the market can only absorb 1 billion today, it will only sell 1 billion worth of orders, not a penny more, to avoid crashing the market.
Thus, we see a very strange phenomenon: there is strong buying at both the 98,000 and 93,000 levels, but after the entity breaks, there is no panic sell-off (chain reaction). This is why, over these nine days, the daily decline has been so well controlled, so despairing. This is a perfect, AI-driven mass retreat (bear market).
Why does AI want to run? They must have seen clues that we have not discovered.
You must understand that the core logic of AI models is not to make money but to mitigate risk. Bitcoin, as a high-risk asset, has its rise and fall primarily dependent on liquidity. The purpose of AI is to complete risk mitigation. Therefore, if they are not optimistic about Bitcoin, it is essentially a pessimistic view on liquidity. It is currently most sensitive to liquidity, and AI has no emotions or beliefs; it only cares about the mathematical results derived from data and news calculations. The current results show that the risk-reward ratio of holding Bitcoin is no longer favorable.
Thus, the market is beginning to experience ruthless selling.
Bitcoin's technical aspect—
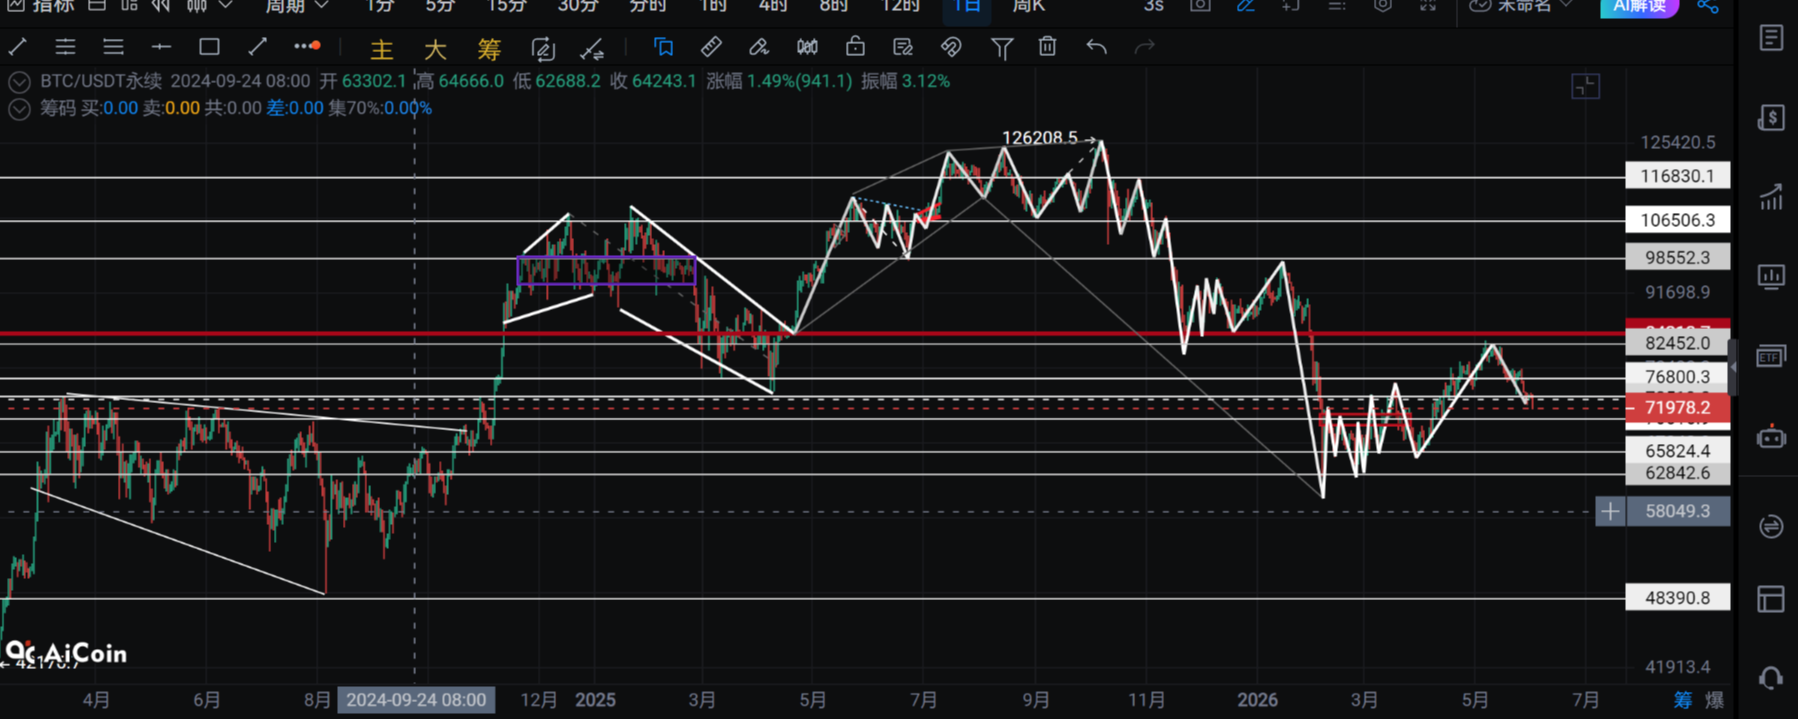
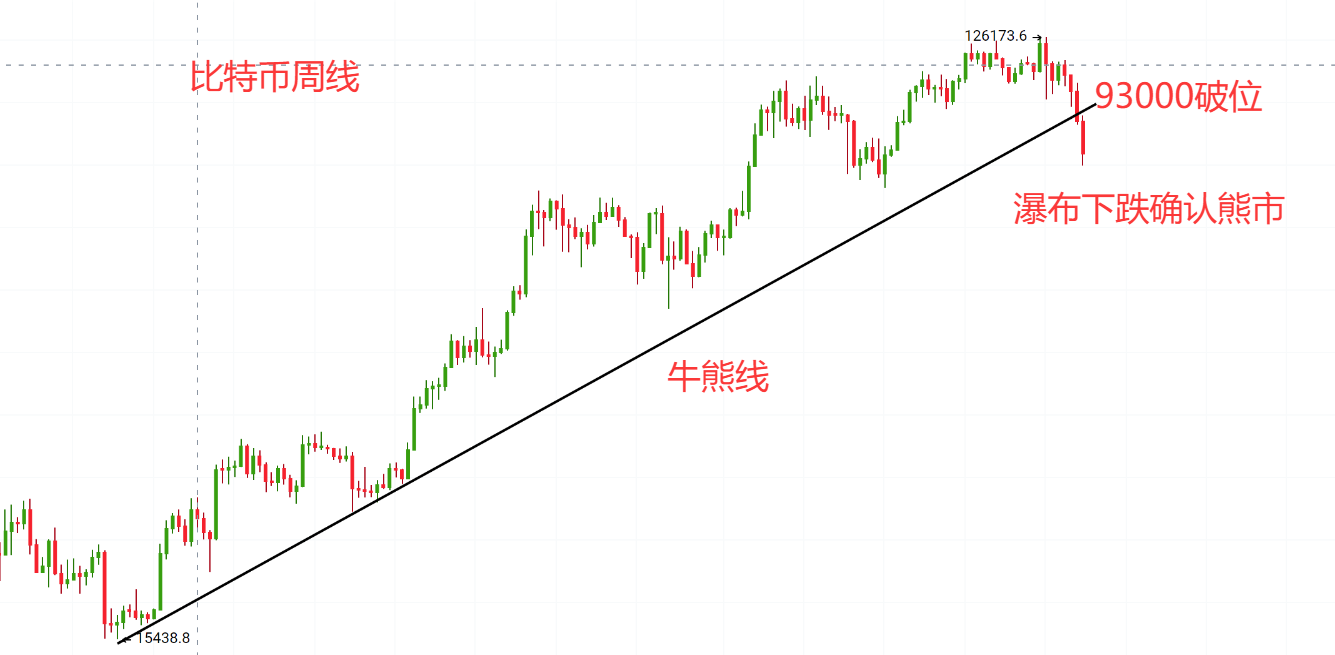
Directly looking at the chart, it is intuitive and clear. The upward trend line extended from the bear market bottom of 15,500 in 2022 has now been pierced. Note the continuous dips and rebounds at 93,000 at the beginning of the week, clearly breaking below the bull-bear line, with the rebound under pressure, standardly breaking the bull market structure, confirming the top-bottom conversion pressure, and initiating a second decline. This second decline is still a waterfall decline, confirming a bear market structure.
Summary: In this round of the bear market, whether considering historical bull and bear cycles, macroeconomic factors, or the orderly and rhythmic selling by institutions (the daily selling volume corresponds to the thickness of the market order wall; the more buy orders there are, the more they sell, which is why we see strong rebounds every time the market hits key support levels. This indicates that institutions have sold off their inventory for the day, and when market sentiment improves, they will sell a new batch), all point to the formation of a bear market.
Subsequent Market Judgments:
Although Bitcoin held strong at around 81,000 last night and the rebound currently looks quite strong, this also aligns with the characteristics of institutional selling I just mentioned.
If we look at historical bull and bear patterns, Bitcoin tends to initiate a significant rebound as it approaches a triple bottom. I am currently unsure if 81,000 counts as a strong rebound close to a triple bottom. If it does, this wave of rebound is not over yet, and it could test 98,000 again. If it does not, then this wave of decline will start from the weekend's consolidation position, breaking below 81,000 and accelerating down to around 74,000, followed by a strong rebound. However, this rebound is not a bull market return; it merely provides hope to the market in preparation for a complete breakdown below the triple bottom at 74,000.
In terms of operations, one can gradually build short positions in the range of 85,000-88,000 (total position 5%). If the market breaks through 89,000, open long positions to hedge. When it rises to 98,000, close the long positions and add to the shorts (adding 5%). During the consolidation phase around 74,000, close all short positions and wait for the end of the 74,000 range-bound phase before initiating a new round of shorts as the market breaks down.
Follow for more insights, and let the hunter guide you on the fast track.

免责声明:本文章仅代表作者个人观点,不代表本平台的立场和观点。本文章仅供信息分享,不构成对任何人的任何投资建议。用户与作者之间的任何争议,与本平台无关。如网页中刊载的文章或图片涉及侵权,请提供相关的权利证明和身份证明发送邮件到support@aicoin.com,本平台相关工作人员将会进行核查。