Zhou Yanling: What to Expect After the Bitcoin Crash on November 22? Latest BTC ETH Trend Predictions and Trading Strategies Today
In just a month and a half, the price of Bitcoin has dropped from $126,000 to around $80,000, a decline of over 35%. Especially in recent days, it has continuously hit new lows, plunging the market into deep panic. Many people ask me why it has dropped so sharply again recently. In fact, there is no need to overthink it; it’s just the main players "smashing the market" to kill the bulls, a common tactic in the crypto space. Just get used to it. If you look at the amount of long positions held during the previous bull market, you’ll understand. The slightly better news is that after several Federal Reserve officials collectively signaled a dovish stance yesterday, the market has begun to bet on further interest rate cuts in December, which has temporarily halted this wave of panic. However, this bottoming process is not yet complete, so don’t rush to catch the bottom. It is expected that the market will test the $80,000 and $75,000 levels again, then fall into a period of silence and sideways movement, grinding the bottom for a while before the bull market resumes.
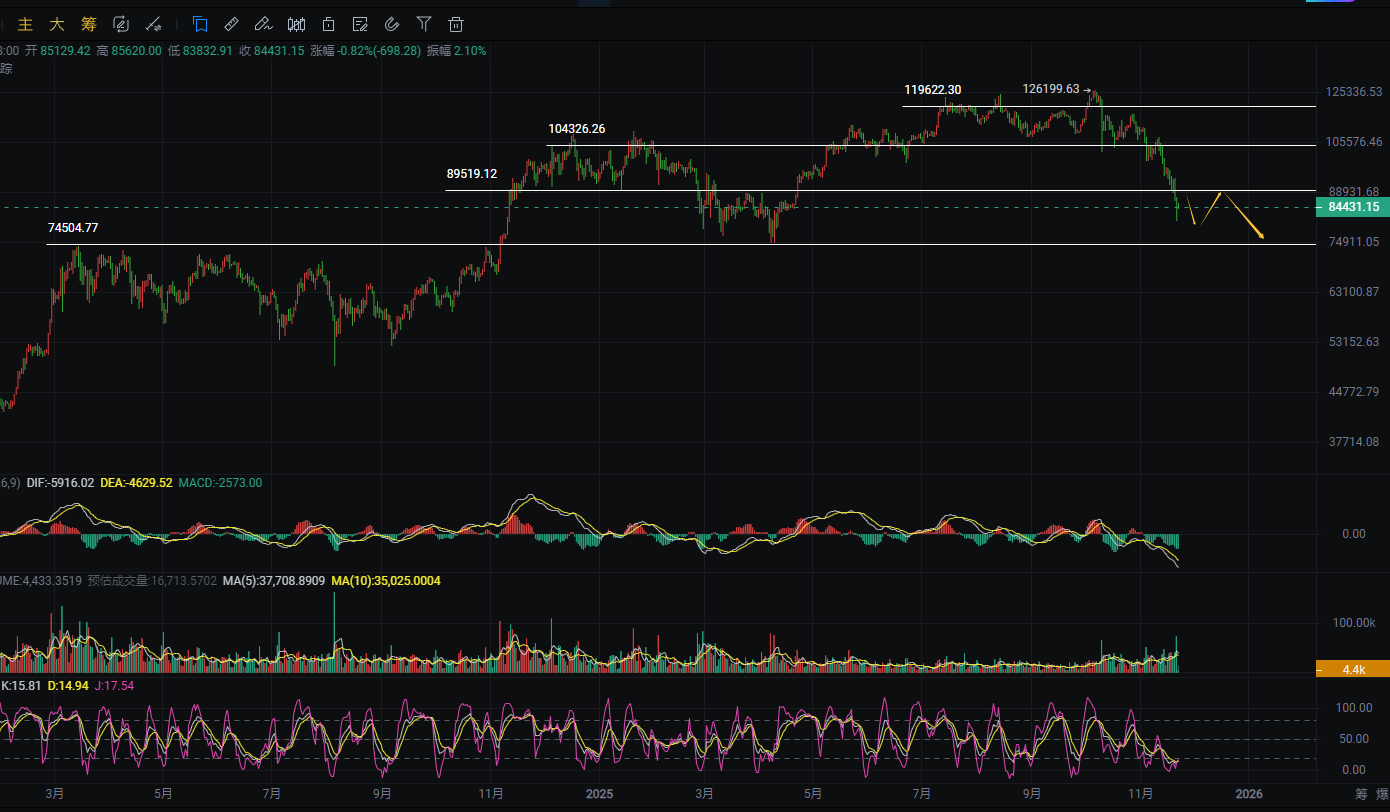
Currently, from a technical analysis perspective, the daily chart of Bitcoin shows a continuous decline, forming a large bearish candle, and there has been a slight short-term rebound, but overall it remains in a downward trend. The hourly chart has seen significant fluctuations recently, with multiple attempts to break through but failing to hold at higher levels, showing a weak oscillating trend. The MACD technical indicator on the hourly chart shows both DIF and DEA are negative, and the MACD histogram has alternated between red and green multiple times, indicating that the market direction is unclear in the short term, with bearish forces prevailing. The RSI on the hourly chart is hovering between 43-49, not entering the overbought or oversold zones, indicating that current market sentiment is slightly weak and neutral. The EMA on the hourly chart shows a bearish arrangement for the 7, 30, and 120 moving averages, with prices consistently below EMA7 and EMA30, indicating strong short-term pressure; EMA120 is far from the current price, and the long-term trend remains bearish.
Zhou Yanling's Short-term Trading Strategy for Bitcoin on November 22:
Short at 86,000-85,200, stop loss above 87,000, target 82,500-81,500
Long at 81,500-82,500, stop loss below 80,500, target 84,500-85,500
Zhou Yanling's Short-term Trading Strategy for Ethereum on November 22:
Short at 2,820-2,780, stop loss above 2,870, target 2,670-2,620
Long at 2,620-2,670, stop loss below 2,570, target 2,750-2,800
【The above analysis and strategies are for reference only. Please bear the risks yourself. The article's review and publication may have delays, and the strategies may not be timely. Specific operations should follow Yanling's real-time strategies.】

This article is exclusively shared by senior analyst Zhou Yanling (WeChat public account: Zhou Yanling). The author has been engaged in market investment research in the crypto space for over ten years, currently focusing on analysis and guidance for BTC, ETH, DOT, DOGE, LTC, FIL, EOS, XRP, BCH, ETC, BSV, and other crypto contracts/spot operations. With a solid theoretical foundation and practical experience, he excels in combining technical and news-based operations, emphasizing capital management and risk control. His trading style is steady and decisive, recognized by many investment friends for his easygoing yet responsible character and sharp, decisive operations.
免责声明:本文章仅代表作者个人观点,不代表本平台的立场和观点。本文章仅供信息分享,不构成对任何人的任何投资建议。用户与作者之间的任何争议,与本平台无关。如网页中刊载的文章或图片涉及侵权,请提供相关的权利证明和身份证明发送邮件到support@aicoin.com,本平台相关工作人员将会进行核查。


