Bitcoin dropped to a low of $89,000 yesterday. Ethereum fell below $3,000, triggering panic in the market. In the past 12 hours, the market has seen a rebound, with Bitcoin climbing back above $92,000 and Ethereum returning to $3,100. Just as retail investors were shouting that the "bear" market has arrived, Trump brought good news along with Standard Chartered.
Recently, Trump stated at the White House that he has decided to replace the current Federal Reserve Chairman Powell before Christmas, and there is already a list of five candidates. Since mid-year, Trump's hiring criteria have remained consistent, leaning towards selecting a chairman who supports interest rate cuts, directly touching on the sensitive core of the Federal Reserve's independence. However, this could also bring risks of uncertainty, such as court lawsuits, internal governance of the Federal Reserve, and a reassessment of independence by financial markets, which may lead to increased volatility and a risk-based repricing of the dollar and interest rates in the short term.
Another piece of news comes from the head of digital research at Standard Chartered, who stated that the recent correction in Bitcoin seems to have come to an end and expects Bitcoin to see a rebound by the end of this year. However, Bitcoin still needs to reclaim the $95,000-$100,000 range, as the market structure continues to deteriorate, especially with increasing on-chain pressure and ETF fund outflows.
Bitcoin Four-Hour Chart
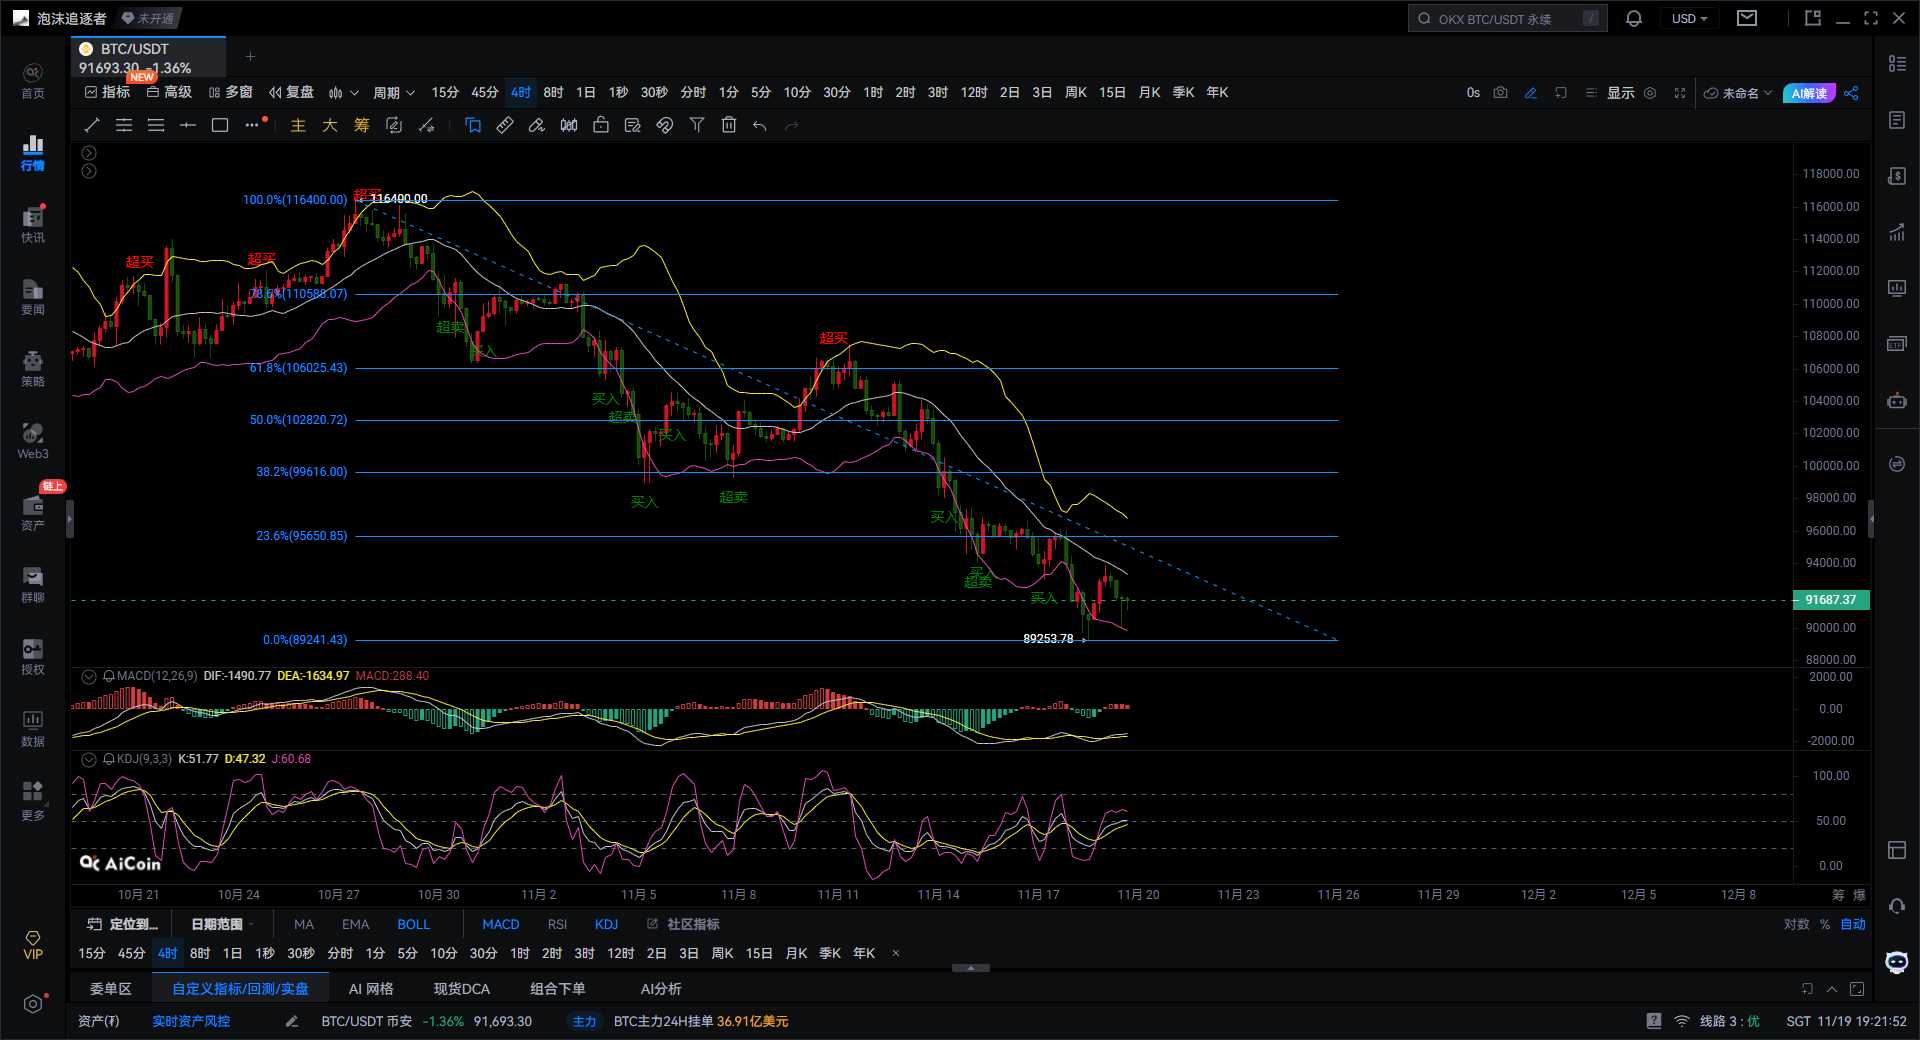
Let's first look at the overall situation. Bitcoin has dropped from a high of $116,400 to a low of $89,241, and is now fluctuating between $91,600 and $91,800. This is a volatile situation, but various indicators are suggesting that a change may be coming.
First, let's talk about the Fibonacci retracement levels. From the high of $116,400 to the low of $89,241, the current price is stuck below the 23.6% level at $96,560. This indicates that the rebound is still weak, unable to surpass even the first retracement level. If it can't stabilize above 23.6%, the market remains weak. The key resistance levels are threefold: $93,500 is the resistance of the downward trend line, $96,560 is the 23.6% Fibonacci level, and $99,600 is the 38.2% level—only breaking through these levels would signify a true reversal of the downward structure. Clearly, we are not at that point yet.
Next, looking at the downward trend line, which is the dashed line sloping downwards to the right on the chart. The price has attempted to push upwards several times but has been pushed back by this line, indicating that the bears have not yet surrendered. For a reversal to occur, there must be a strong bullish candlestick breaking through $93,500, which would signal hope for the bulls. Until then, every rebound should be treated as a potential trap for the bulls.
On the Bollinger Bands, the price has been rubbing between the middle and lower bands, indicating overall weakness and insufficient bullish strength. The narrowing of the Bollinger Bands also suggests that a significant volatility is brewing ahead.
Currently, although the MACD has shown a golden cross, it remains below the zero line, and the MACD green histogram is shortening but with limited strength. This is akin to the bulls trying to gain momentum but not having enough energy yet, which can only be considered a weak rebound, not a strong reversal.
The KDJ indicator has turned upwards in the oversold zone, forming a golden cross, but has not broken through the midline of 50. This means there may be a short-term rebound, but the space is limited and could be pushed back by the bears at any time.
In summary, we are currently in a weak rebound pattern under the pressure of the downward trend line. The key moving forward is whether it can effectively break through the upper resistance. The first resistance above is $93,500; only after breaking through can we look towards $96,560 and $99,600. If it cannot break through, the market may continue to test lower levels. The important support below is the previous low of $89,250; if it breaks, the next target may be around $86,000 to $84,000.
Based on the above, here are a few suggestions for reference:
Conservative investors can wait for the price to stabilize above $93,500 before considering entry. Aggressive investors can consider light buying near $90,500-$91,000, and reduce positions around $93,000-$93,500 during a rebound. For short positions, one can observe whether there is resistance near $93,500, with a stop-loss set above $94,300.
In conclusion, BTC is currently fluctuating at a low level, with weak bullish strength and the bearish trend not yet over. It is advisable to watch more and act less, waiting for a true breakout signal before taking action.
Instead of giving you a 100% accurate suggestion, it is better to provide you with the correct mindset and trend. Teaching a person to fish is better than giving them fish; learning the mindset will help you earn for a lifetime!
Written on: (2025-11-19, 19:20)

(Written by - Daxian Talks Coins) Disclaimer: Online publication has delays; the above suggestions are for reference only. Investment carries risks; proceed with caution!
免责声明:本文章仅代表作者个人观点,不代表本平台的立场和观点。本文章仅供信息分享,不构成对任何人的任何投资建议。用户与作者之间的任何争议,与本平台无关。如网页中刊载的文章或图片涉及侵权,请提供相关的权利证明和身份证明发送邮件到support@aicoin.com,本平台相关工作人员将会进行核查。