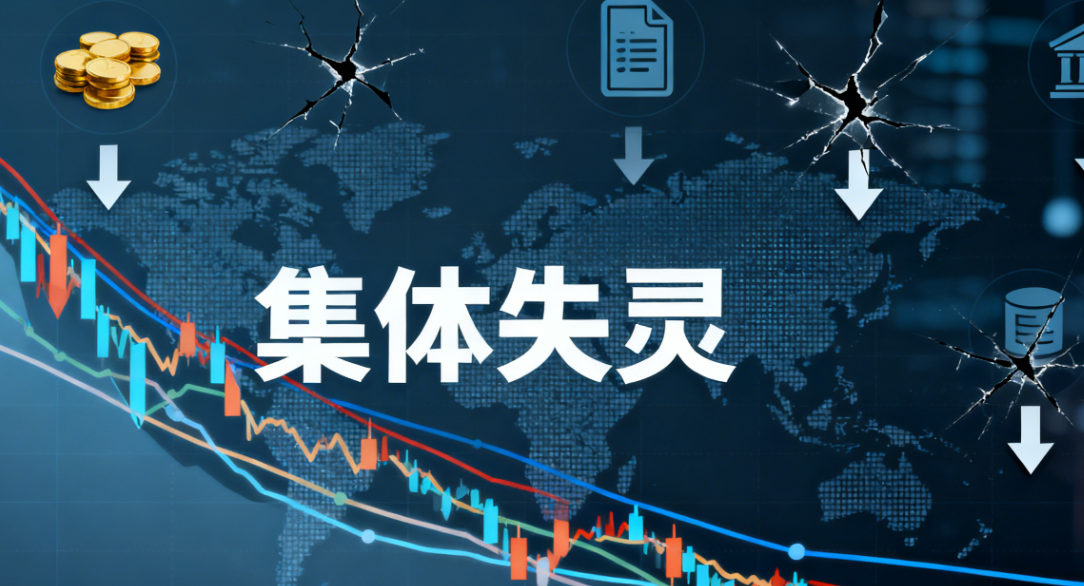
In the past two weeks, Bitcoin has once again experienced a rapid pullback, with market sentiment shifting almost overnight from overheating to freezing point. Meanwhile, three key indicators—the Fear and Greed Index (FGI), the Long/Short ratio, and the Holding Index—have all moved into extreme ranges, making "Is Bitcoin approaching a new bottom?" the most concerning topic in the market.
To answer this question, we need to explore three dimensions: what these indicators represent, why they are effective, and whether the current market is replaying the "panic tail" of historical cycles.

1. The market enters extreme ranges of sentiment and behavior
In this round of decline, sentiment and behavioral indicators have shown a rare consistency, which is precisely the typical market characteristic as the cycle approaches its end.
- First, the Fear and Greed Index has rapidly fallen into the extreme fear zone. Historical data from AiCoin shows that between 2021 and 2025, there were 6 instances where the FGI fell below 15, and in 5 of those cases, a significant stabilization or rebound occurred shortly thereafter. This is not a coincidence.
- The FGI is essentially an emotion compressor; when the index drops to extreme fear, it means that panic selling is nearing its end, with significantly fewer people willing to sell, while those willing to buy begin to wait for the right entry point.

The second indicator—the Long/Short ratio—has given a stronger signal this time. In the past, whenever the L/S ratio exceeded 3, Bitcoin has always seen a stop in decline or a rebound.
The reason is simple: this indicator reflects "number of people" rather than the amount of capital. When retail sentiment is pushed to extremes and bullish sentiment sharply concentrates, it often indicates that the decline is in its later stages, and the market is approaching a peak in sentiment. In other words, when retail sentiment is highly consistent, it usually means that a reversal is not far off.

- The third Holding Index reflects the attitude of medium to long-term holders. It recently fell within the range of 0.45–1.2, which historically corresponds to a wide price fluctuation zone, without a significant loosening of long-term holdings.
- This means that despite the price decline, medium to long-term investors remain stable, and the underlying structure of the market has not deteriorated significantly.

The Coinbase premium index reflects the strength of the US market versus the Asian market; when it is greater than 0, the US market is strong; when less than 0, the Asian market is strong. When it reaches the threshold of -0.02, BTC begins to stop falling.

The four indicators come from sentiment, retail behavior, and long-term holding structure, and their simultaneous reach into extreme ranges is itself a rare signal resonance.
2. Why are these indicators effective?
If we were to judge whether the market is nearing its end solely based on "historical statistics," it would certainly be insufficient. However, these four indicators frequently prove effective at bottoms because they reflect the most fundamental forces in the market. Market bottoms often do not occur due to positive news but because "those willing to sell have already sold out."
- When sentiment is in extreme fear, marginal selling pressure is nearing exhaustion, and the need for new selling to push prices further down decreases, making stabilization more likely. The structure of the crypto market dictates that this pattern will repeatedly occur.
- The effectiveness of the Long/Short ratio also has deeper reasons. Retail investors are numerous but have light capital, making their sentiment easily swayed by continuous fluctuations.
When retail investors are continuously shaken out of their positions during a decline but are still forced to concentrate on buying long, it often represents the market entering an "emotional critical point," rather than the beginning of a trend. From statistical results, the success rate of this indicator in a contrarian sense is very high, which is not a coincidence but a typical manifestation of behavioral finance in the crypto market.
- As for the Holding Index, it leans more towards "fundamentals" than sentiment and retail indicators. As long as long-term holdings remain stable, a decline is unlikely to evolve into a trend collapse. The current Holding Index is still in a stable range, indicating that the price adjustment is more driven by leverage, sentiment, and short-term capital rather than panic selling by long-term funds. Therefore, the market has the conditions to move out of a wide fluctuation and gradually stabilize.
3. How similar is this decline to past downturns?
Comparing the current market with historical cycles reveals a surprising structural similarity.
- Whether it was the mining disaster pullback in 2021, the chain liquidation following the Luna incident in 2022, the chaotic consolidation after the FTX collapse in 2023, or the severe fluctuations during the ETF issuance period in 2024, the common characteristics before and after the bottom are almost identical: continuous pullbacks, emotional collapse, long liquidation, high leverage washout, and retail sentiment pushed to extremes.
This round of movement just happens to replicate the core characteristics of these stages.
- Trading volume has significantly shrunk after the decline, indicating that selling pressure is beginning to wane;
- On-chain activity has dropped to bottom regions, which is a typical manifestation of "active selling ending, passive holding increasing" in history;
- OTC trading volume has quietly increased, which is a common action for large funds to position during panic;
- The stablecoin market cap has stabilized, indicating that off-exchange funds have not significantly flowed out. All these signs are highly consistent with historical bottoming areas.
In other words, the current market is very close to the past few rounds of BTC bottoms in terms of structure, indicator combinations, and emotional patterns.
4. Are we really entering a "countdown to stop falling"?
From the signals of the four indicators, Bitcoin is indeed approaching a relatively clear bottoming area. However, "approaching a bottom" does not equate to "immediate reversal," nor does it mean that there won't be a small downward probe.
- A more accurate expression is: the marginal space for decline has rapidly narrowed, and the probability of the market being in a "tail-end structure" is significantly higher than that of "a new round of accelerated downward trend."
- Sentiment indicators tell us that emotional selling is nearing its limit;
- The Long/Short ratio shows that retail sentiment has been pushed to its extreme; the Holding Index ensures that the medium to long-term holding structure has not been damaged.
- Additionally, the technical aspect has also shown typical "bottom-building characteristics": low volatility sideways movement, long lower shadows, continuously shrinking volume, and active buying support at deep drop positions.
These factors combined make the current market state closer to the "chaotic stage before stabilization," rather than the "beginning of a trend decline."
5. The three signals to watch next
To determine when this round of decline truly ends, three signals are most decisive.
- First, whether the Fear and Greed Index can maintain extreme levels for several days. Historically, true bottoms are often not marked by "one day of fear," but by emotions cooling at freezing points.
- Second, whether the Long/Short ratio begins to retreat from extreme values, which often indicates that extreme retail sentiment is being released, and contrarian forces are beginning to accumulate.
- Third, whether the Holding Index starts to rise. Once this indicator turns to "clear accumulation," it usually means that long-term funds are officially taking over, and the conditions for starting a new trend are in place.
If these three conditions overlap, it means that the market has truly completed bottom confirmation.

6. The trend remains unchanged, but the cycle approaches its end
Considering the current three major indicators, market structure, and historical patterns, we can provide a relatively robust judgment:
Bitcoin is very likely in the final stage of this round of decline. The extremity of sentiment, the tilt of retail behavior, and the stability of the holding structure provide the market with conditions for gradual stabilization; the space for decline is narrowing, while the conditions for a rebound are accumulating.
This does not sound the horn for a reversal but means that the market is transitioning from "sharp decline" to "digestion and repair" phase. When extreme sentiment meets stable holdings, and retail extremes meet large fund accumulation, the market is often not far from stopping its decline.
Join our community to discuss and grow stronger together!
Official Telegram community: https://t.me/aicoincn
AiCoin Chinese Twitter: https://x.com/AiCoinzh
OKX benefits group: https://aicoin.com/link/chat?cid=l61eM4owQ
Binance benefits group: https://aicoin.com/link/chat?cid=ynr7d1P6Z
免责声明:本文章仅代表作者个人观点,不代表本平台的立场和观点。本文章仅供信息分享,不构成对任何人的任何投资建议。用户与作者之间的任何争议,与本平台无关。如网页中刊载的文章或图片涉及侵权,请提供相关的权利证明和身份证明发送邮件到support@aicoin.com,本平台相关工作人员将会进行核查。