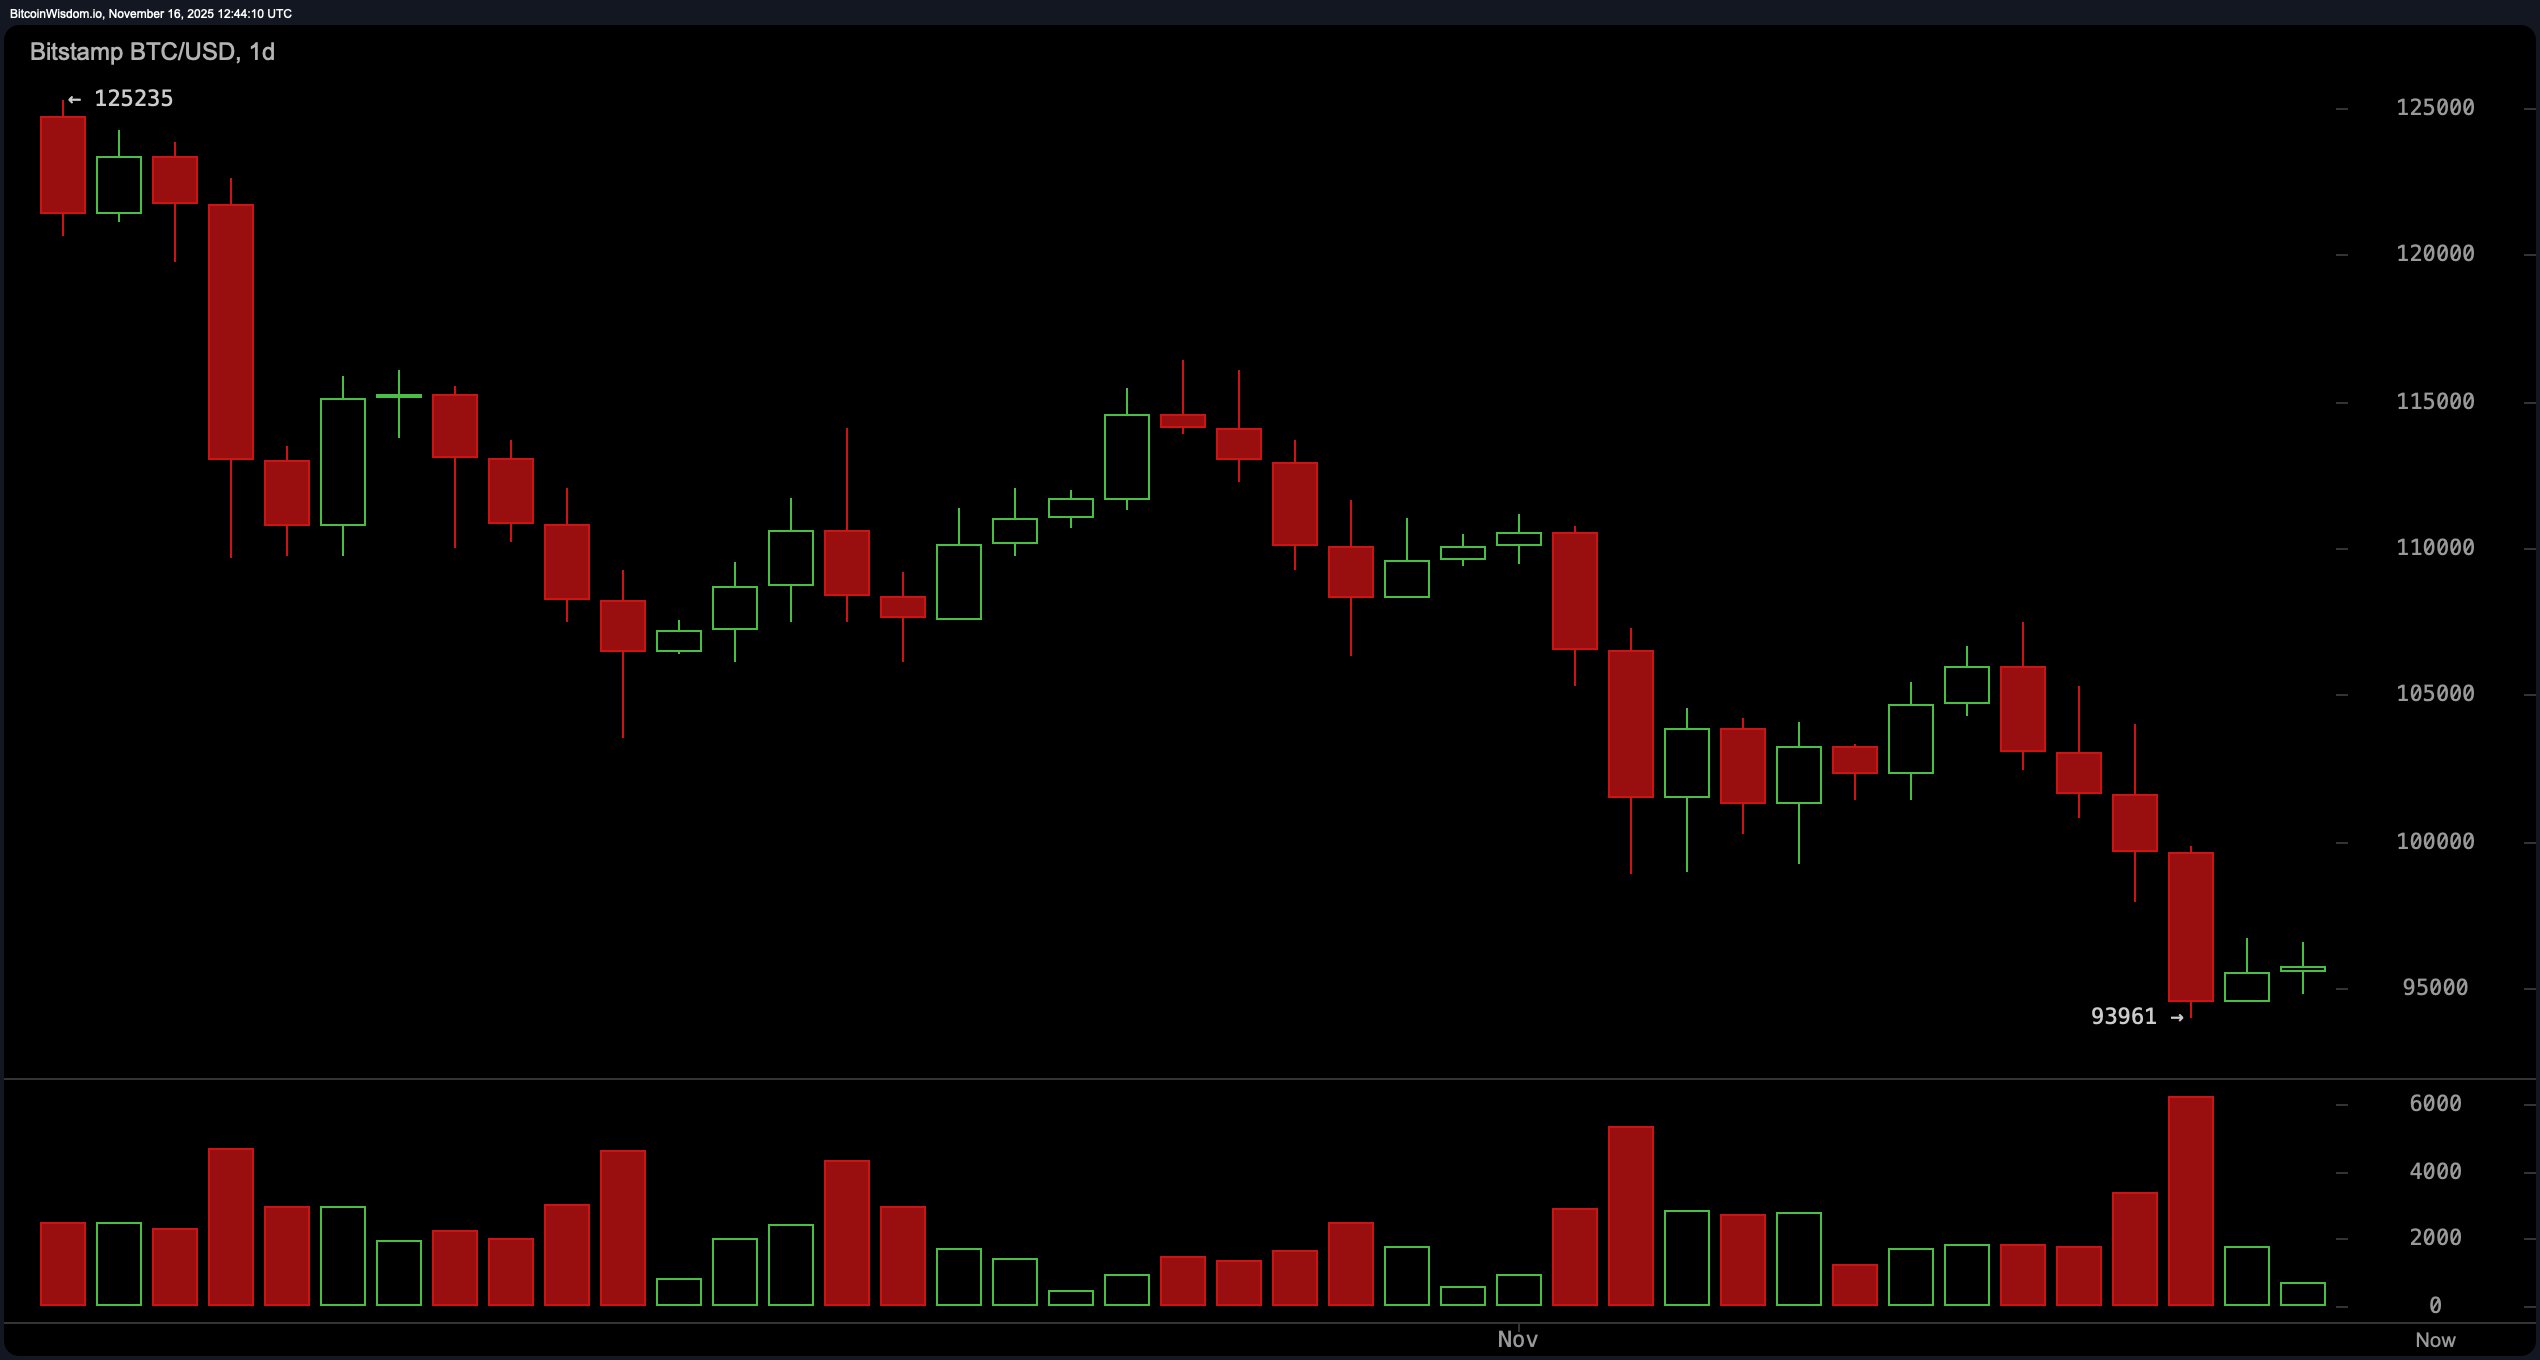
The daily chart spelled out the broader market narrative: a steady descent marked by lower highs from $125,000 to $103,000, culminating in a flush down to $93,961. That candle wasn’t just red; it practically screamed capitulation.
While bulls managed to salvage a bounce at $94,000, the recovery’s limp posture and frail volume suggest they left their firepower at home. Resistance looms menacingly between $100,000 and $102,000, and unless bitcoin can reclaim this zone, the macro trend remains a downhill jog in mud.

BTC/USD 1-day chart via Bitstamp on Nov. 16, 2025.
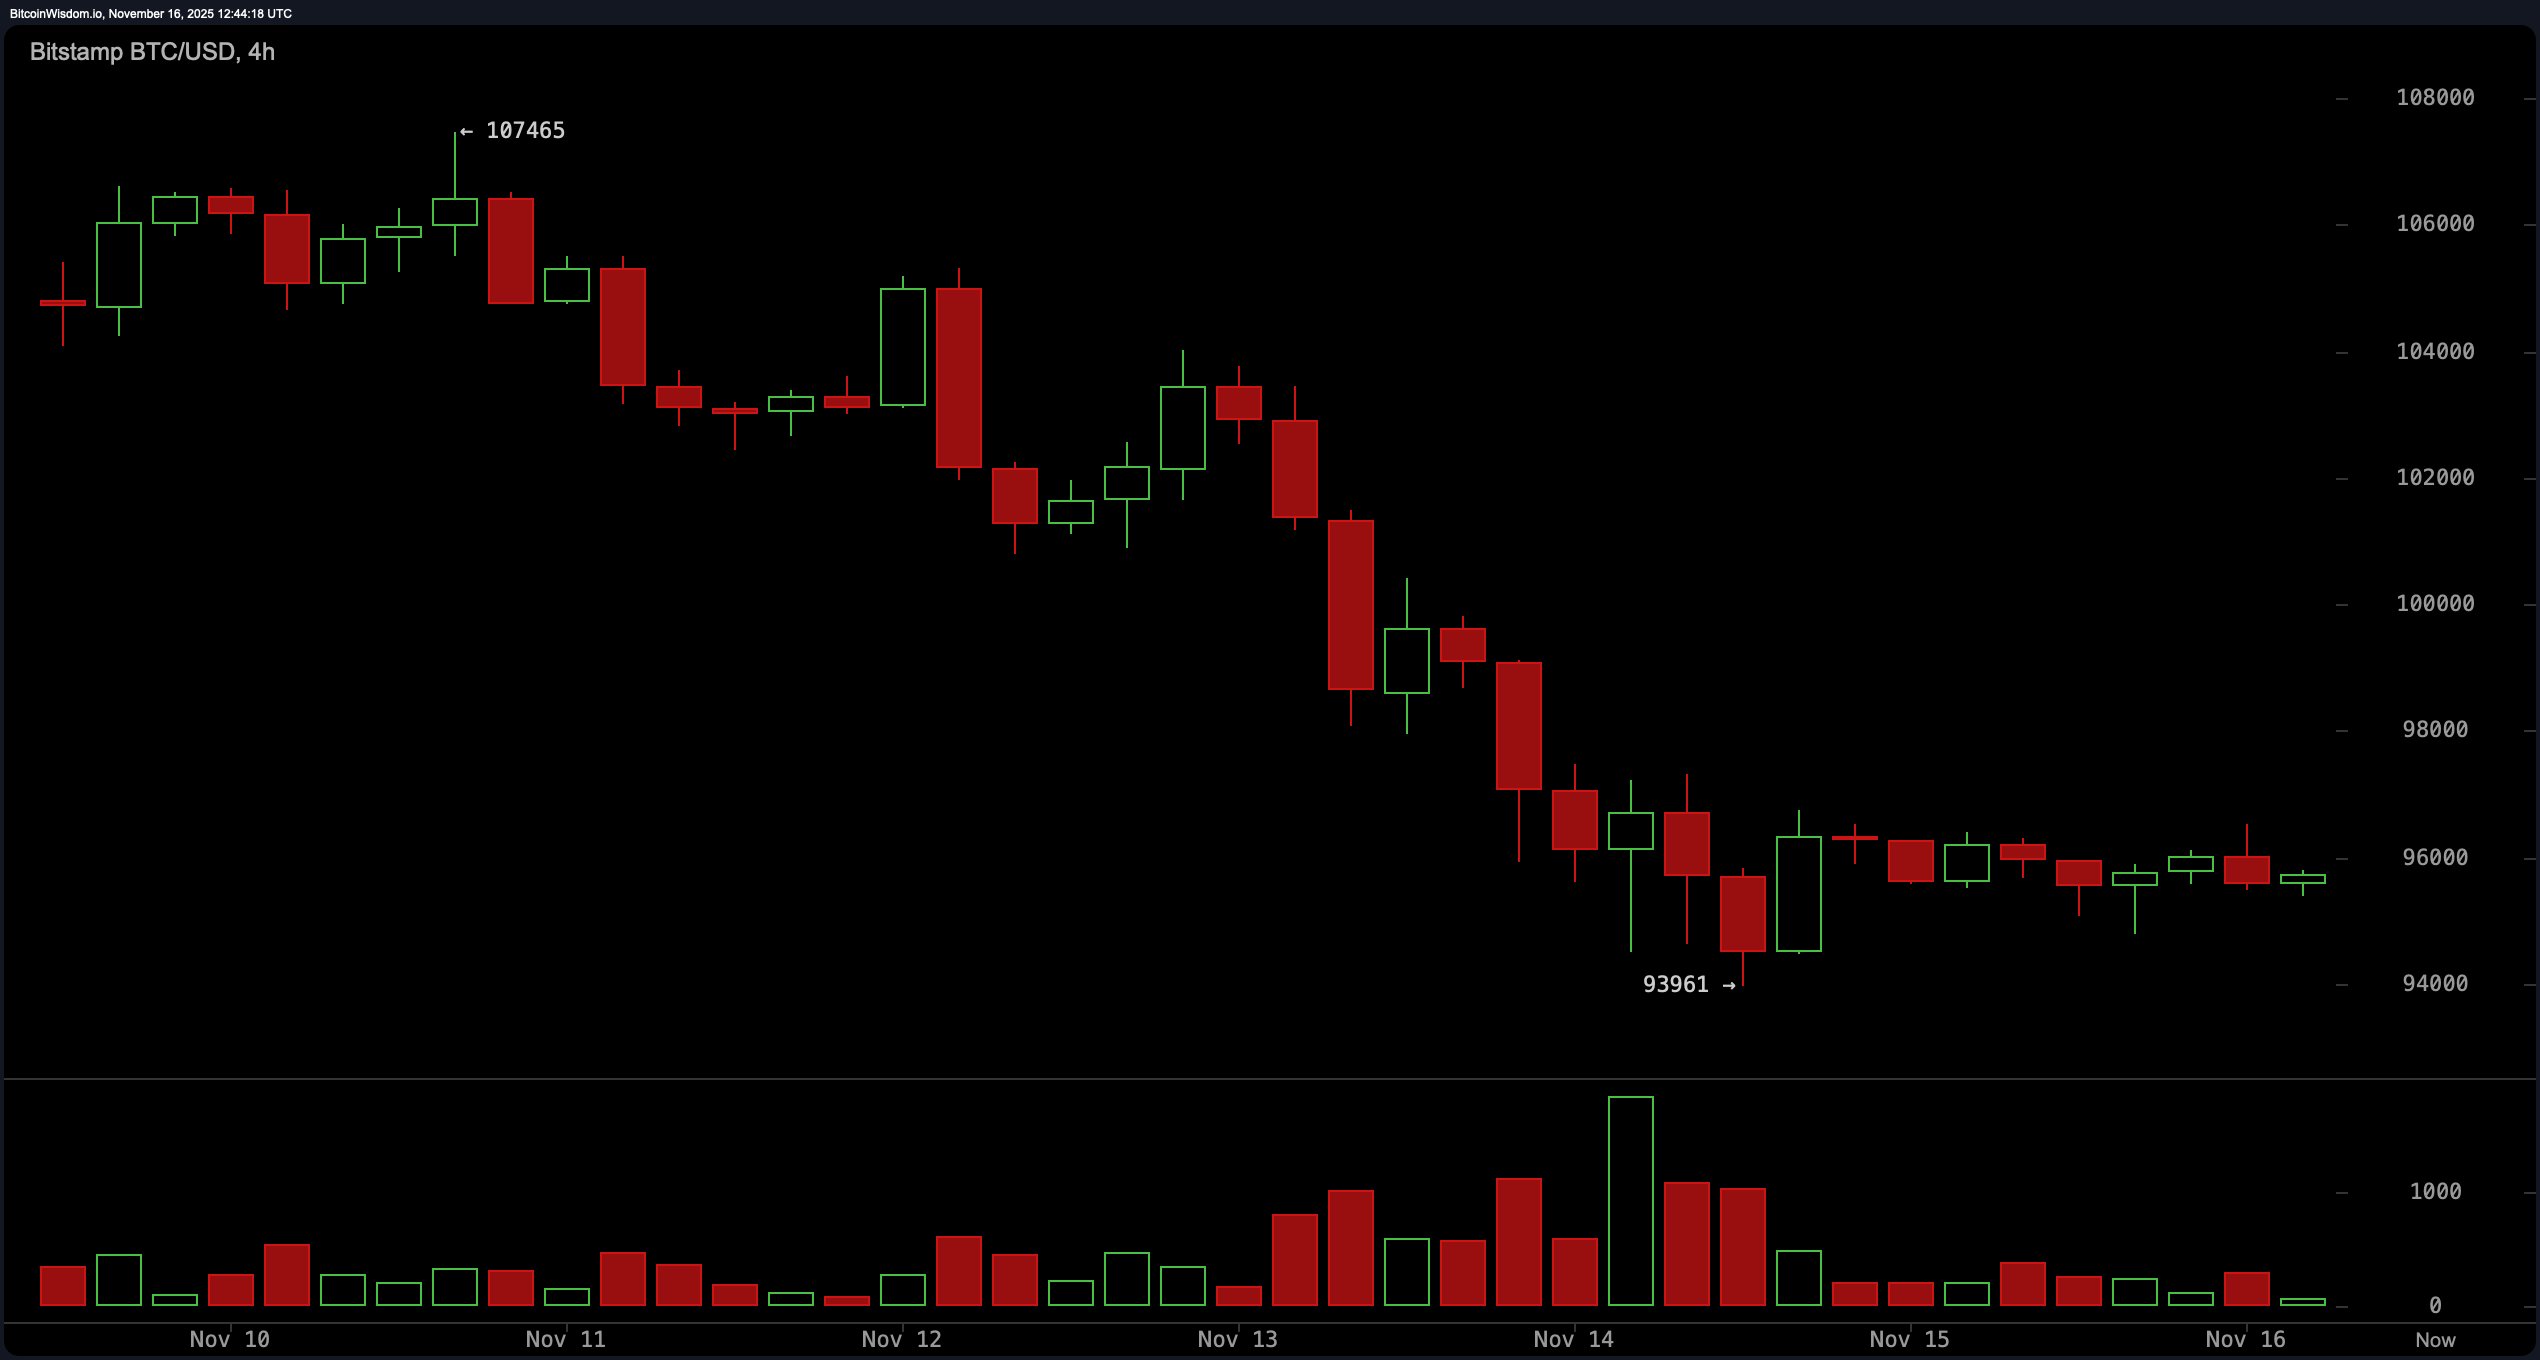
The 4-hour chart wasn’t much kinder. After tumbling from $107,465 to $93,961, bitcoin has been hovering in the $94,000 to $96,000 range like a confused tourist with no itinerary. The volume profile underscores the imbalance—sellers came in loud, buyers barely whispered. With no decisive momentum, this is either a consolidation before another leg down or the basement phase of an eventual bounce. But until a 4-hour close above $97,500 materializes, don’t expect the lights to come on.

BTC/USD 4-hour chart via Bitstamp on Nov. 16, 2025.
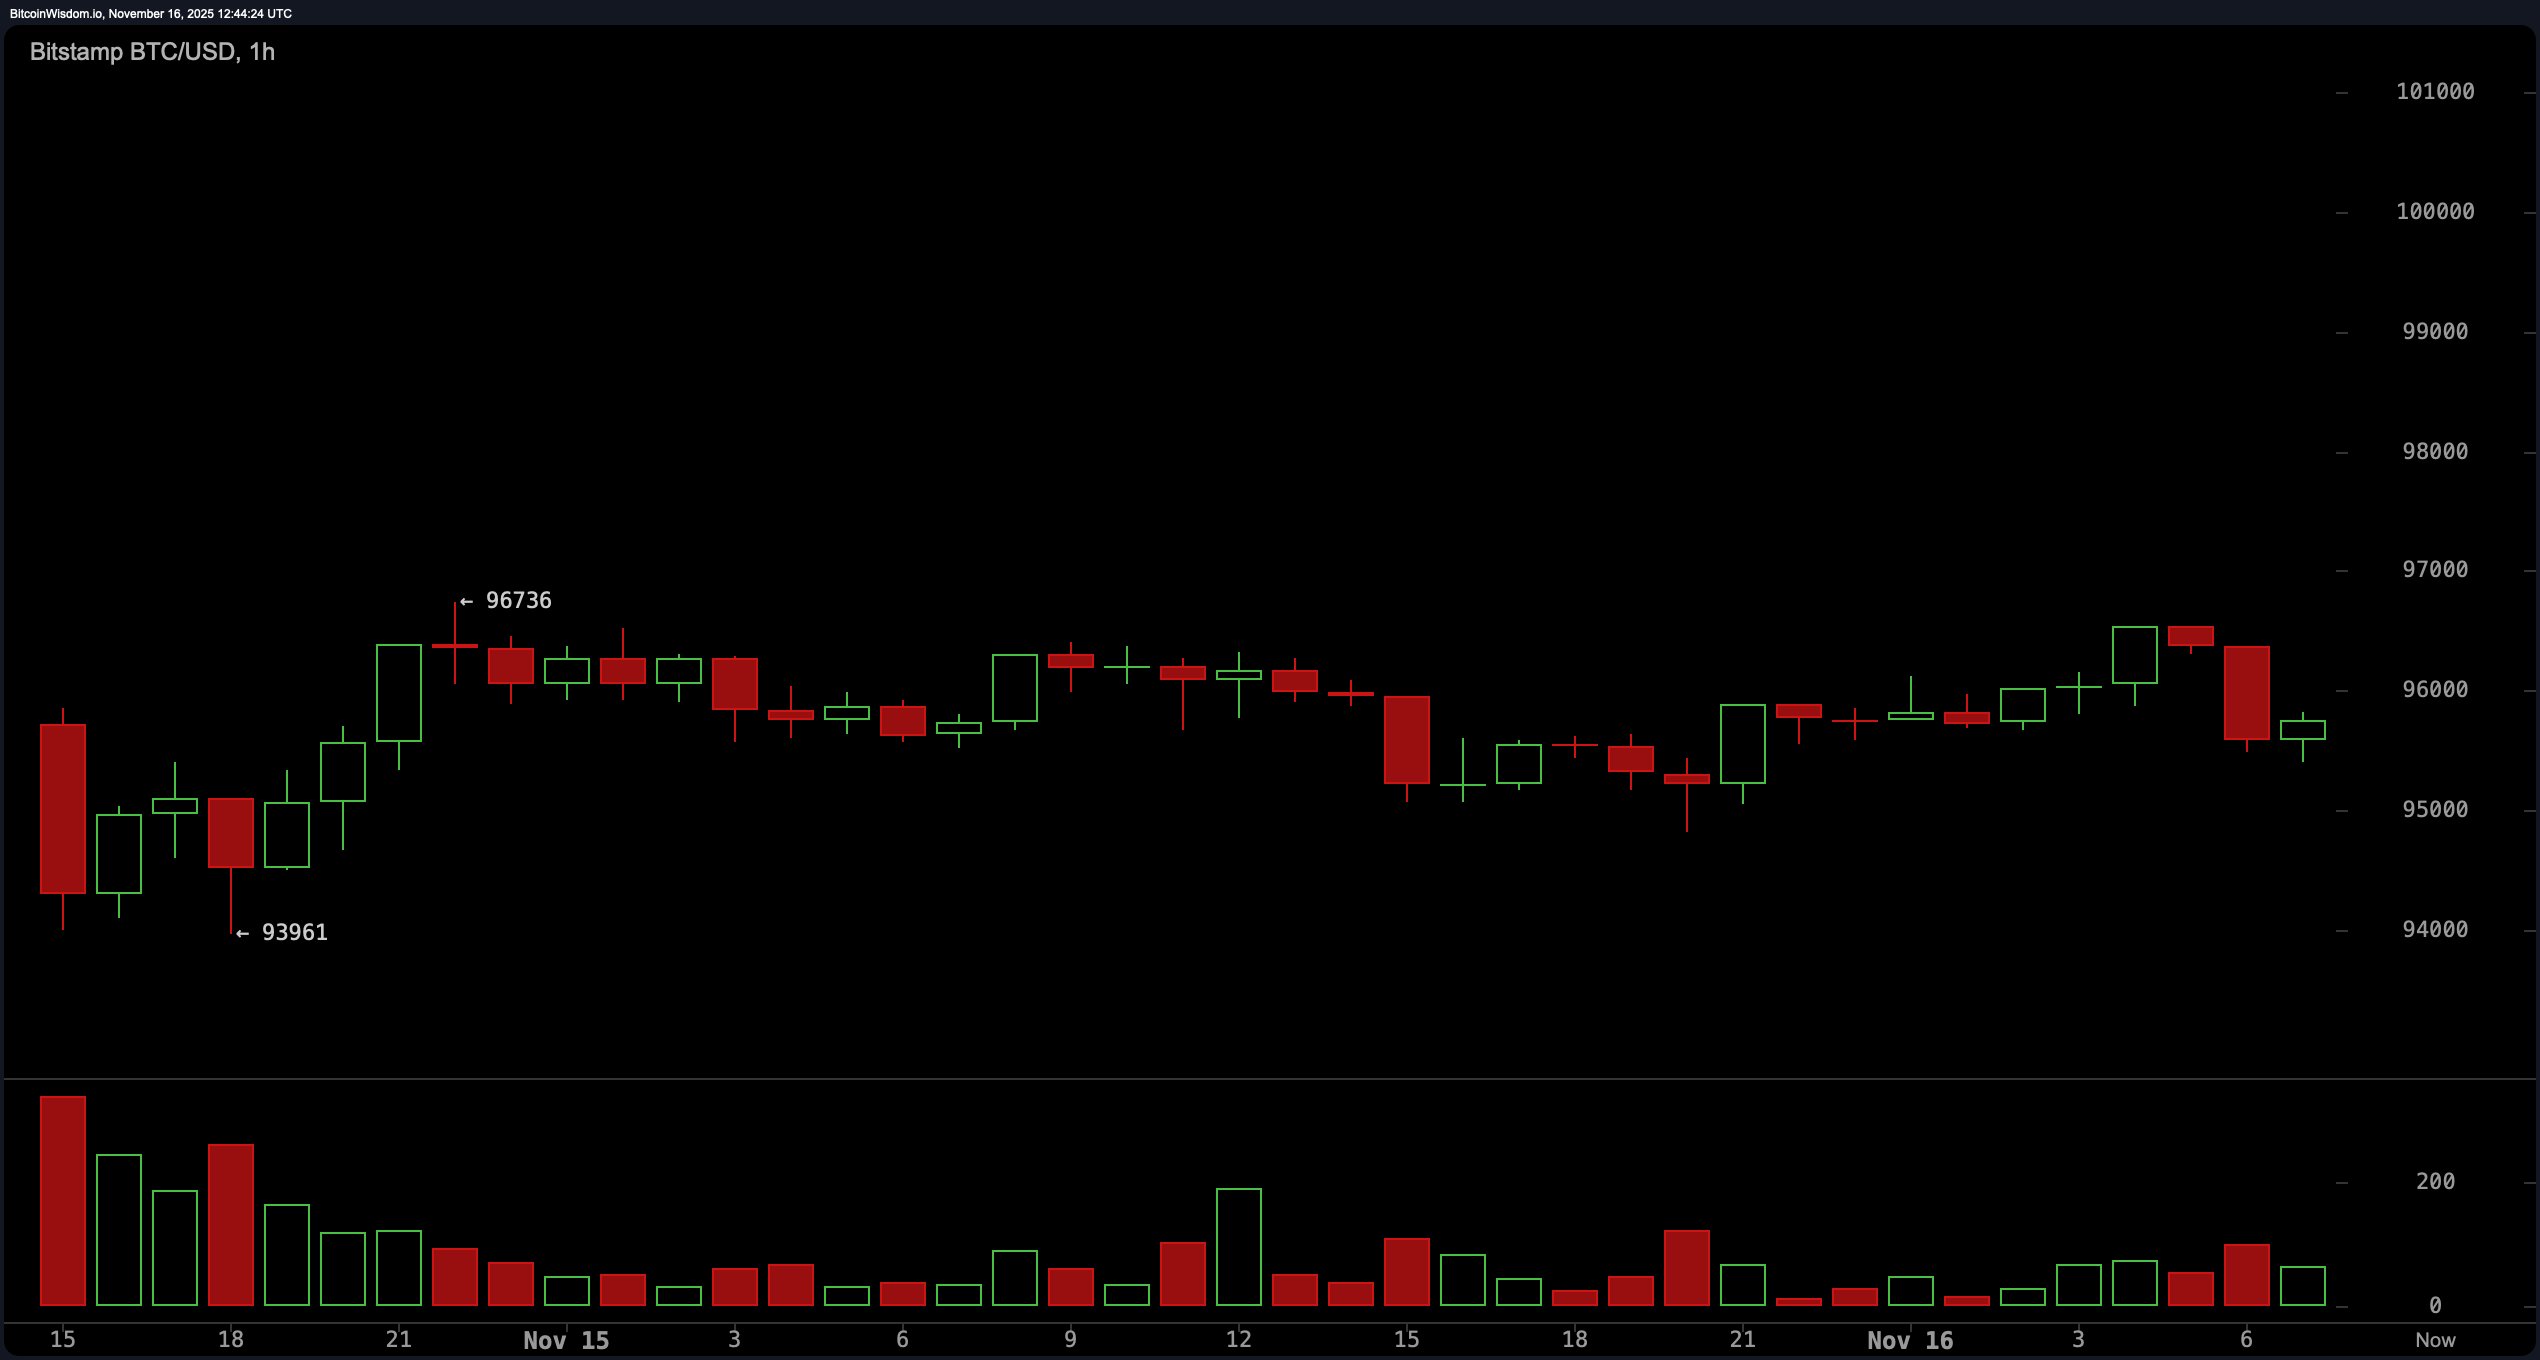
Zooming in on the 1-hour chart, the local momentum tells a story of indecision draped in weakness. Price movements between $95,000 and $97,000 have been shallow and short-lived. Every lift attempt is swiftly countered by resistance, and without any bullish divergence or volume uptick, the moves resemble liquidity hunts more than genuine demand. Failure to break above $96,736 continues to embolden short-term skeptics.

BTC/USD 1-hour chart via Bitstamp on Nov. 16, 2025.
Oscillators across the board paint a cautionary tale. The relative strength index (RSI) stands at 33, indicating waning bullish strength but not quite oversold. The stochastic indicator is a dismal 7, also neutral, while the commodity channel index (CCI) at −138 and momentum at −5,688 offer rare glimmers of positivity. However, the moving average convergence divergence (MACD) at −3,809 aligns with the bears. Notably, all key moving averages—from the 10-period exponential moving average (EMA) at 99,737 to the 200-period simple moving average (SMA) at 110,482—suggest downward pressure is still firmly in place.
In sum, bitcoin’s current stance is one of uneasy balance. With bulls defending $94,000 like it’s sacred ground and bears waiting to pounce near $97,000, the next significant move hinges on who blinks first. Until then, expect chop, hesitancy, and perhaps a few traders nervously eyeing their stop-losses with more than a little side-eye.
Bull Verdict:
If bitcoin can reclaim $97,500 on a decisive 4-hour close, bulls may finally get the footing they need to claw back toward the $100,000–$102,000 resistance zone. With the commodity channel index (CCI) and momentum oscillator blinking early optimism, there’s a narrow but plausible path to a recovery rally—so long as $94,000 continues to hold as a launchpad.
Bear Verdict:
Momentum and moving averages aren’t just leaning bearish—they’re practically hosting a downtrend parade. Unless bitcoin can muster a strong reversal above $97,500, the weight of macro resistance and fading volume favors a breakdown. A clean loss of $94,000 opens the trapdoor to $90,000, with an ominous extension target near $84,000 if daily support gives way.
- Where is bitcoin trading now?
Bitcoin is currently priced at $95,455, holding just above key support near $94,000. - What is the major resistance zone?
The critical resistance lies between $100,000 and $102,000 on the daily chart. - Is momentum favoring upside or downside?
Momentum remains tilted to the downside with weak volume and bearish indicators. - What price levels are traders watching?
Traders are eyeing $94,000 as support and $97,500 as the breakout trigger.
免责声明:本文章仅代表作者个人观点,不代表本平台的立场和观点。本文章仅供信息分享,不构成对任何人的任何投资建议。用户与作者之间的任何争议,与本平台无关。如网页中刊载的文章或图片涉及侵权,请提供相关的权利证明和身份证明发送邮件到support@aicoin.com,本平台相关工作人员将会进行核查。


