Good evening everyone, I am Jiang Xin. Today the market has been quite volatile, with back-and-forth movements causing opponents to lose their composure. Below are my thoughts on the night market and the early morning volatility layout and verification:
Let's briefly review the movement of Ethereum.
Looking at the fifteen-minute chart of Ethereum, after breaking through 3580 on November 10, it consolidated above that level. At ten o'clock in the evening, it fell back without rebounding, instead facing a surge in selling pressure, dropping back to 3500, which is a key support point for bulls. During the night session on November 10, the market was in a tug-of-war, and only when it reached the divergence point at 3580 in the morning did buying pressure increase. However, it failed to break the previous high and was hit by short sellers, falling back by a hundred points within an hour. Here, bulls attempted to counterattack, testing the resistance again. Unsurprisingly, it faced another round of selling pressure, leading to a series of bearish candles that swallowed the gains and the confidence of bulls. This back-and-forth movement has left the market in a state of confusion, but we have benefited from it. In the afternoon, the market operated with reduced volume, and both confidence and prices continued to decline.
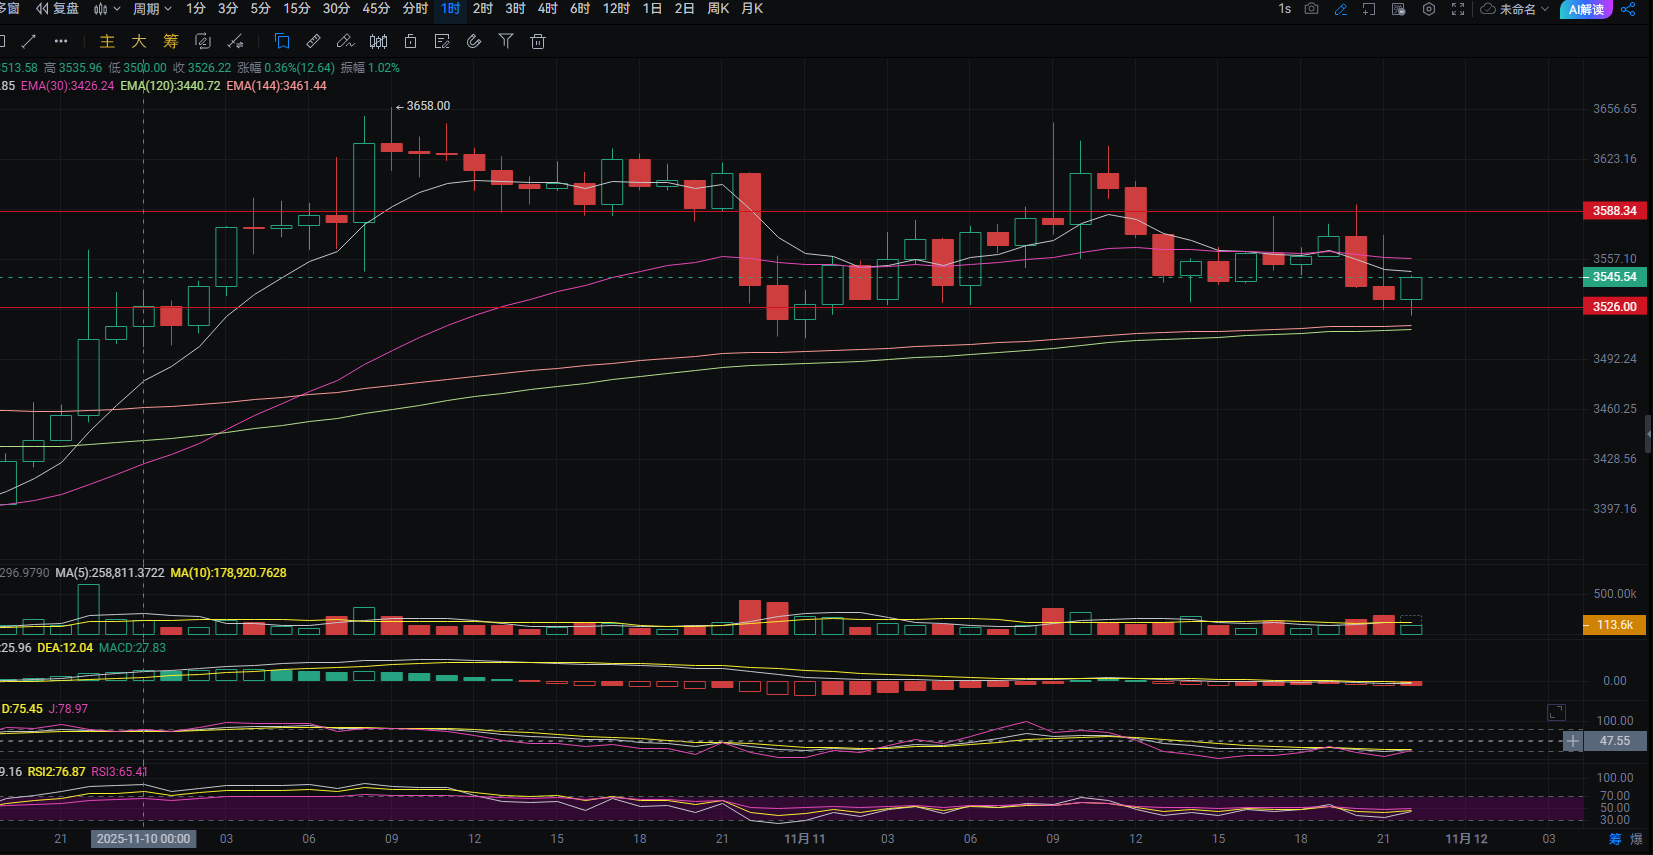
Currently, the one-hour pattern of Ethereum is quite clear, temporarily dominated by bears. Ethereum shows signs of resistance at the lower Bollinger Band on the one-hour chart, with support potentially forming around 3510, where the one-hour EMA120 and EMA144, as well as the four-hour EMA30, are located. The one-hour MA200 and MA140 are around 3450. Therefore, there is still space and potential below. The fifteen-minute level MA and EMA120, 144, and 200 are densely packed around 3560-3580, which may form resistance.

Thus, in the future market, we should focus on the key divergence points around 3510 and 3580, and extend our reference to the important levels around 3480 and 3650 within the next two days. Based on the mentioned levels, we can navigate the market's volatility according to market sentiment, allowing for back-and-forth movements. The focus remains on short positions.
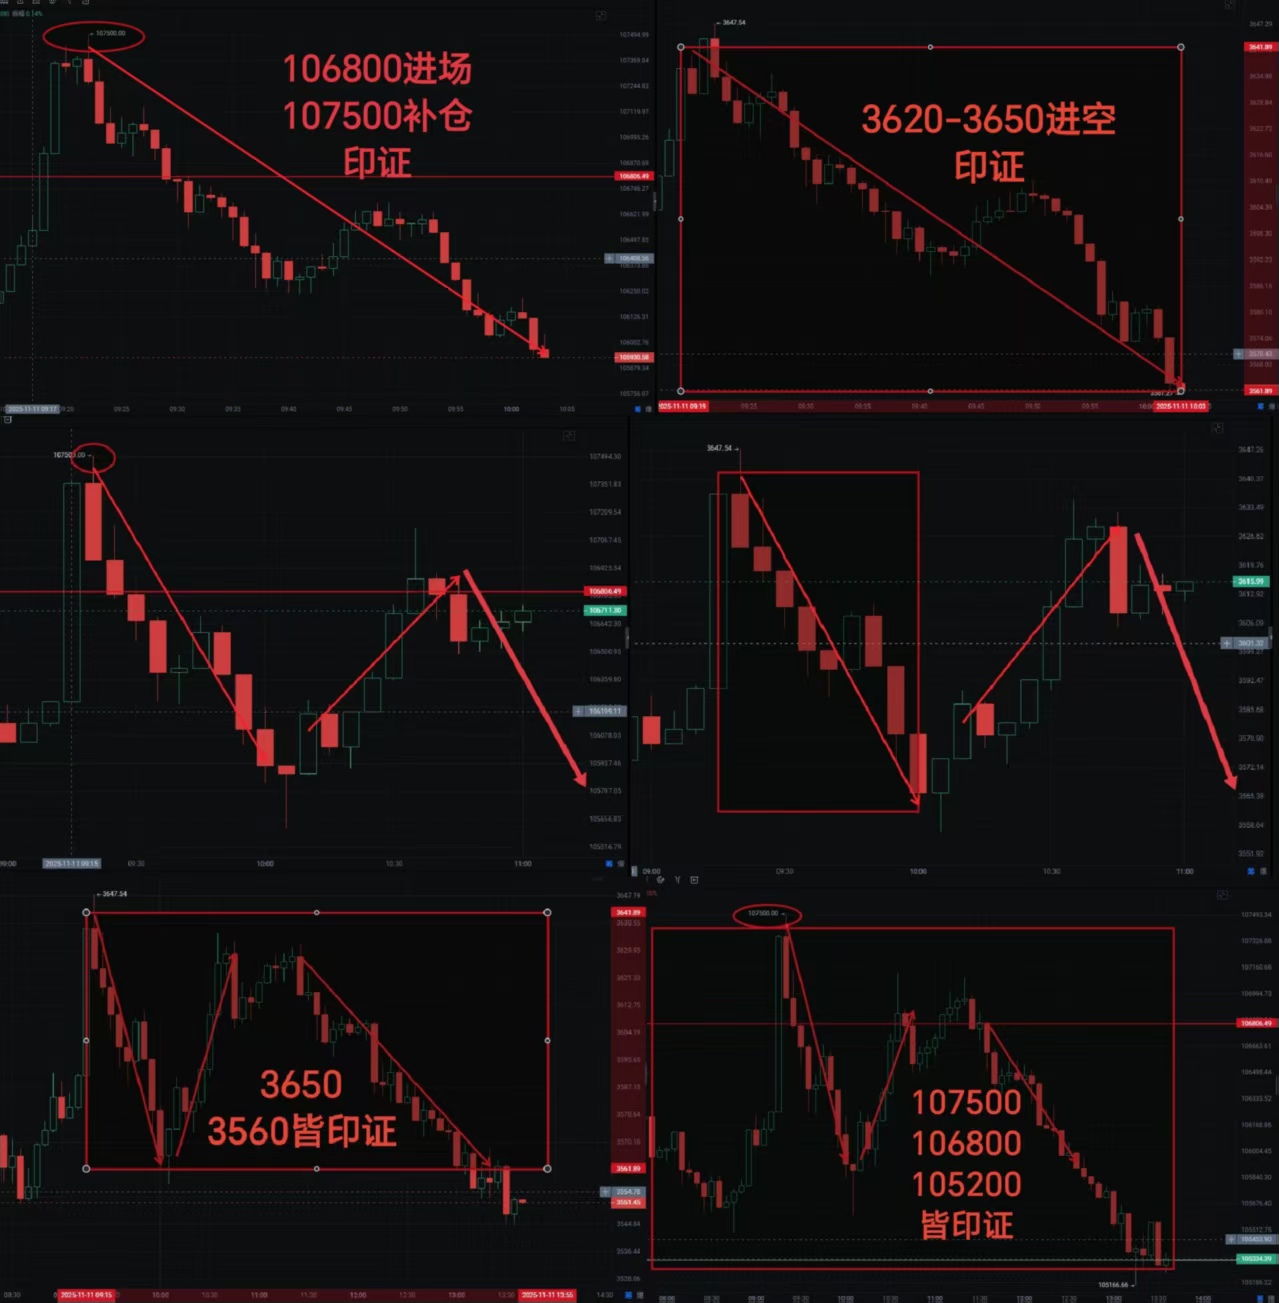
I suggest shorting at 3580, adding to the position at 3620, with a stop loss at 3560. Alternatively, you can go long at 3450, add at 3410, and set a stop loss at 3382. Move within the range, leaving room for adding to positions, so that no matter how the market moves, you can easily manage your positions.
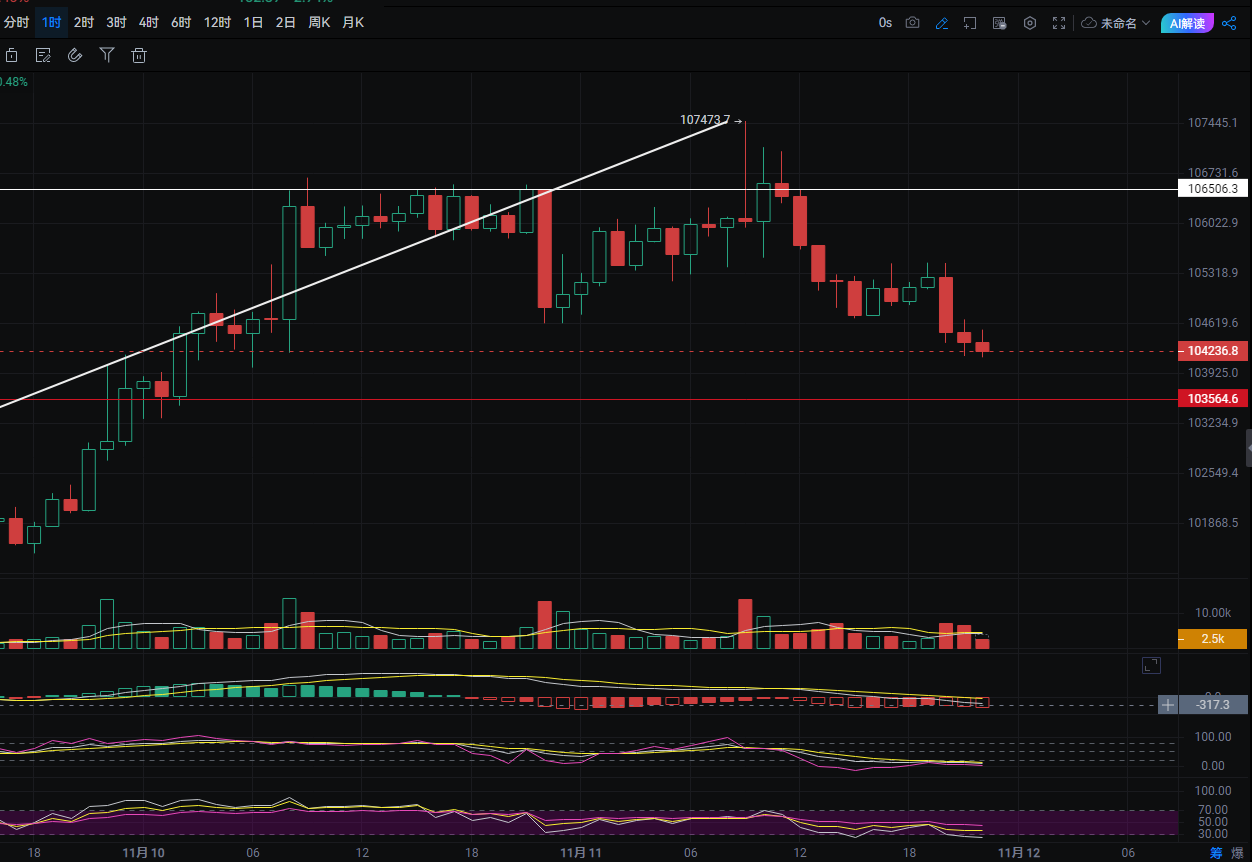
Next, let's look at the one-hour K-line of Bitcoin. The confrontation and pressure during the process are very evident. On November 10, it faced continuous pressure around 106500. The sell-off at ten o'clock last night and nine o'clock this morning was significant, but one point to note is that Bitcoin broke through the high. The sell-off in the morning was initially met with resistance, followed by buying pressure in the next one-hour candle. The five consecutive bearish candles in the afternoon and the three consecutive bearish candles in the evening indicate that bears are in control. This confrontation will lead to the liquidation of high leverage around 106500-106800, so the market is likely to turn down, which supports our focus on short positions.
Currently, the one-hour EMA120 and EMA144 have already broken down. I suggest shorting at 105200, adding at 106500, with a stop loss at 107200. Consider going long at 102800, or conservatively at around 101800, with a stop loss at around 101200.
Below is the first segment of today's daytime market with three consecutive losses, but we experienced five consecutive losses.
Join me, Jiang Xin, and walk with giants to harvest the market together. Follow the public account: Jiang Xin on Trading.

免责声明:本文章仅代表作者个人观点,不代表本平台的立场和观点。本文章仅供信息分享,不构成对任何人的任何投资建议。用户与作者之间的任何争议,与本平台无关。如网页中刊载的文章或图片涉及侵权,请提供相关的权利证明和身份证明发送邮件到support@aicoin.com,本平台相关工作人员将会进行核查。