Bitcoin Trend Analysis
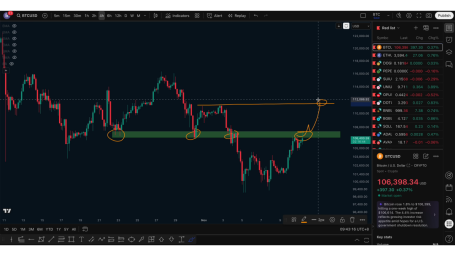
Yesterday, I emphasized a point: it is not recommended to chase high long positions at the current location.
This is because the market has formed a bottom bullish structure, and the neckline has broken, requiring a technical pullback for confirmation.
In other words, if you want to participate in long positions, you should wait for the price to pull back to support before considering entry.
Yesterday's decline was precisely this "pullback after the neckline break,"
so we chose to short around 106,500,
and the logic completely aligns with the structural trend.
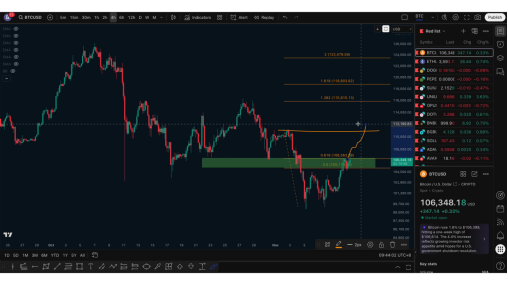
Currently, Bitcoin's key resistance range is between 106,500 and 107,500.
In the morning, the price briefly broke above 107,000 but then fell back into the range,
indicating that this area remains an effective resistance level.
There are two possible short-term trends:
- Breakthrough the resistance zone:
If the price successfully stabilizes above 107,500, it may further test around 110,000,
which is a concentrated liquidation area for shorts and may experience strong volatility.

- Rebound and then test lower points (I personally lean towards this one):
From a structural perspective, this round of rebound belongs to the technical repair in the 0.5–0.618 range after the previous decline.
If this resistance zone cannot be broken, Bitcoin remains in a healthy adjustment phase of the bearish structure.
Once the adjustment ends, a new round of decline may follow:

First target: around the previous low of 98,000
Second target: around 94,000 (corresponding to the daily level 0.618 retracement level)
It is expected that the market may move in two steps, gradually testing the support area below.
Ethereum Trend Analysis
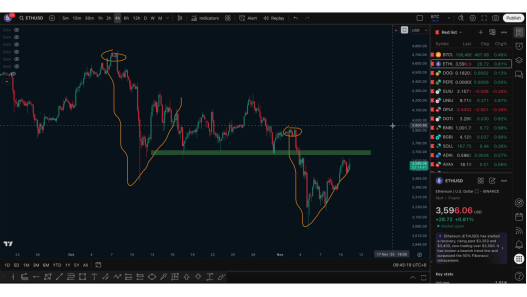
The rebound strength of Ethereum is noticeably weaker.
From a structural perspective, the rebound after the previous sharp decline resembles a "slow rise repair" and has not changed the main trend.
The current key resistance zone is in the range of 3,700–4,000:

If it breaks through 3,700, it may attempt to test 4,000–4,100;
If it fails to break through, the bearish pressure remains.
Therefore, around 4,000–4,100, one can look for short opportunities,
with the stop-loss set above 4,100.
Overall, Ethereum is still in a rebound consolidation within a downtrend at the daily level.
Although there are local bullish arrangements in the short cycle, they have not changed the main structure.
If the support below is broken again, the market may continue to decline.
Currently, the market is still in a consolidation range, with Bitcoin and Ethereum both near key resistance levels.
In terms of operations, it is recommended to maintain a short-term mindset, avoid chasing highs, and not cling to battles,
patiently waiting for the structure to clarify before participating in the trend.
Follow me for mutual progress. The article release may be delayed and is for reference only.

免责声明:本文章仅代表作者个人观点,不代表本平台的立场和观点。本文章仅供信息分享,不构成对任何人的任何投资建议。用户与作者之间的任何争议,与本平台无关。如网页中刊载的文章或图片涉及侵权,请提供相关的权利证明和身份证明发送邮件到support@aicoin.com,本平台相关工作人员将会进行核查。


