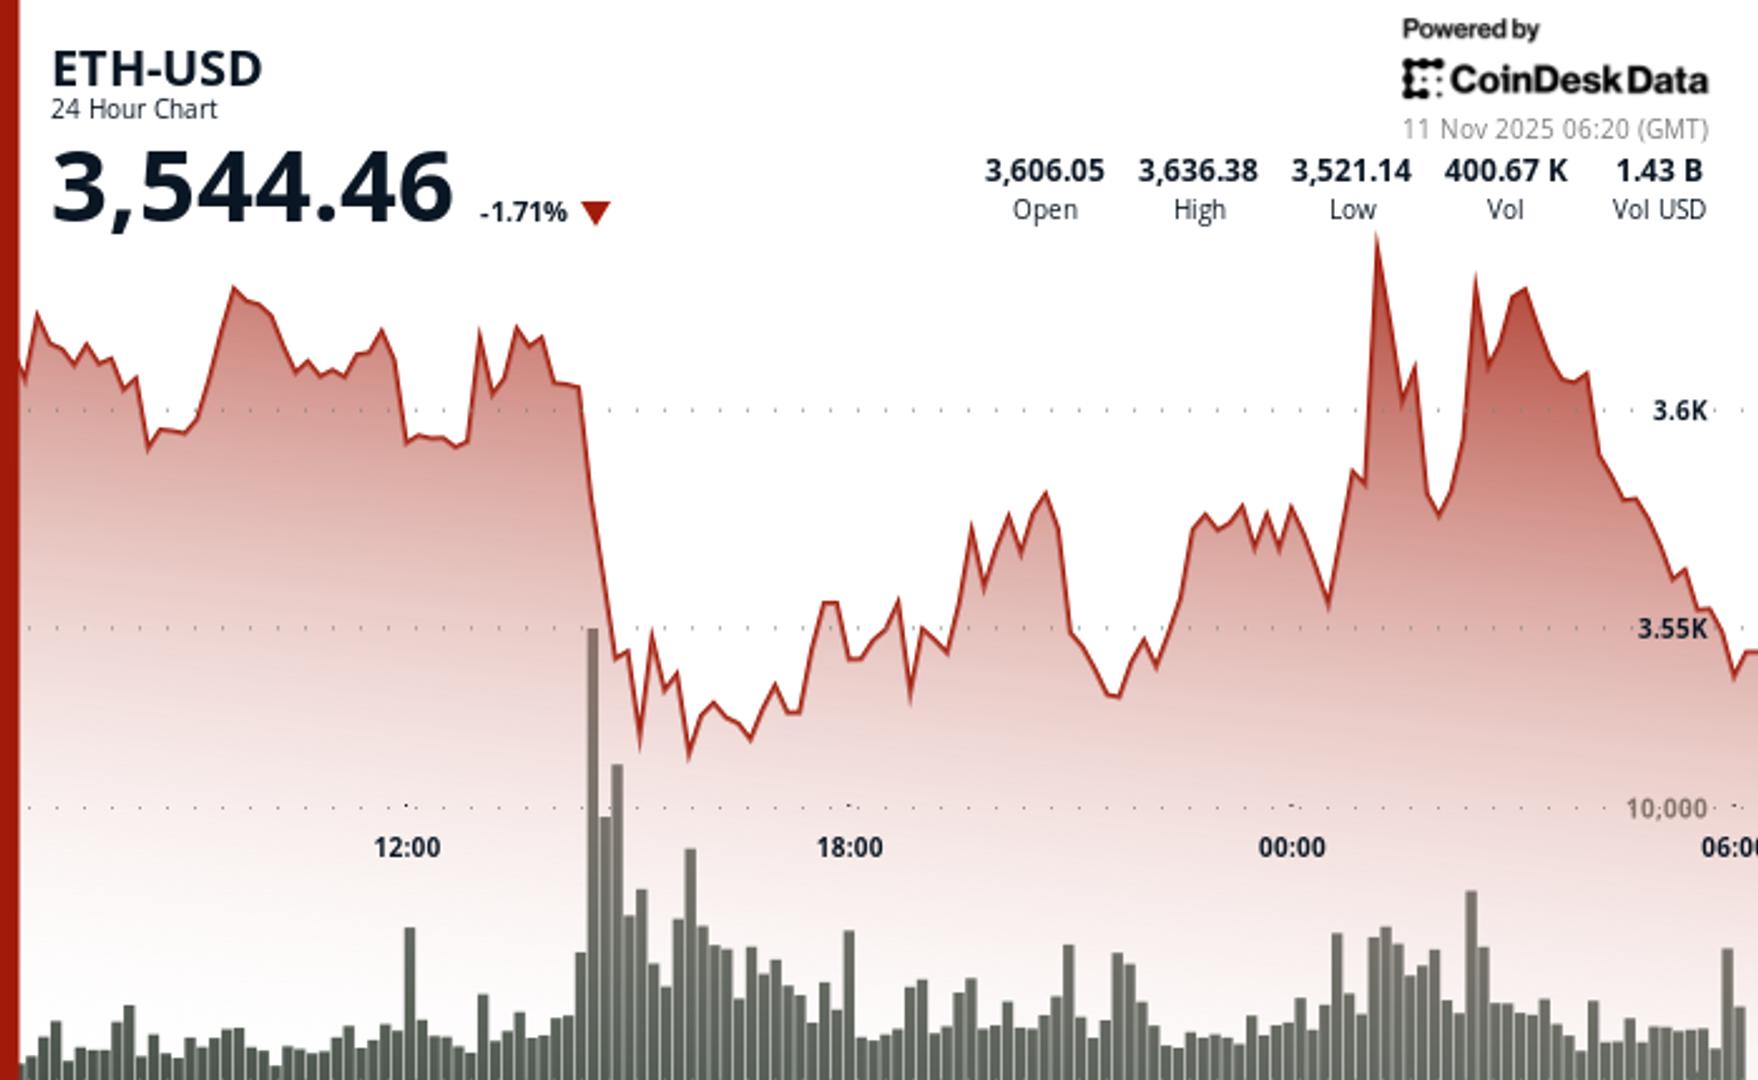
According to CoinDesk Research's technical analysis data model, Ether retreated 1.5% during Tuesday's session as bears overwhelmed early bulls near critical resistance.
ETH plunged from $3,629 to $3,576 within a $136 trading range as selling volume spiked 138% above normal levels. The breakdown confirms bears now control the near-term direction after weeks of consolidation.
The selloff accelerated after ETH rejected the $3,646 resistance level during early morning trading. Exceptional volume of 338,852 contracts drove the decisive break below $3,590 support. This key level had previously provided reliable demand during recent volatility. ETH touched an intraday low of $3,532 before stabilizing near current levels.
Price action now shows lower highs despite multiple recovery attempts. The bearish structure emerged following the failed breakout attempt above $3,646. Volume normalized in final hours, suggesting the new $3,565-$3,589 trading range reflects genuine institutional selling rather than temporary liquidity gaps.
Technical Breakdown vs Institutional Accumulation: What Traders Should Watch
Technical factors dominated Tuesday's session as momentum indicators flashed warning signals across multiple timeframes. The $3,646 rejection triggered cascading stops that overwhelmed recent institutional buying interest. Republic Technologies' $100 million ETH allocation and BitMine's 3.5 million token holdings provided insufficient support against the technical breakdown.
The $3,590 support failure marks a critical shift in market structure for ETH bulls. This level had served as a reliable demand zone during recent price swings. With momentum deteriorating and volume patterns confirming distribution, traders now eye further downside testing before any sustainable recovery emerges.
Key Technical Levels Signal Caution for ETH
Support/Resistance: Primary support sits at $3,510-$3,530 cluster, with broken $3,590 level now acting as resistance
Volume Analysis: Breakdown volume of 338,852 exceeded 24-hour average by 138%, confirming institutional selling participation
Chart Patterns: Lower high formation at $3,646 followed by support breakdown establishes bearish continuation setup
Targets & Risk/Reward: Immediate downside target sits at $3,510 support, with further weakness toward $3,480-$3,500 zone likely
CoinDesk Index 5 (CD5) Market Analysis - 10 November 03:00 UTC to 11 November 02:00 UTC
CD5 edged higher from $1,840 to $1,843 during volatile 24-hour trading that featured extreme price swings and distribution patterns across major crypto assets, with the index touching $1,869 highs before sellers emerged near resistance levels and drove prices back toward session averages.
Disclaimer: Parts of this article were generated with the assistance from AI tools and reviewed by our editorial team to ensure accuracy and adherence to our standards. For more information, see CoinDesk's full AI Policy.
免责声明:本文章仅代表作者个人观点,不代表本平台的立场和观点。本文章仅供信息分享,不构成对任何人的任何投资建议。用户与作者之间的任何争议,与本平台无关。如网页中刊载的文章或图片涉及侵权,请提供相关的权利证明和身份证明发送邮件到support@aicoin.com,本平台相关工作人员将会进行核查。


