On the daily chart, bitcoin showed signs of clawing back from a brutal correction, finding footing at a solid support of $98,900. A sequence of lower lows was finally interrupted by a higher low, hinting that the bearish train might be slowing down.
Volume tells its own tale—there’s a waning appetite for selling, with green candles accompanied by timid buying strength. Key resistance sits firm between $108,000 and $110,000, a historical hotspot for price rejection. If bitcoin flirts with this zone again, expect some sparks to fly.
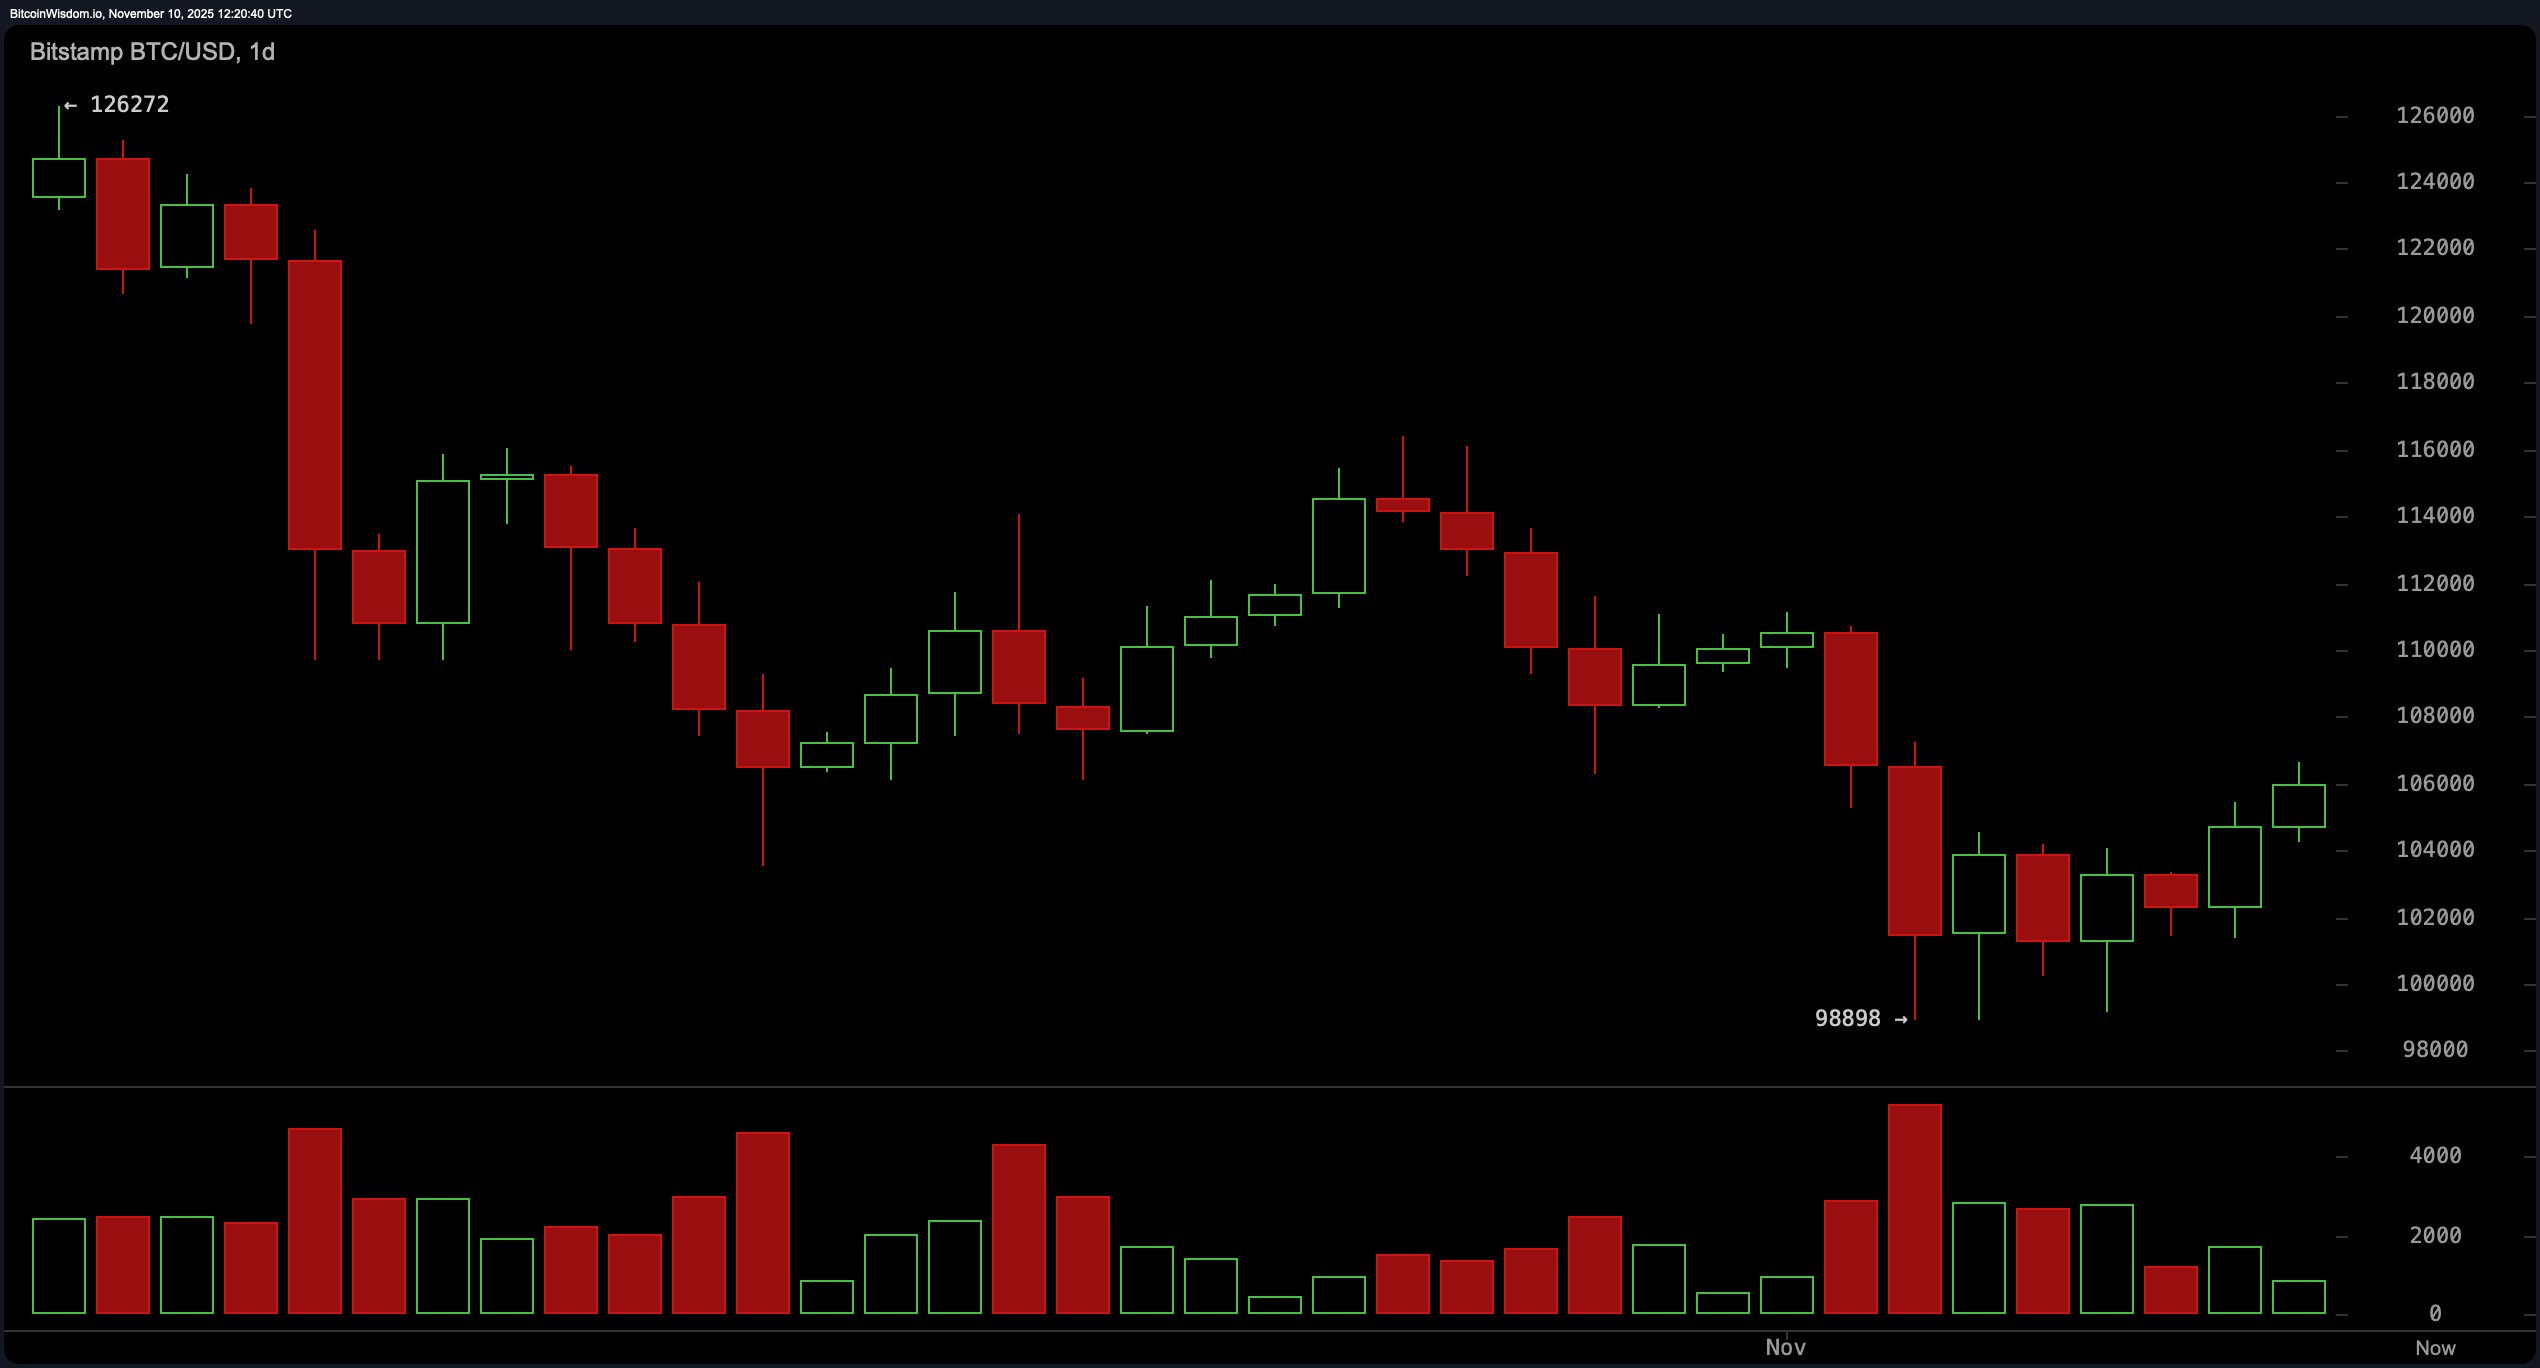
BTC/USD 1-day chart via Bitstamp on Nov. 10, 2025.
Zooming in on the 4-hour chart, momentum looks ready for a high-stakes poker game. A rising wedge formation is developing—often a prelude to a downturn, though nothing’s certain in crypto’s house of mirrors. Still, the higher lows stitched together since November 7 suggest a bit of swagger remains. Volume on upward pushes adds a layer of intrigue, especially as price tests the resistance ceiling at $106,600 to $107,000. If it breaches with volume confirmation, bitcoin could skip higher; but a stumble below $102,000 could send it back to the $100,000 psychological zone.
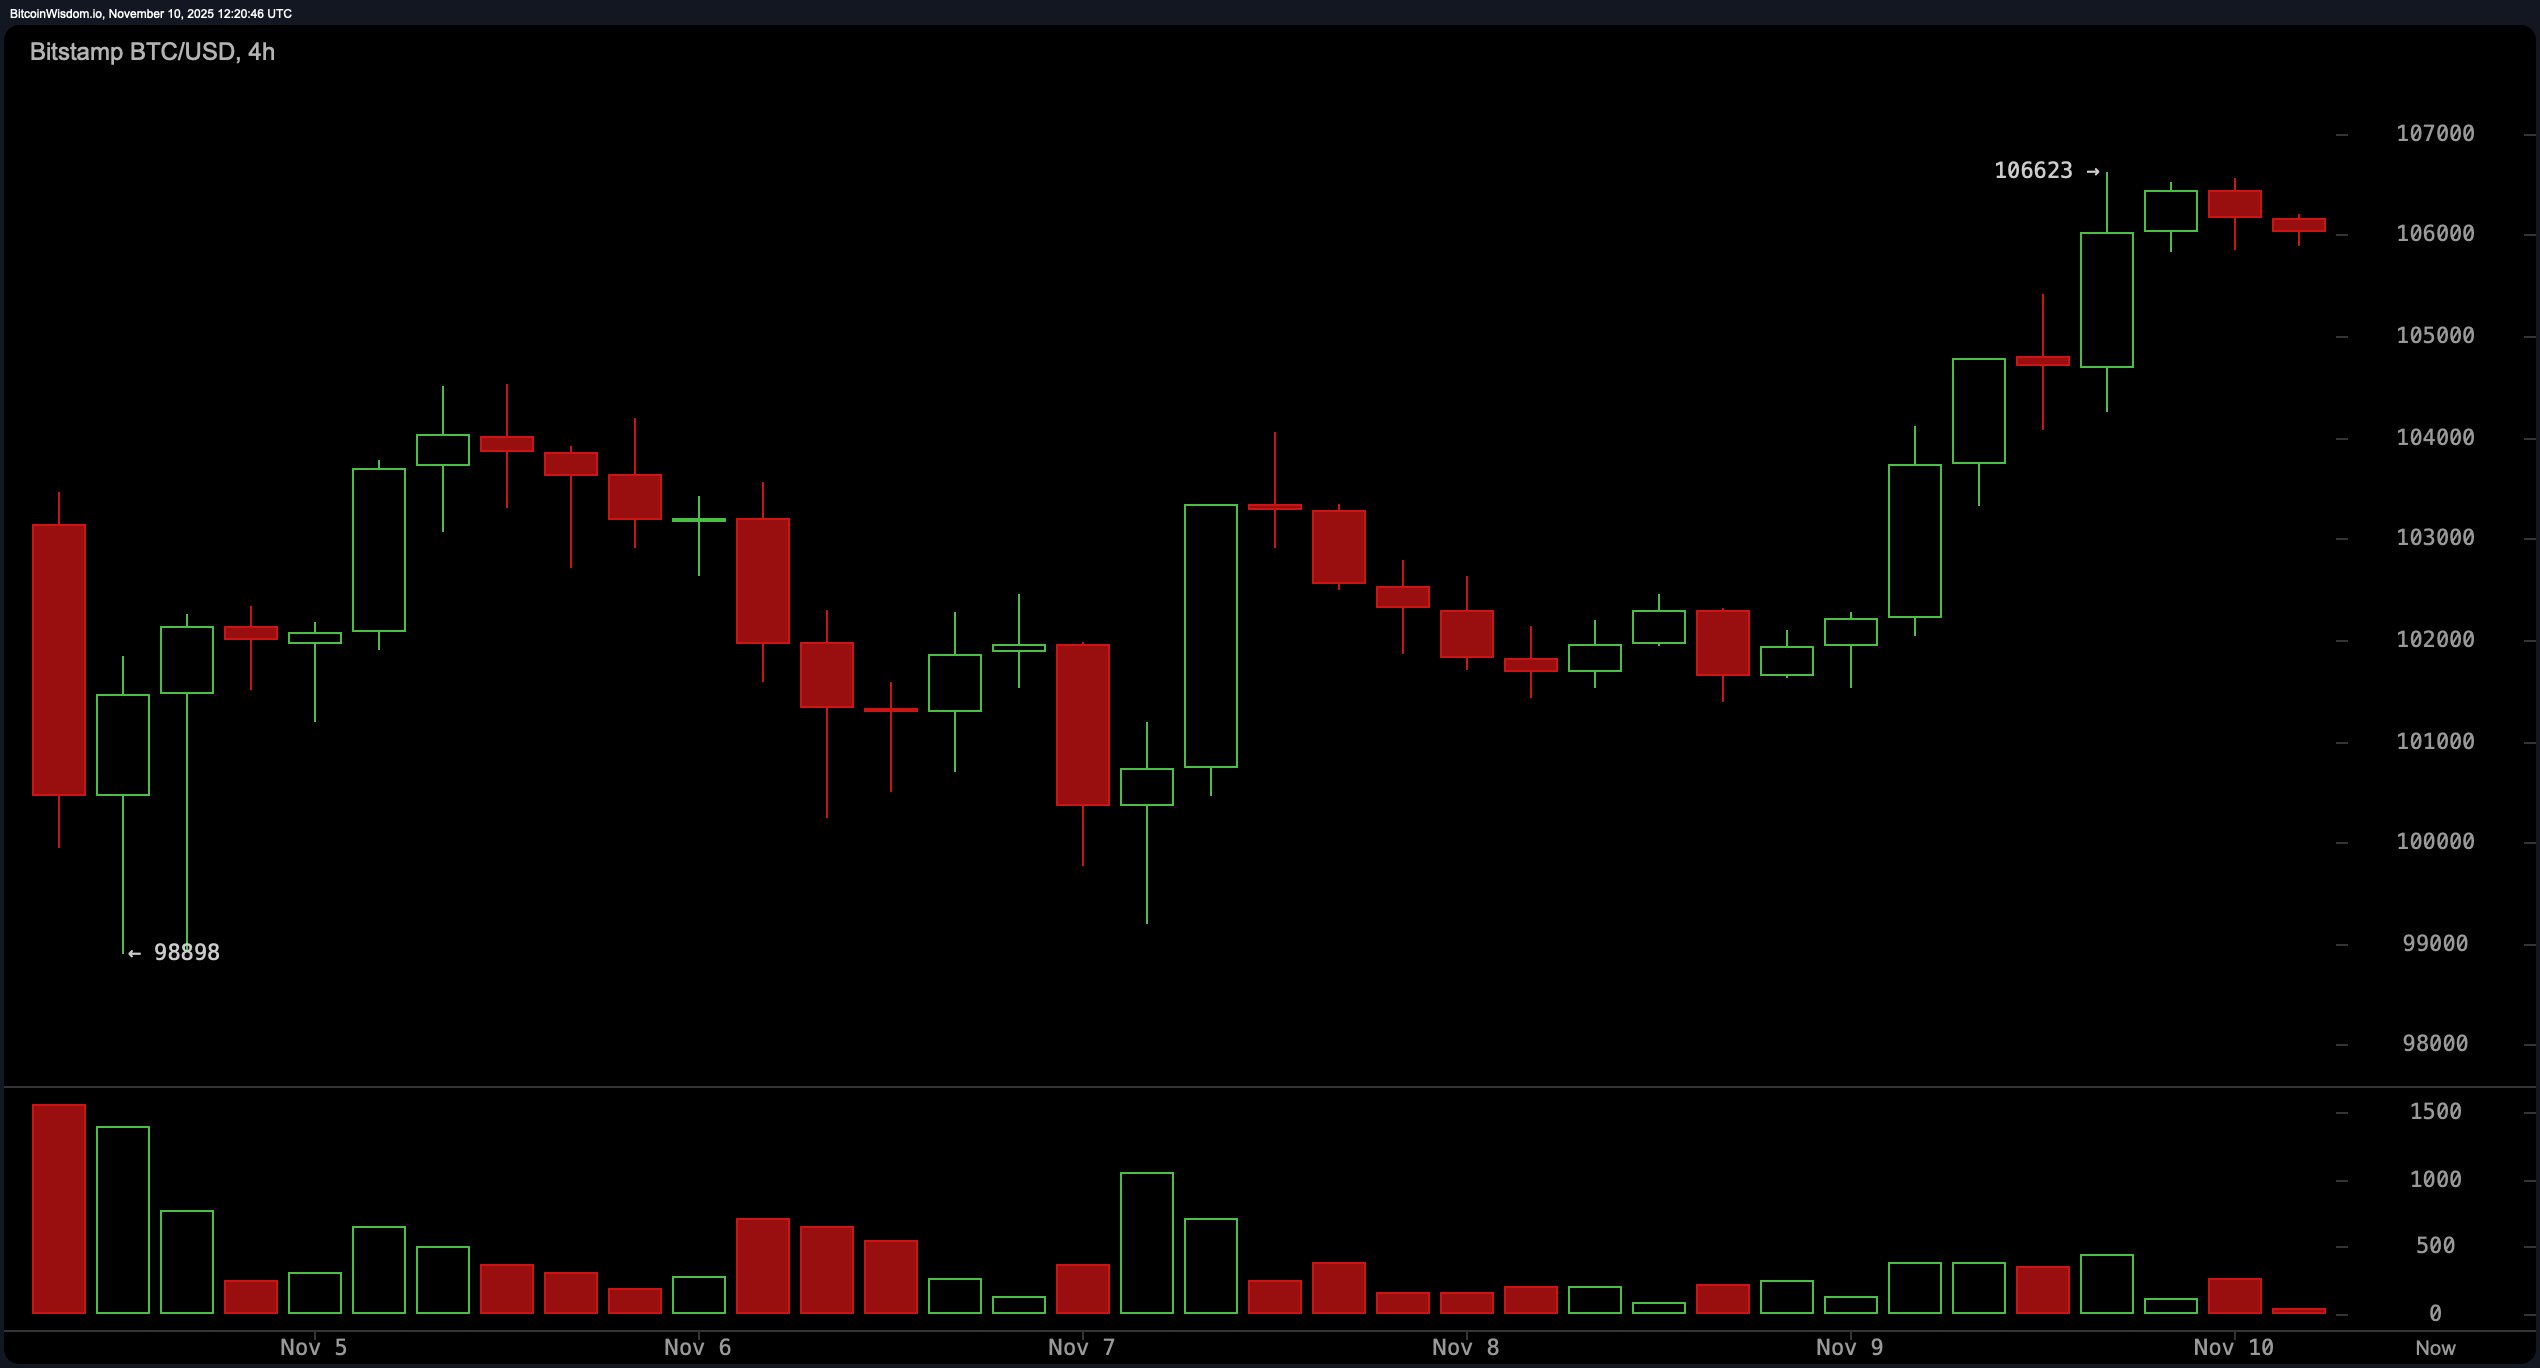
BTC/USD 4-hour chart via Bitstamp on Nov. 10, 2025.
Now, the 1-hour chart? That’s where bitcoin’s short-term ego might be peaking. Price action has stalled near $106,600, teasing either a breakout or a burnout. With diminishing volume and sideways drift, this could be a classic bull flag—or a soft whisper before a micro correction. A break above $106,700 with volume would revive the bulls’ spirits, but a fall below $105,800 could mark the start of an intraday retracement.
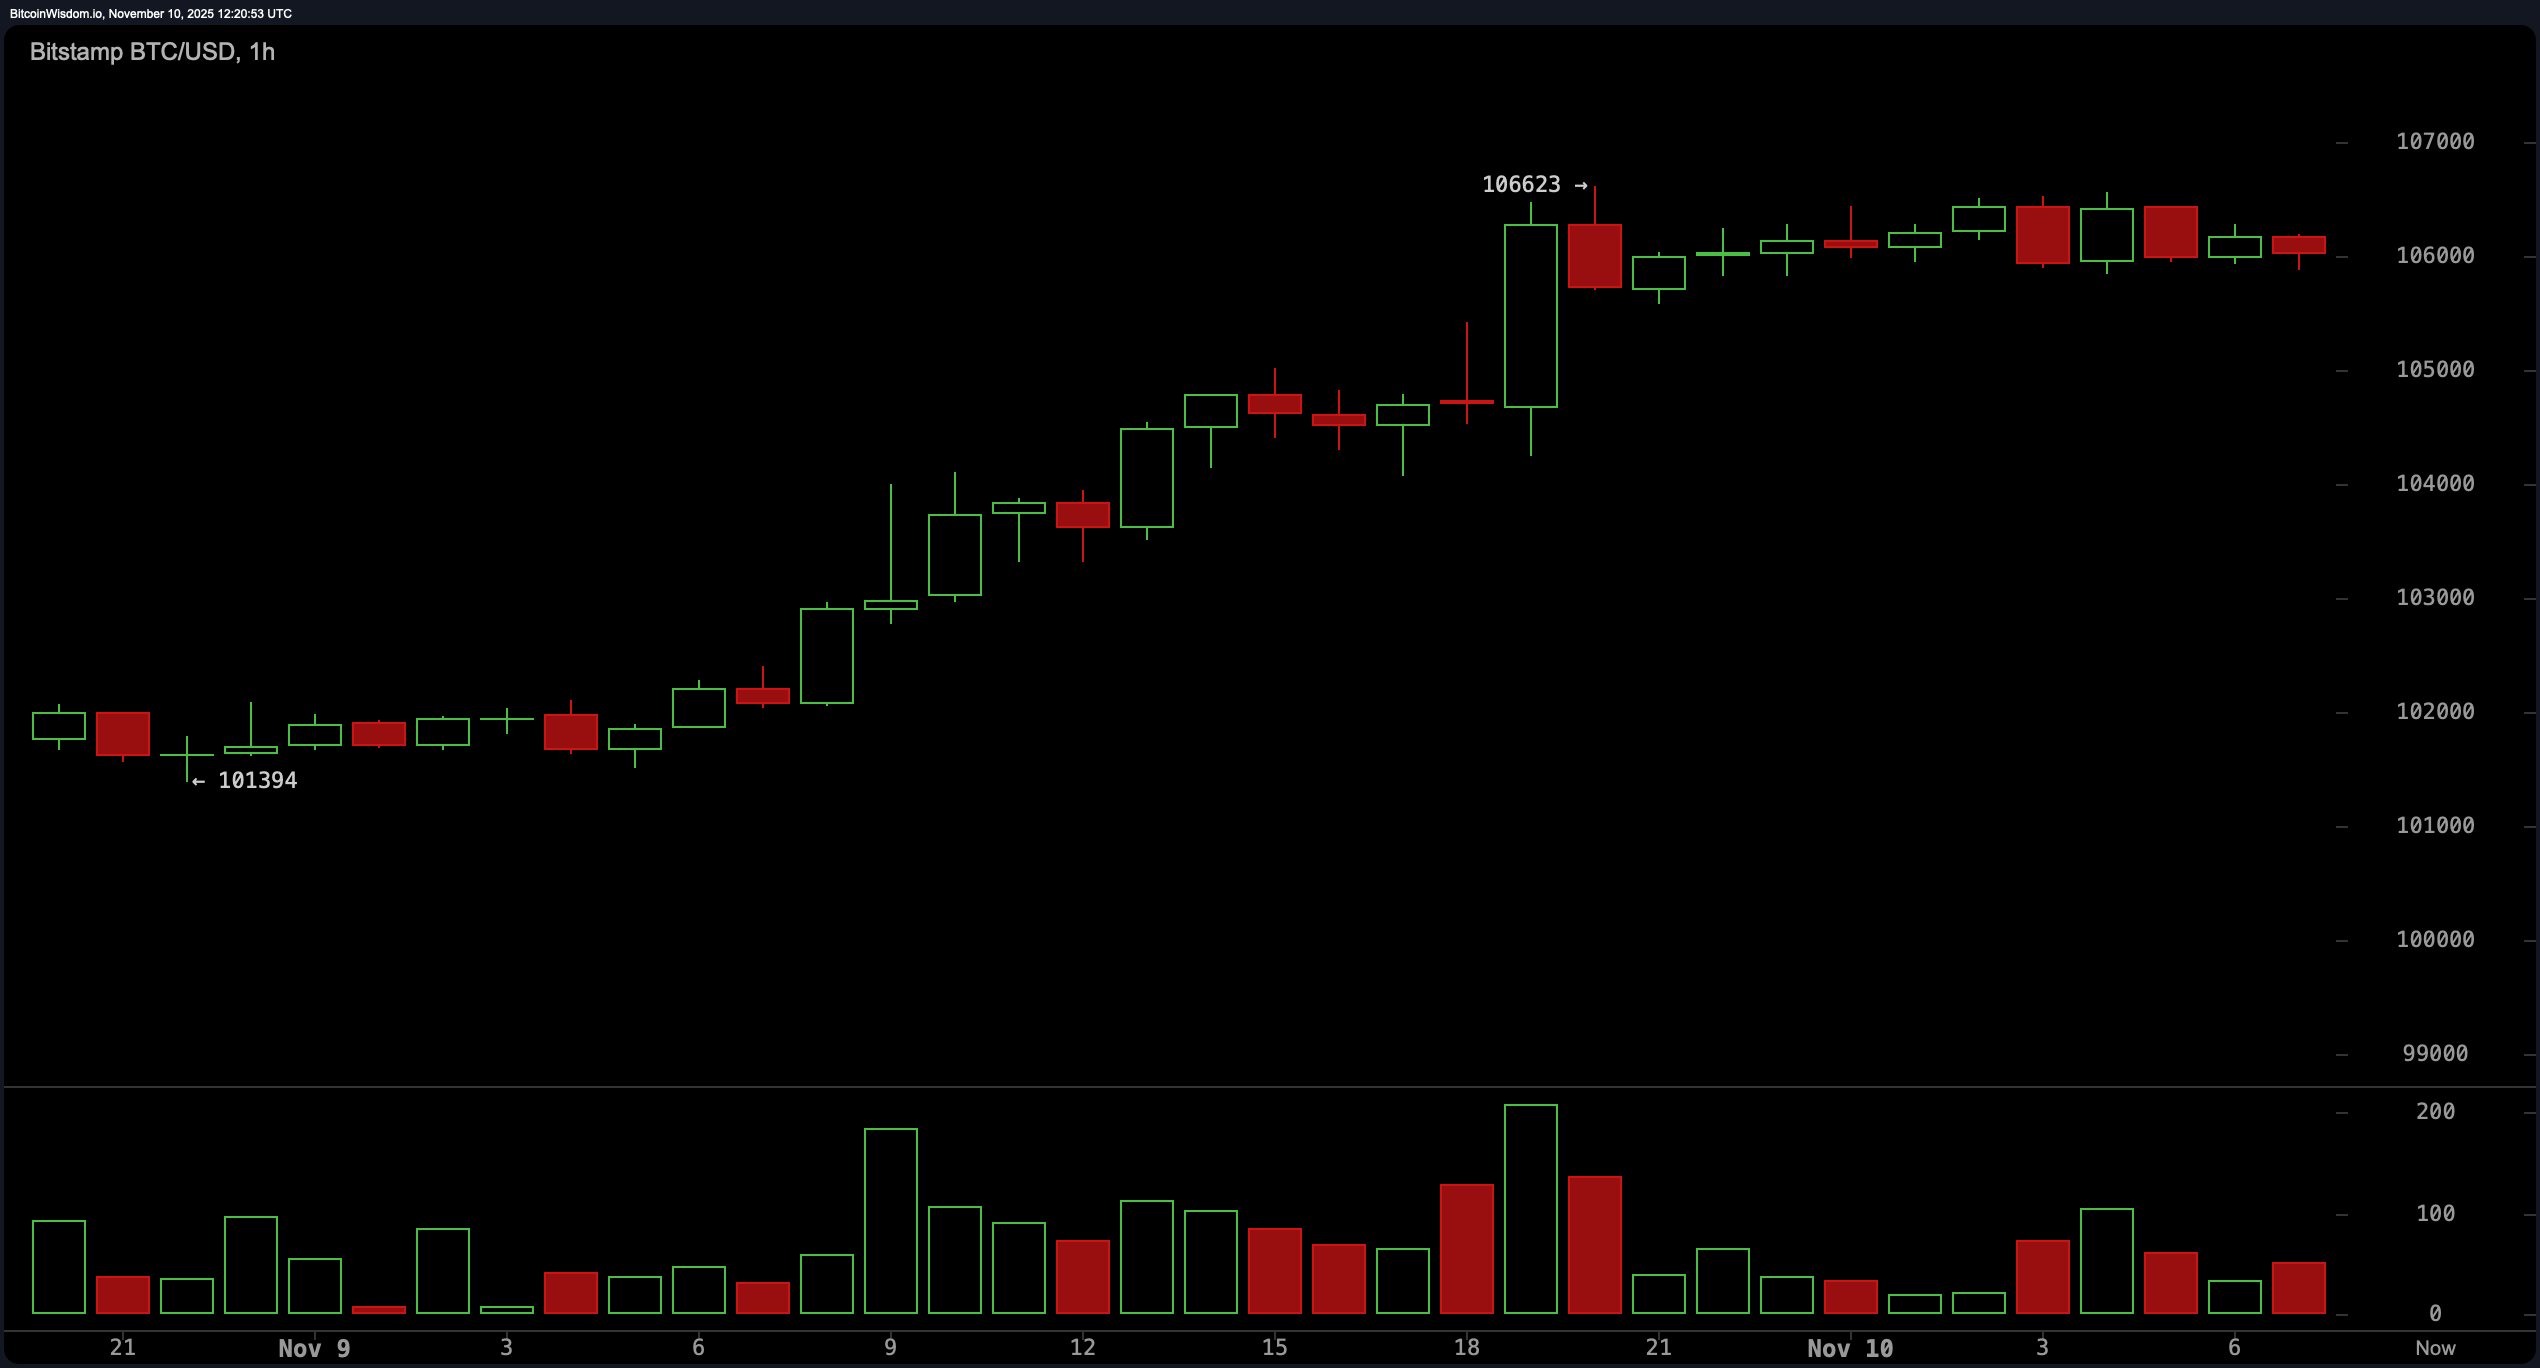
BTC/USD 1-hour chart via Bitstamp on Nov. 10, 2025.
Oscillators across the board are toeing the neutral line like tightrope walkers. The relative strength index (RSI) at 46, stochastic at 31, commodity channel index (CCI) at −44, and the average directional index (ADX) at 25 all suggest a market not quite ready to commit to a definitive direction. The awesome oscillator and momentum indicators split hairs: the awesome oscillator is negative at −6,864, while momentum ticks up at −3,573. Meanwhile, the moving average convergence divergence (MACD) is down at −2,399—still leaning bearish. It’s a tug of war between indecision and subtle optimism.
Moving averages are serving as a reality check, with shorter-term metrics putting on a brave face. The exponential moving average (EMA) and simple moving average (SMA) for the 10-period are flashing green, but every average from the 20-period and up is buried in red ink. The EMA (20) at 107,156 and SMA (20) at 107,994 are already outpaced by current price levels, but the 50, 100, and 200-period moving averages continue to lean toward the south side. It’s a classic case of the near-term dressing up for the party while the long-term still cleans up yesterday’s mess.
In short, bitcoin is waltzing in a market that’s tiptoeing between revival and retracement. The trend might be donning fresh sneakers, but the runway ahead is still littered with resistance traps and momentum potholes.
Bull Verdict:
If bitcoin maintains support above $103,000 and pushes through $106,700 with strong volume, the bulls could gain the upper hand, targeting the $110,000–$112,000 range. The formation of higher lows and improving short-term momentum suggests a recovery may be building traction, especially if oscillators tilt toward bullish confirmation in the coming sessions.
Bear Verdict:
A breakdown below $105,800 on the 1-hour chart or a fall through $102,000 on the 4-hour could signal the start of renewed downward pressure. With most moving averages stacked against the price and the MACD still signaling downside, bears may look to drag bitcoin back toward the psychological $100,000 mark, especially if volume dries up on any attempts higher.
- What is the current price of bitcoin?
Bitcoin is trading at $105,950 as of November 10, 2025. - What key levels should traders watch today?
Watch support near $103,000 and resistance between $106,600 and $110,000. - Is bitcoin showing bullish or bearish signs?
Short-term momentum looks bullish, but long-term signals lean bearish. - What’s the current bitcoin market cap and trading volume?
Bitcoin’s market cap is $2.11 trillion with $70.67 billion in 24-hour volume.
免责声明:本文章仅代表作者个人观点,不代表本平台的立场和观点。本文章仅供信息分享,不构成对任何人的任何投资建议。用户与作者之间的任何争议,与本平台无关。如网页中刊载的文章或图片涉及侵权,请提供相关的权利证明和身份证明发送邮件到support@aicoin.com,本平台相关工作人员将会进行核查。


