Li Ying in the Crypto Circle: Bitcoin Latest Market Analysis on 10.31
Article Published on 2025.10.31------00:30
The current price of Bitcoin is 107,900. Li Ying assesses that the overall trend of Bitcoin shows a significant downward movement. The technical analysis indicates strong bearish signals, with the candlestick pattern forming a bearish engulfing shape. The moving average system is in a bearish arrangement, and a death cross has recently appeared, indicating that the selling side is dominating market momentum. At the same time, the price is approaching a key support level of 106,666. If this level is breached, it may further intensify the downward pressure. The daily chart shows a continuous decline forming a large bearish candlestick, indicating that bearish forces are prevailing in the market. On the 2-hour chart, there has been a consolidation around 108,000, showing signs of a potential halt in the decline in the short term, but overall it remains in a downward trend. The MACD on the 2-hour chart shows weakening bearish momentum but has not yet turned strong. The EMA may face technical rebound pressure in the short term, but the long-term trend remains bearish. Li Ying believes that the strategy should primarily focus on shorting at highs, with some buying at lows.
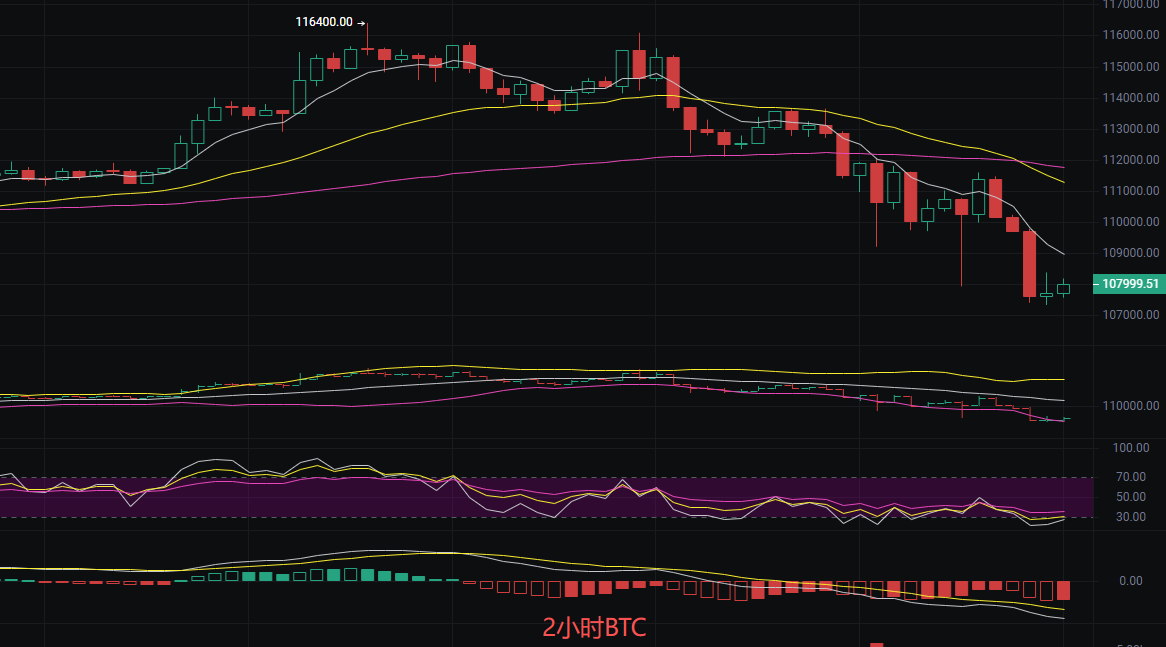
Short-term Strategy Reference:
- Long Entry at 106,500, Stop Loss at 106,000, Take Profit at 108,500
- Short Entry at 109,500, Stop Loss at 110,000, Take Profit at 107,000
Ethereum Latest Market Analysis
Before publication, the current price of Ethereum is 3,780. Li Ying observes that Ethereum is currently in a downward trend. The technical analysis shows that bearish momentum is increasing, but the price is close to a strong support level of 3,706, accompanied by the appearance of a bullish reversal engulfing pattern, which may lead to a rebound resonance. The trend indicators still show a bearish arrangement and a death cross, and the trading volume has significantly increased alongside the price decline, forming a divergence between volume and price, indicating that the market has not completely escaped downward pressure. On the 2-hour chart, the price has gradually risen from a low of 3,763 to 3,779, forming a small bullish candlestick, but overall it remains in a weak state. The daily chart shows three consecutive days of decline, with a low of 3,758, indicating a clear bearish trend. The MACD on the 2-hour chart is still dominated by bears, and the EMA shows a downward divergence, indicating significant pressure from short-term, medium-term, and long-term moving averages, with the trend still leaning bearish. Given such a clear trend, Li Ying believes that everyone will not go against the trend, and naturally, the focus should be on shorting.
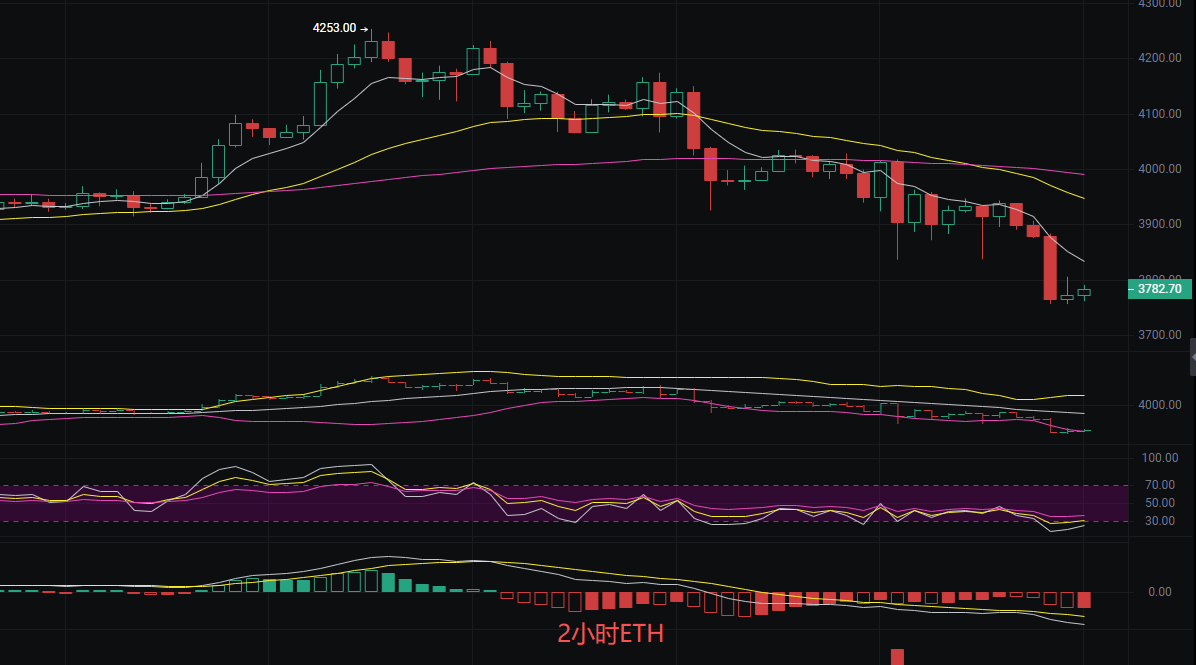
Short-term Point Reference:
- Short Entry at 3,950, Stop Loss at 4,000, Take Profit at 3,750
- Long Entry at 3,700, Stop Loss at 3,650, Take Profit at 4,000
The above content is exclusively created by Li Ying. Please indicate the source when reprinting! The article's publication review may have delays, and the market changes rapidly. The above suggestions are for reference only, and risks are borne by the reader. I hope Li Ying's insights will be helpful to you!

The content of the article is time-sensitive and for reference only; risks are borne by the reader.
免责声明:本文章仅代表作者个人观点,不代表本平台的立场和观点。本文章仅供信息分享,不构成对任何人的任何投资建议。用户与作者之间的任何争议,与本平台无关。如网页中刊载的文章或图片涉及侵权,请提供相关的权利证明和身份证明发送邮件到support@aicoin.com,本平台相关工作人员将会进行核查。


