Li Ying in the Crypto Circle: Bitcoin Latest Market Analysis on 10.29
Article Published on 2025.10.29------00:30
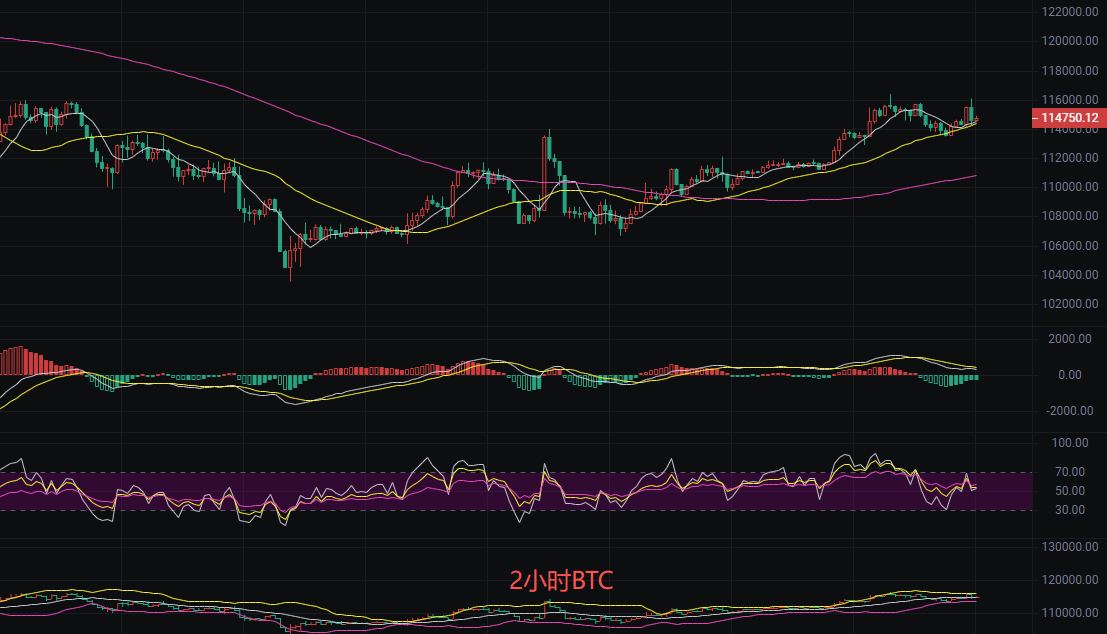
The current price of Bitcoin is 114,770. Li Ying predicts that Bitcoin is consolidating between support and resistance, failing to break through the key resistance level of 116,400 in the short term. The bullish arrangement of the moving average system and the golden cross have created a strong bullish resonance signal, and the engulfing pattern further strengthens the market's potential upward trend. However, the lack of trading volume data has become a key obstacle, making it impossible to confirm whether the volume-price relationship supports the continuation of the trend. The K-line fluctuates within the range of 114,000 to 116,000. The daily upward momentum is weakening. The MACD's 2-hour short-term trend is bearish. The EMA long-term trend remains bullish. The 2-hour trading volume has increased, and Li Ying's strategy remains unchanged, with the market still in a bullish trend. Therefore, the strategy focuses on buying on dips at support, with selling at resistance as a secondary consideration, and emphasizes risk control as the top priority.
Short-term Strategy Reference:
- Buy Point: 113,500, Stop Loss: 113,000, Stop Loss Distance: 500 points, Target: 115,500
- Sell Point: 115,500, Stop Loss: 116,000, Stop Loss Distance: 500 points, Target: 113,500
Ethereum Latest Market Analysis
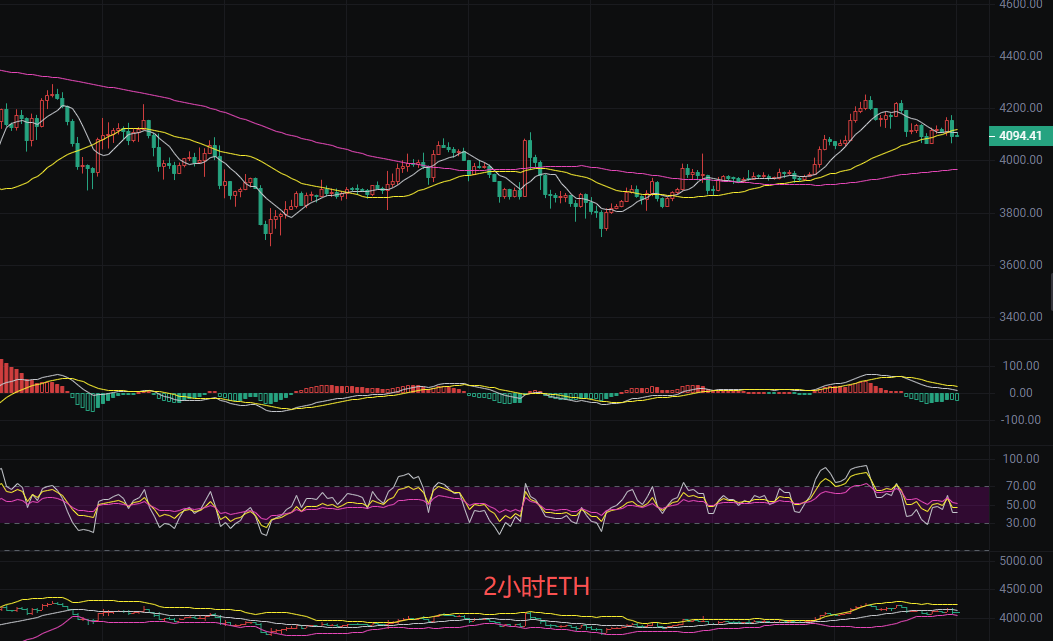
Before publication, the current price of Ethereum is 4,095. Li Ying observes that the current market shows clear signs of consolidation, with conflicting technical signals and volume-price relationships. The recent formation of a bearish engulfing pattern usually indicates short-term downward risk, but the extremely low trading volume has weakened the strength of this signal. The price is between the support level of 3,400 and the resistance level of 4,754, with strong support likely limiting further downside. The price has been oscillating at a high level without breaking through the previous high point of 4,251, which presents strong resistance. The daily chart may enter an adjustment phase in the short term. The MACD on the 2-hour chart is bearish; the daily MACD is still near the zero axis but shows signs of weakening. The EMA at 4,099 serves as short-term support; if it fails, it may test the EMA 120 moving average at 4,012. The short-term pullback is insufficient, so it is recommended to wait for confirmation of support before considering a buy; for now, a wait-and-see approach is suggested.
Short-term Point Reference:
- Sell Point: 4,200, Stop Loss: 4,250, Stop Loss Distance: 50 points, Target: 4,100
- Buy Point: 4,020, Stop Loss: 3,960, Stop Loss Distance: 50 points, Target: 4,150
The above content is exclusively original by Li Ying; please indicate the source when reprinting! Article publication review may have delays, and market conditions change rapidly. The above suggestions are for reference only, and risks are borne by the reader. I hope Li Ying's insights will be helpful to you!

The content of the article is time-sensitive and for reference only; risks are borne by the reader.
免责声明:本文章仅代表作者个人观点,不代表本平台的立场和观点。本文章仅供信息分享,不构成对任何人的任何投资建议。用户与作者之间的任何争议,与本平台无关。如网页中刊载的文章或图片涉及侵权,请提供相关的权利证明和身份证明发送邮件到support@aicoin.com,本平台相关工作人员将会进行核查。


