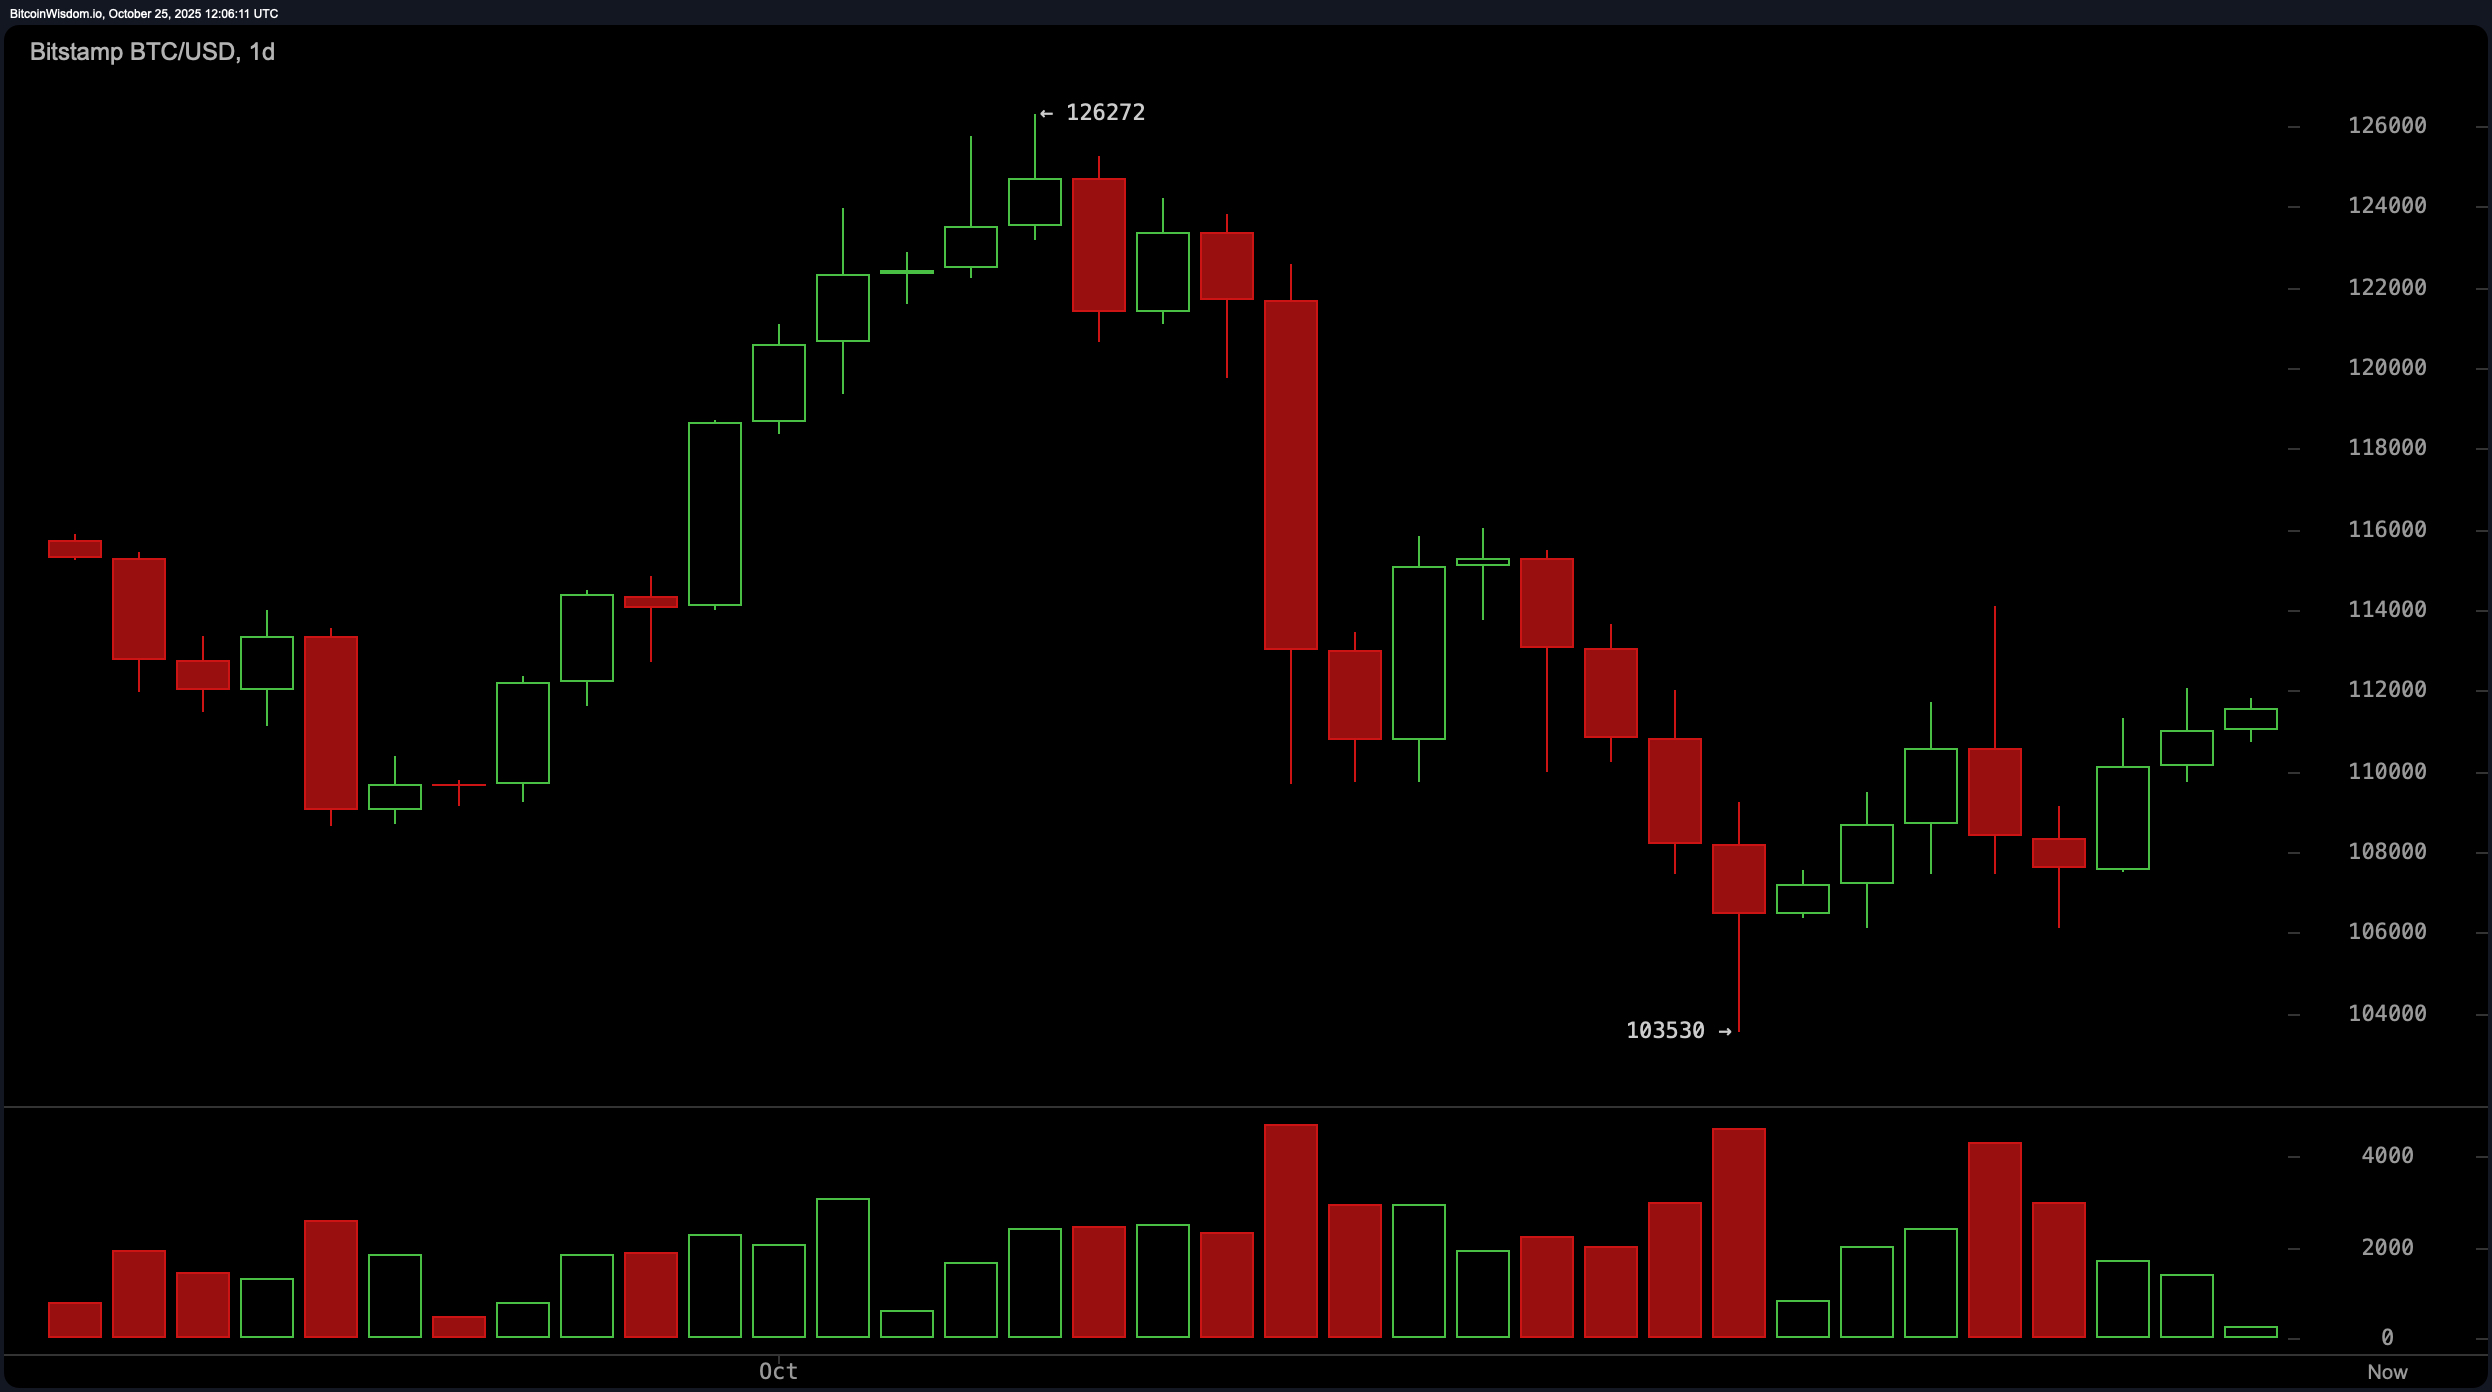
On the daily chart, bitcoin is attempting to recover after a sharp correction from its recent high of approximately $126,272. A bearish engulfing pattern ignited panic selling, bottoming out at around $103,530. Since then, the price has staged a rebound with moderate volume, though any flirtation with the $112,000 level is being met with resistance unless accompanied by a strong uptick in volume.
Key resistance looms between $114,000 and $116,000, where previous support has flipped sides like a moody ex. Traders eyeing swing setups should watch for reentry around $108,000–$110,000—ideally on reduced volume and bullish candle patterns like hammers or doji.

BTC/USD 1-day chart via Bitstamp on Oct. 25, 2025.
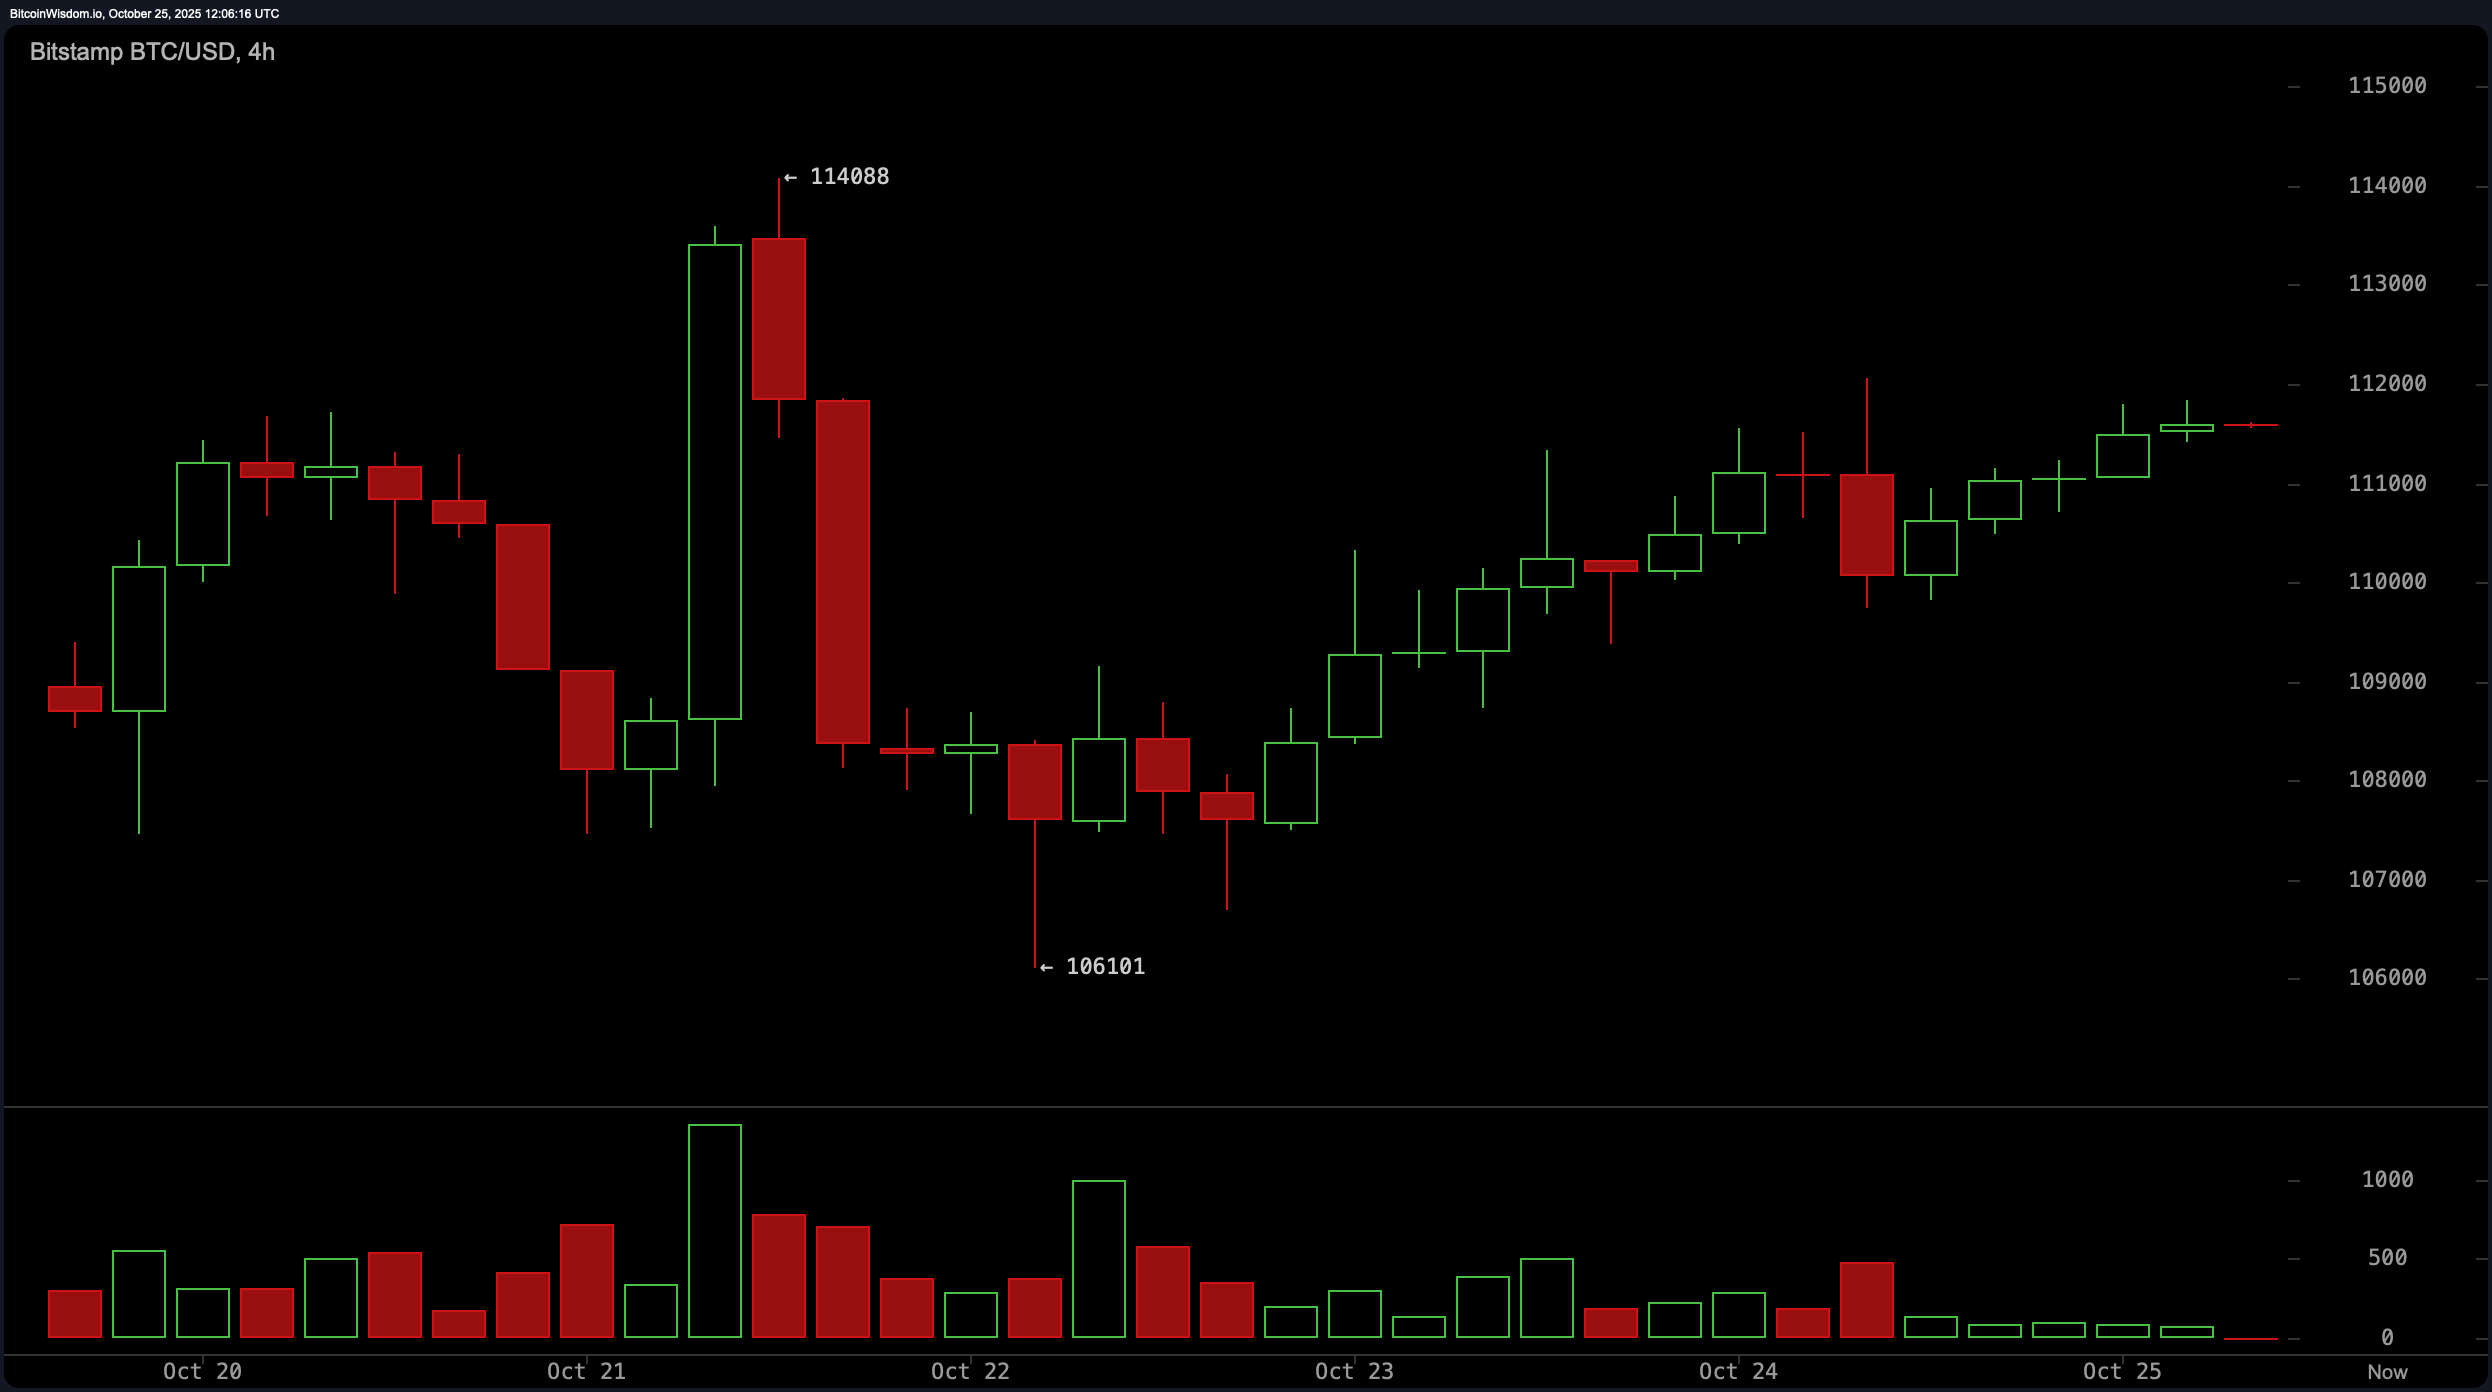
The 4-hour chart paints a more energetic picture. Following a local low near $106,101, bitcoin has been printing higher lows with decent bullish momentum. The price has bounced strongly, fueled by clean green candles and limited wick rejection. However, a slight drop in volume suggests the engine may need a pit stop before continuing. Should the price pull back to the $110,000 level with a bullish engulfing signal, momentum traders could find a renewed entry point. That said, multiple rejections at the $114,000 area underscore the need for caution— bitcoin must punch through this level with convincing volume to even sniff $118,000.

BTC/USD 4-hour chart via Bitstamp on Oct. 25, 2025.
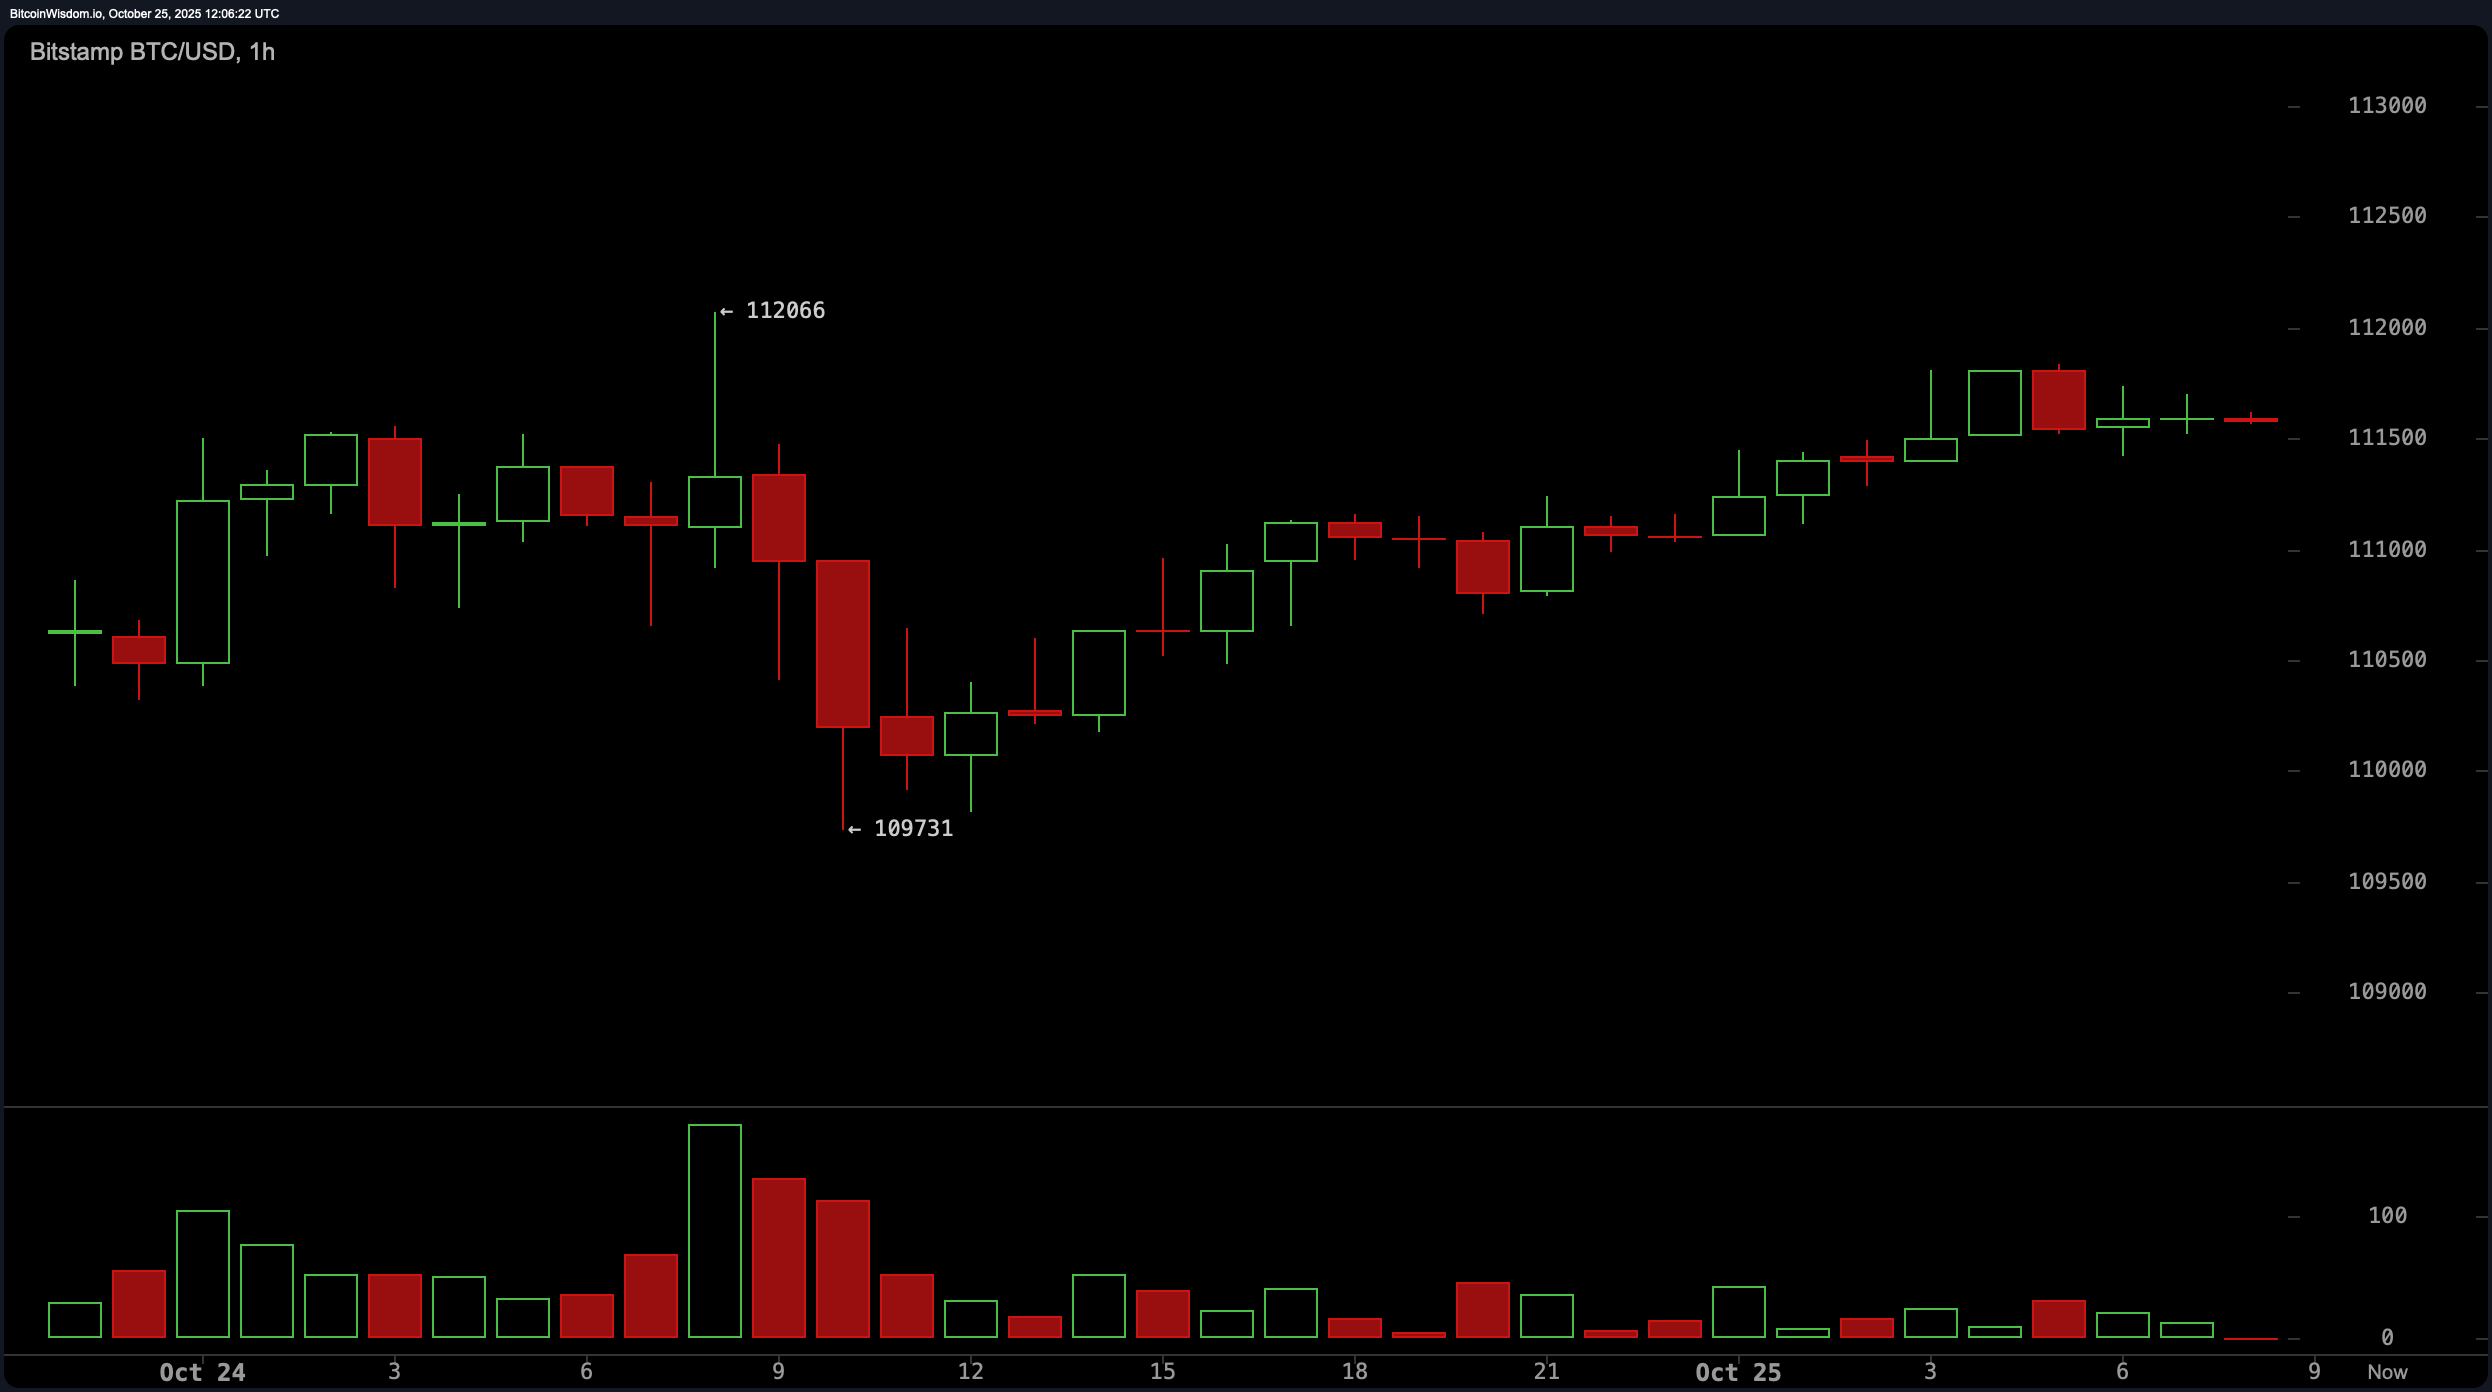
Zooming into the hourly chart reveals a classic tug-of-war. Bitcoin has been consolidating tightly just below $112,000, reflecting short-term market indecision. Volume has dried up like a summer creek, indicating neither buyers nor sellers want to make the first bold move. If the price breaks above $112,100 with gusto (and volume), there could be a quick ride up to the $113,000–$113,500 zone. Conversely, a slip below $111,200 might drag it back toward $110,000, giving scalp traders something to chew on.

BTC/USD 1-hour chart via Bitstamp on Oct. 25, 2025.
Turning to indicators, the oscillator panel looks like a poker game full of folded hands. The relative strength index (RSI) at 48, stochastic at 53, and commodity channel index (CCI) at -26 all sit squarely in neutral territory. The average directional index (ADX) at 20 agrees: this market lacks a dominant trend. The awesome oscillator is currently printing at -3,911—neutral again—while momentum at 798 is the only outlier flashing positive vibes. But before anyone gets excited, the moving average convergence divergence (MACD) level at -1,649 tells a different story with a sell signal, adding a bit of a plot twist.
Finally, the moving averages (MAs) are throwing a bit of shade. While the 10-day exponential moving average (EMA) and simple moving average (SMA) both suggest upward potential, the 20-day and beyond are stacked like dominoes in favor of the bears. The 200-day EMA and SMA—sitting comfortably around $108,000—are the only long-term supports still flashing green, while the rest (from the 20-day to the 100-day moving averages) are signaling downward pressure. It’s a battlefield of averages, and right now, the short-term is looking more hopeful than the long haul.
Bull Verdict:
If bitcoin can maintain its footing above the $110,000 zone and break cleanly through the $112,000 resistance with accompanying volume, the short-term technicals suggest further upside toward the $114,000–$116,000 range. Momentum is cautiously rebuilding, and with volume capitulation likely behind us, the bulls may just be warming up for the next leg higher.
Bear Verdict:
Despite recent recovery attempts, bitcoin remains trapped below key resistance and is facing a wall of moving average pressure. Oscillators are lukewarm, and a lack of follow-through volume could leave the asset vulnerable to a deeper retest of $108,000—or worse, back toward its recent $103,000 low. Without a decisive break above $112,000, the bears still have the upper hand in the near term.
- What is bitcoin’s current price today?
As of October 25, 2025, bitcoin is trading at $111,605. - Is bitcoin showing bullish or bearish signals right now?
Bitcoin is consolidating below key resistance, with mixed signals from indicators and moving averages. - Where is bitcoin facing the strongest resistance?
Major resistance is at the $114,000 to $116,000 range on multiple timeframes. - What support levels are important for bitcoin today?
Key support sits between $108,000 and $110,000, based on daily and 4-hour charts.
免责声明:本文章仅代表作者个人观点,不代表本平台的立场和观点。本文章仅供信息分享,不构成对任何人的任何投资建议。用户与作者之间的任何争议,与本平台无关。如网页中刊载的文章或图片涉及侵权,请提供相关的权利证明和身份证明发送邮件到support@aicoin.com,本平台相关工作人员将会进行核查。


