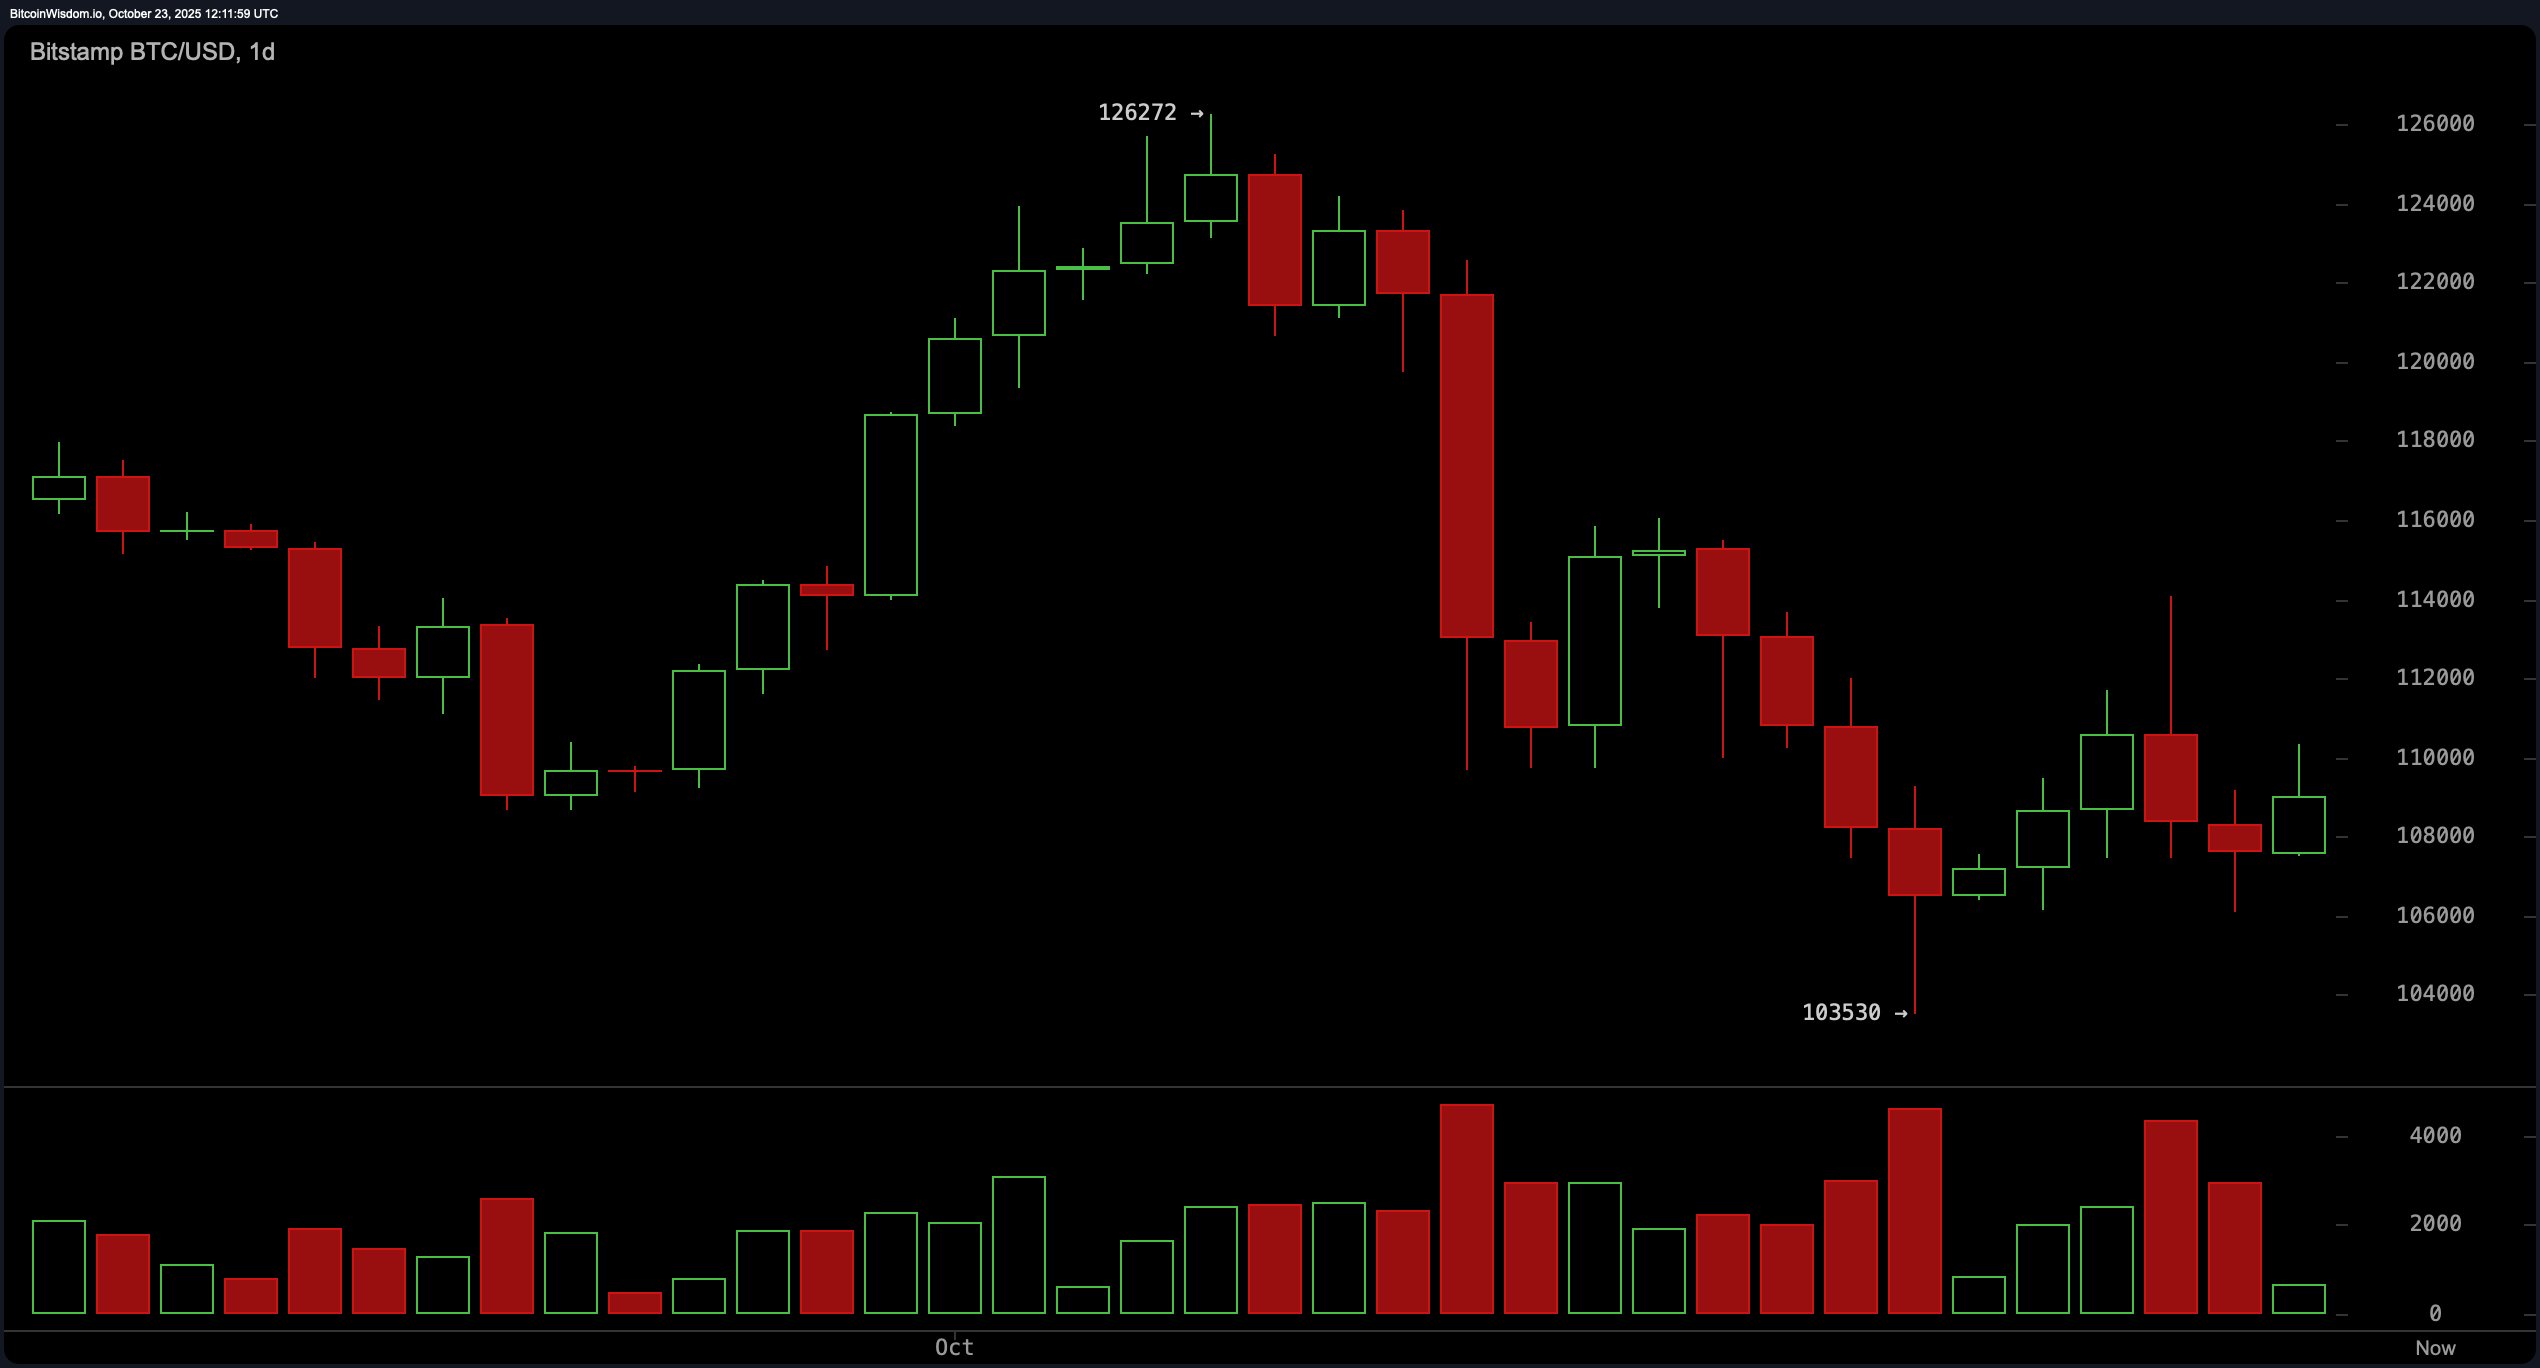
If bitcoin had a mood, today it’d be “I’m trying, OK?” The daily chart tells the tale of a coin fighting to claw its way back after a nosedive that had traders clutching their keyboards. After peaking at $126,272, the price fell hard to $103,530 — a dramatic capitulation with volume spikes screaming panic.
Buyers showed up at the party right on cue near the 103.5k level, as indicated by that juicy long tail and surging volume. But now? Price action is trapped between a rock and a psychological wall near $112,000. Without a clean break above that zone, this bounce may be more of a breather than a breakout.

BTC/USD 1-day chart via Bitstamp on Oct. 23, 2025.
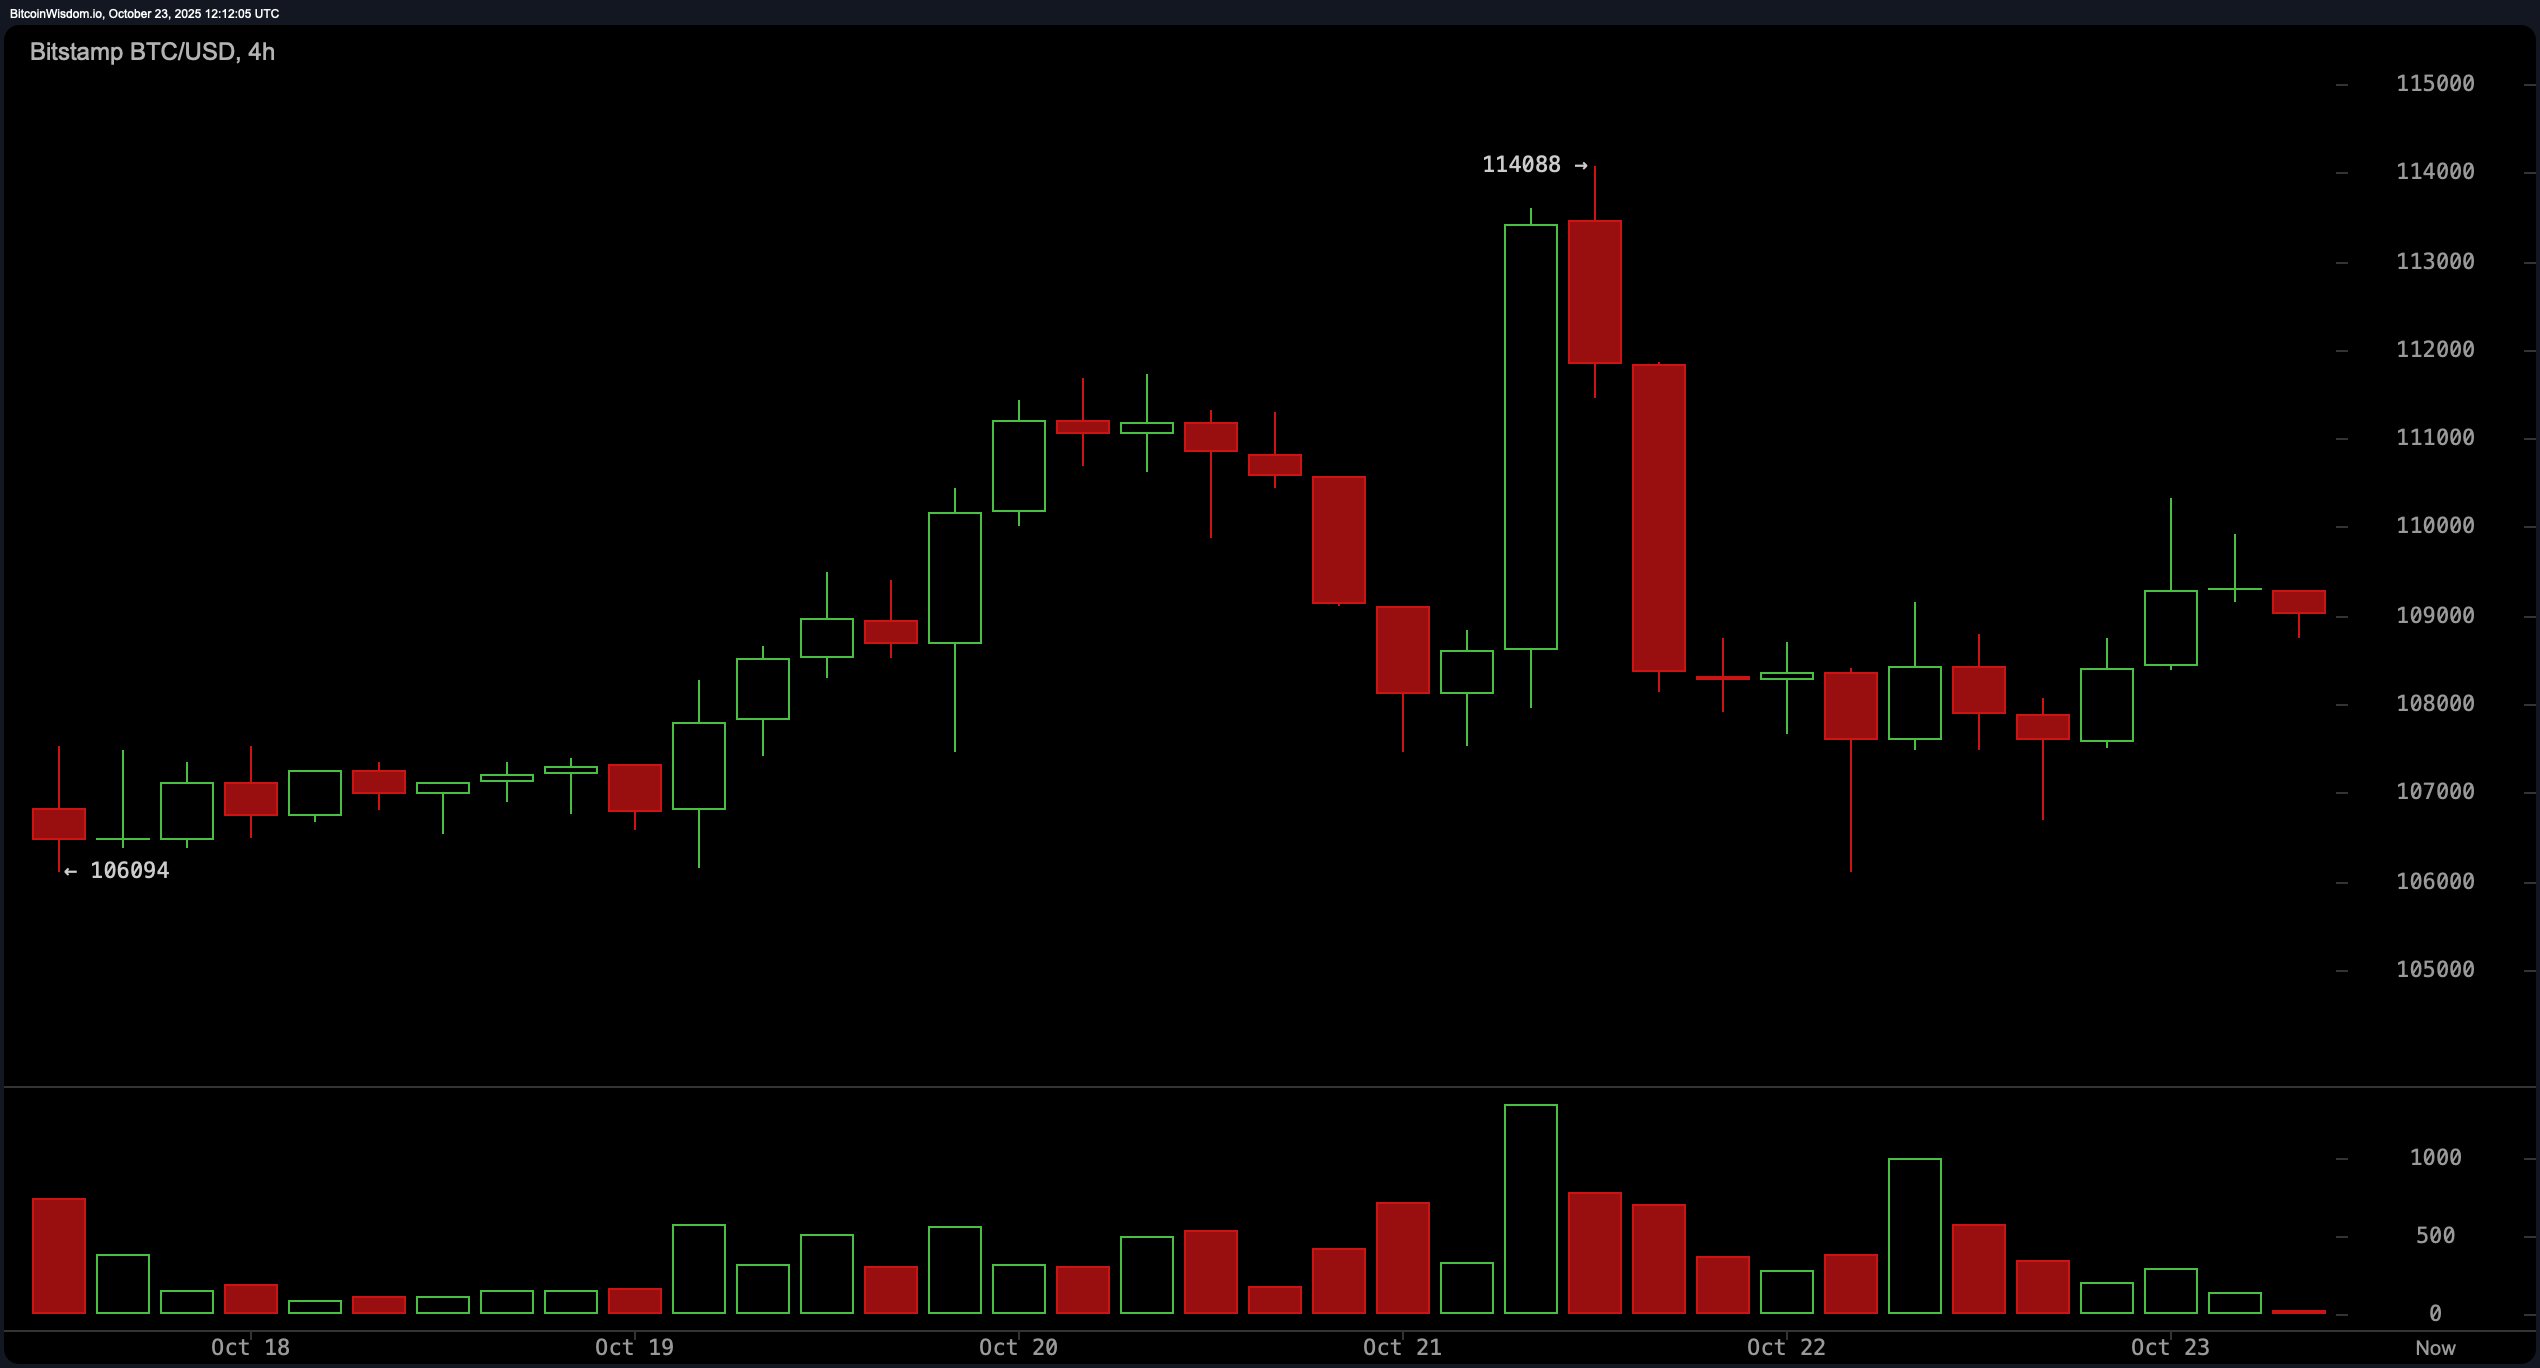
Zooming into the 4-hour chart reveals a tug-of-war between ambition and exhaustion. After bouncing from a local low of $106,094 and sprinting to $114,088, bitcoin lost steam — a classic bull trap or short squeeze move that left latecomers with nothing but regret. The price is now grinding sideways between $108,000 and $110,000, reflecting a standoff in sentiment. Momentum needs a caffeine shot in the form of volume if this consolidation is going to resolve upward.

BTC/USD 4-hour chart via Bitstamp on Oct. 23, 2025.
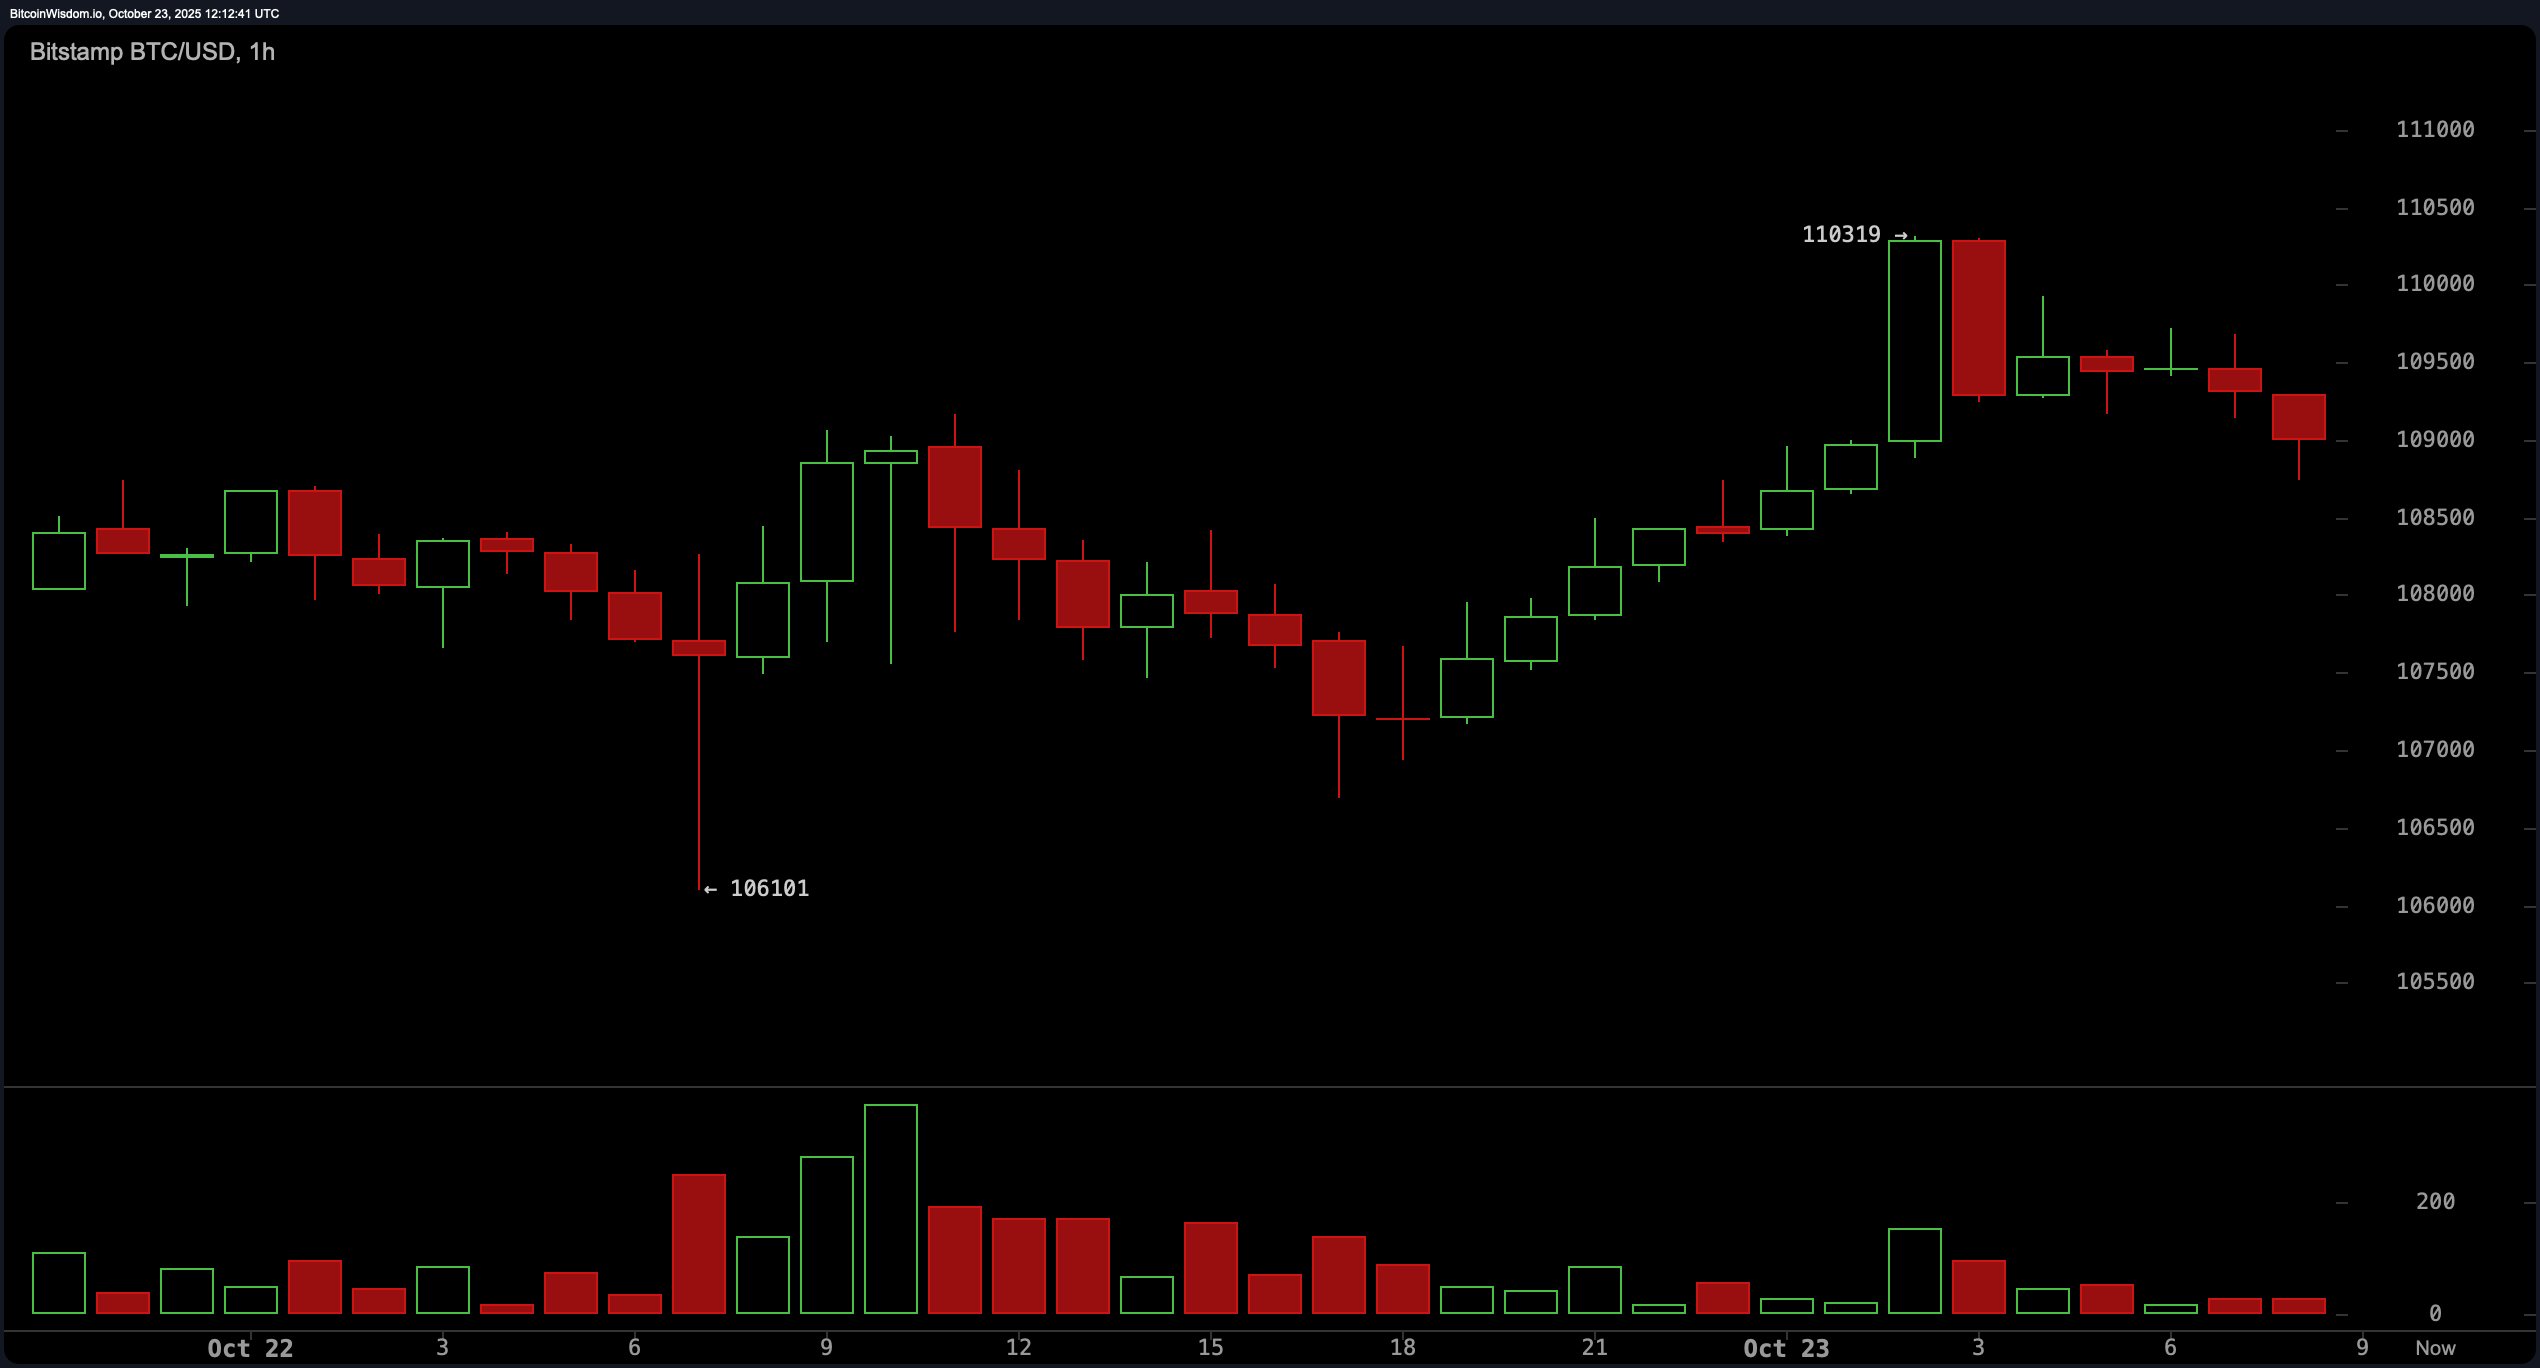
On the 1-hour chart, bitcoin appears to have sobered up — at least for now. A climb from the $106,101 low to $110,319 gave day traders some thrills, but that upward energy is showing signs of fatigue. With momentum flattening and rejection just below 110.3k, a pullback to the 108.5k–109k range seems likely. This would align with short-term support, and any bounce there should be backed by volume to avoid turning into a false start.

BTC/USD 1-hour chart via Bitstamp on Oct. 23, 2025.
Oscillators are sitting on the fence. The relative strength index (RSI) at 43, stochastic at 24, and commodity channel index (CCI) at -65 are all signaling neutrality. The average directional index (ADX) echoes the same tone at 23, while the awesome oscillator sits in the red at -5,224. The momentum indicator, however, is tipping its hat at -6,236, suggesting the down move could be running on fumes. Yet the moving average convergence divergence (MACD) is less optimistic at -2,154, reinforcing that the recovery effort might still be stuck in first gear.
Looking at the moving averages, the technical jury is still out. The 10-period simple moving average (SMA) is sitting right at today’s price — 109,004 — but its exponential cousin is trailing above at 109,817, hinting at near-term indecision. Broader trends aren’t bullish either, with all 20-, 30-, 50-, and 100-period moving averages (both simple and exponential) waving red flags. Only the 200-period simple and exponential moving averages, hovering around 108,300, remain supportive — suggesting that long-term holders still have a faint smile on their faces.
So, is bitcoin leaning toward a breakout or just breathing between sprints? For now, price action is dancing between key zones of 108k–110k, with strong resistance at 112k and 114k. Until volume picks a side and the charts follow suit, traders would be wise to keep their coffee hot and their eyes sharper.
Bull Verdict:
If bitcoin can hold the 108k–109k support range and punch through the 112k ceiling with conviction, the bulls might just reclaim the narrative. A confirmed breakout with volume would flip the script from shaky recovery to trend reversal — but until then, optimism is on probation.
Bear Verdict:
Failure to breach 112k resistance and continued weakness in key momentum indicators could drag bitcoin back toward the 106k zone — or even test that 103.5k panic bottom again. Without a surge in volume and a shift in short-term structure, the bears still have their claws in this chart.
- What is bitcoin’s price today?
Bitcoin is trading at $109,003 as of October 23, 2025. - What’s bitcoin’s current market cap?
Bitcoin’s market capitalization stands at $2.17 trillion. - What is bitcoin’s 24-hour trading volume?
The 24-hour volume is $73.11 billion, reflecting high activity. - What is bitcoin’s current price range?
Bitcoin’s intraday price has ranged between $106,786 and $110,162.
免责声明:本文章仅代表作者个人观点,不代表本平台的立场和观点。本文章仅供信息分享,不构成对任何人的任何投资建议。用户与作者之间的任何争议,与本平台无关。如网页中刊载的文章或图片涉及侵权,请提供相关的权利证明和身份证明发送邮件到support@aicoin.com,本平台相关工作人员将会进行核查。


