Conducting nearly unbiased research can take you further than any machine learning method.
Written by: ltrd
Compiled by: Block unicorn
All long-term profitable traders know that unbiased and emotionless decision-making is key to the sustainable development of a trading career. You must break free from entrenched thinking patterns and continuously reassess the risk-reward ratio and the likelihood of adverse choices. For this reason, a well-structured research process is crucial for every successful trader.
But why am I speaking to you this way—and why did I title this article "Is Binance Evil?"
The reason is simple. Over the past few weeks, I have seen strong emotions surrounding Binance and other exchanges. Some arguments against exchanges (especially Binance) are indeed well-founded, but I keep seeing biased reasoning and conclusions, which is why I decided to conduct a simple and transparent study on a hypothesis:
H₀: "Binance is evil and negative for projects listed on exchanges."
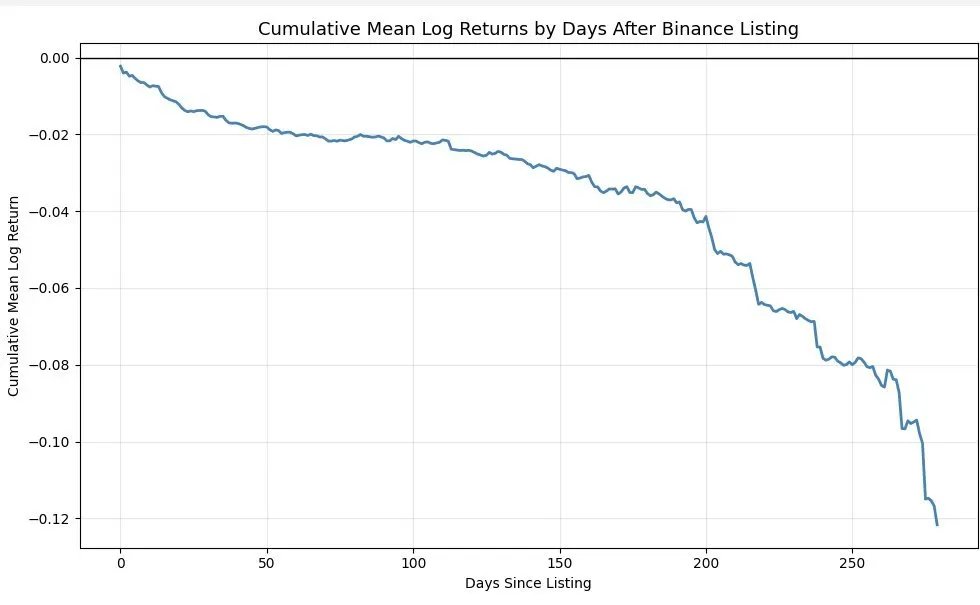
The first thing that motivated me to conduct this research was a post by Scott Phillips (I actually enjoy your posts and your way of thinking—there's no personal offense intended, I hope you can forgive me). He published a nice-looking chart showing the average price trends of all coins in the first 300 days after being listed on Binance. There was nothing wrong with the chart itself—I also like this kind of analysis—but one thing made me uncomfortable: the statement "Binance is a cancer to the industry."
I just couldn't see the connection between the data in the chart and that conclusion.
Imagine you walk into my office (many people do this every day) and tell me: "Tom, look at this chart—Binance is a cancer to this industry."
You better have backed up everything on your work notebook because you won't be touching it again. This article is not actually about Binance—it’s about testing a hypothesis and verifying whether it is correct. It’s about the integrity of methodology and how to persuade people that the hypothesis you propose is valid.
Before we begin, I hope you can critique my points through analysis. That’s exactly what we do in research meetings. I won’t get angry—I’m used to constructive criticism and don’t even care anymore; I just want to ensure my analysis is correct so I can learn from it. Your only goal is to carefully examine and point out every possible error in my reasoning. I’m not here to prove that Binance is not evil. I just want to verify whether this hypothesis holds.
When I see this type of chart, I always think: there’s a lack of random correction.
What does that mean? It means I want to look at random listing data from other similar exchanges and then subtract those results from the Binance dataset. That’s how to eliminate bias. In our case, it’s not actually random because we can easily calculate all the factors related to listings on other exchanges. Typically, in high-frequency trading, you can’t "calculate everything," so I call it random correction.
When conducting research, you need to clearly state your hypothesis:
I selected all products listed on Binance (spot market) since January 1, 2022. Why this date? Because I didn’t want to introduce confirmation bias by selecting data from 2020 to 2021, as I already knew the results would clearly lean positive and not represent the current market.
I only included USDT trading pairs.
I only selected products that traded for more than 90 days.
I excluded the first day (which is why all charts start from 0).
Why? Because exchanges handle opening trades differently. Some exchanges "artificially" create an initial order far below fair value just to show a significant rise at listing—this is completely misleading. Some exchanges announce listing news long before or at the time of listing, making it difficult to effectively distinguish the announcement effect.
Excluding the first day makes the analysis clearer and more comparable. Of course, you can propose your own handling method.
After completing the analysis, I obtained the following results:
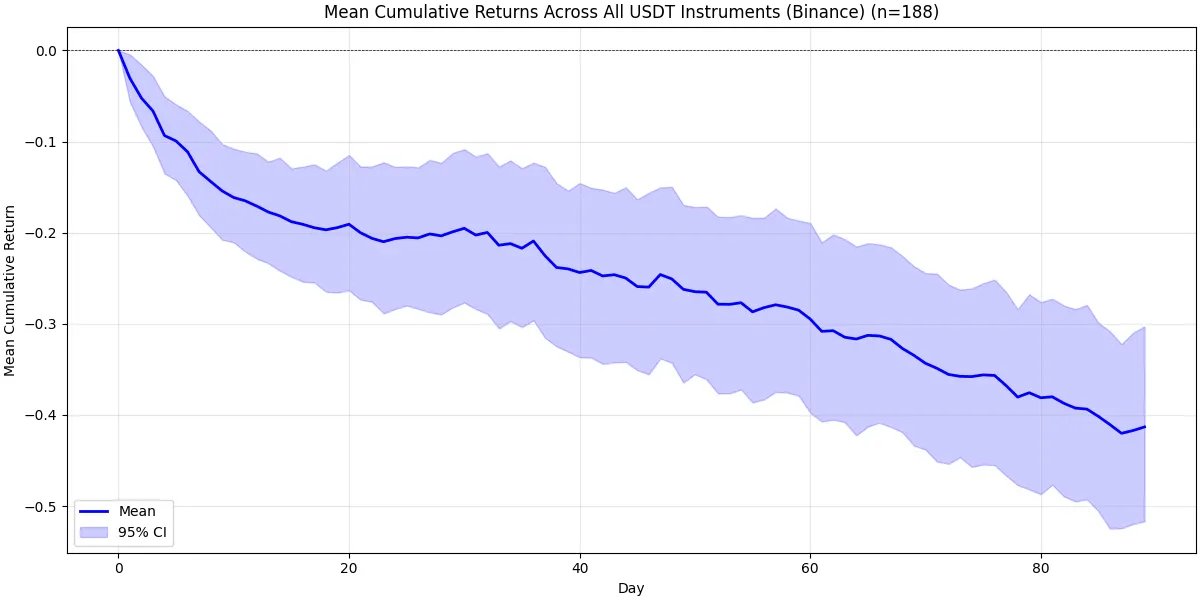
This shows the cumulative returns of all tokens that met my criteria in the first 90 days after being listed on Binance's spot market. What do we see? There was a huge—absolutely huge—selling pressure from the very beginning. A few days later, things stabilized slightly, and then we entered a steady downtrend. Why is this? Partly due to the overall cryptocurrency market trend. On average, tokens tend to fluctuate downwards after listing. Additionally, I selected all tokens listed after January 1, 2022, which was during a bear market, so the overall environment was not very favorable.
Now, let’s talk about my biggest concern—lack of random correction. For me, without random correction, there’s no real research. Even if you show me your last 100 runs with an average of 10.50, I can’t judge unless I see it compared to the overall market. Without a benchmark, there’s no judgment.
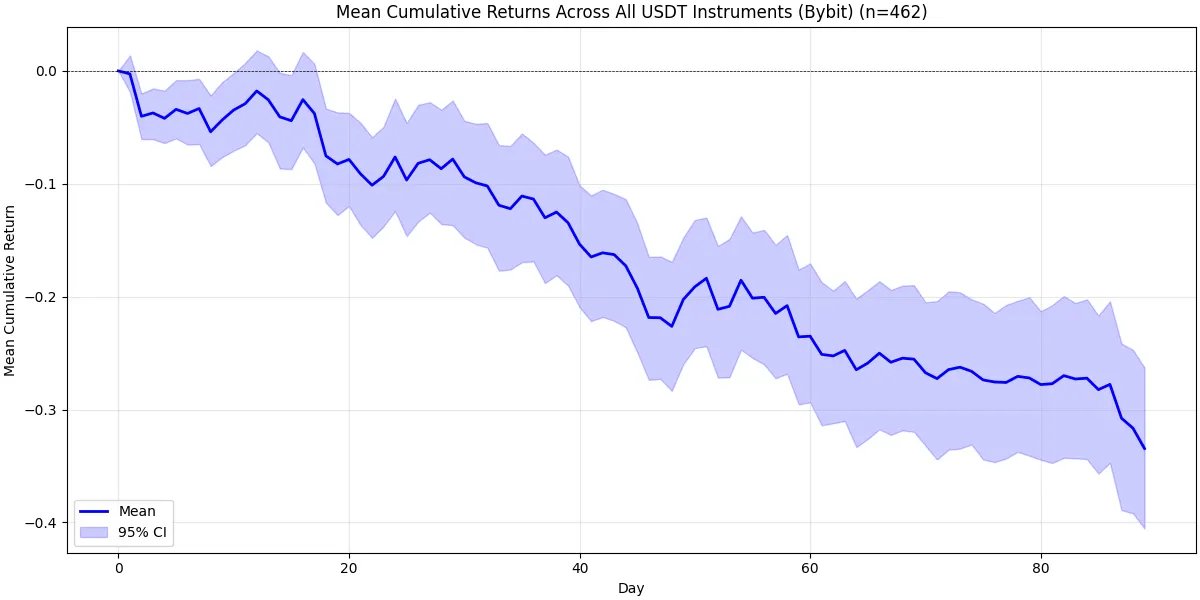
In this case, "the overall market" should refer to other comparable exchanges—such as Coinbase and Bybit. Therefore, to execute this correctly, we need to perform exactly the same calculations for Bybit and Coinbase (under the same conditions). Let’s take a look at the charts below.
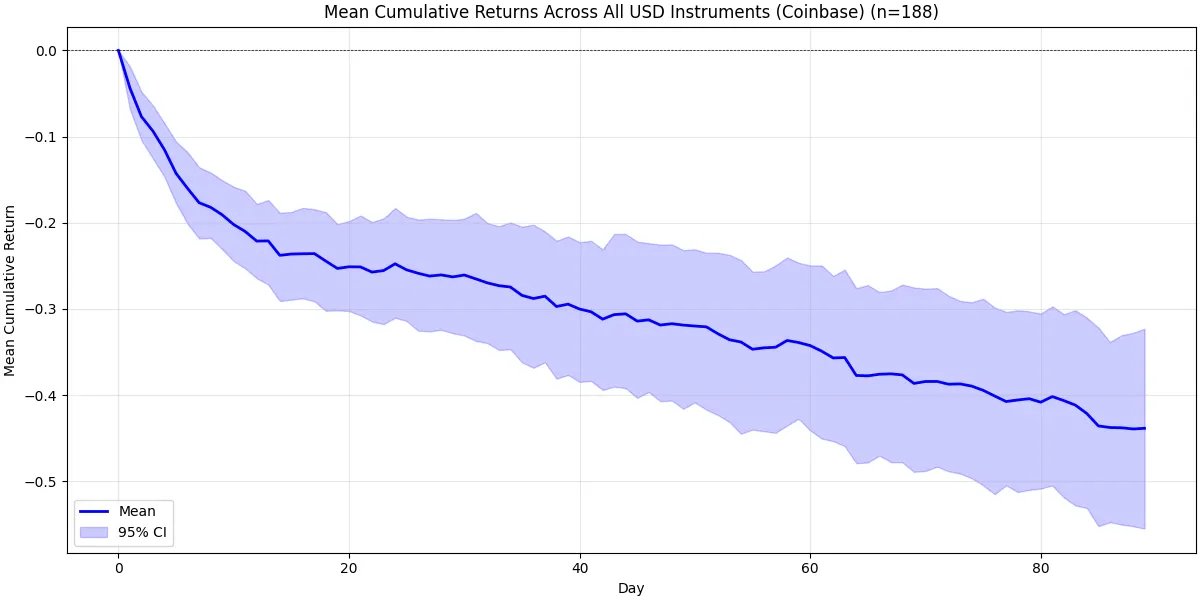
As you can see, the Coinbase chart looks much worse than Binance's. About 20 days after listing, the expected return rate drops to around -25% (and the upper confidence interval is still around -20%!). After that, we again see the same pattern—a brief stabilization followed by a slow downtrend, just like on Binance.
Bybit's situation is slightly different. After 90 days, the expected return still drops significantly, but the initial selling pressure is not as great. Based on the data and intuition, I believe Coinbase is far more comparable to Binance than Bybit.
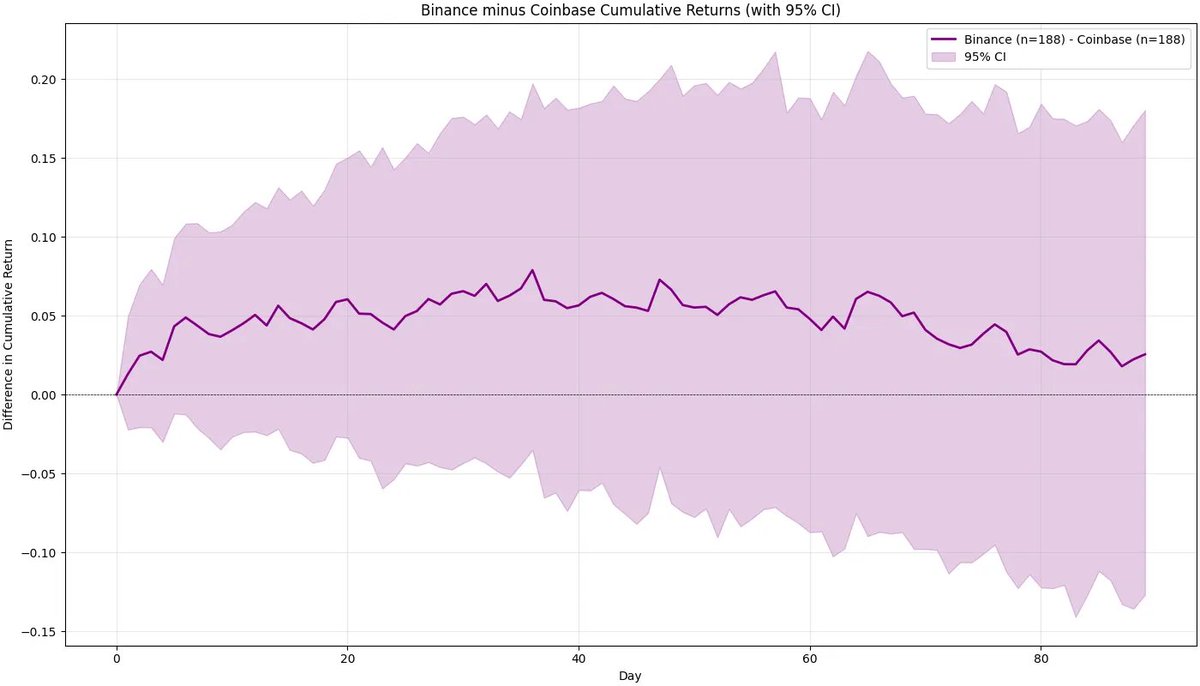
Now, let’s make a real comparison of these exchanges with Binance. To perform random correction, simply subtract the above results from Binance's main analysis. The following chart shows this. Intuitively, what we now get is the net effect of Binance when benchmarked against each exchange (Bybit / Coinbase).
You can clearly see—especially in the case of Coinbase—that Binance's impact is positive, not negative. The selling pressure on Coinbase is much greater than on Binance. Of course, once we consider the confidence interval, this difference is not statistically significant at the 95% confidence level—but the conclusion is still quite clear: the performance of tokens listed on Binance is better than those listed on Coinbase.
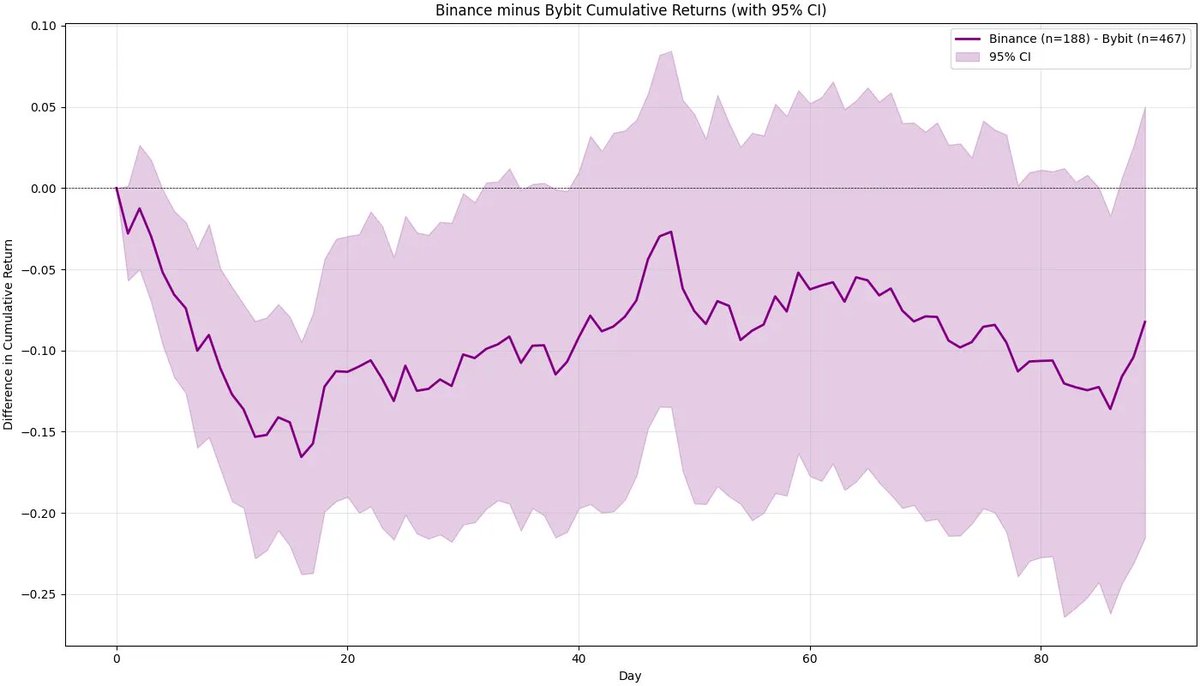
For Bybit, we can see that it performs significantly better in the initial days after listing. However, the difference quickly increases, and while we can say Bybit performs better than Binance in the short term, the effect is not particularly pronounced.
After random correction, we absolutely cannot conclude that Binance is "evil" compared to other exchanges (especially Coinbase), as the performance of projects listed on Coinbase is significantly worse. Now, let’s talk about an important thing—something we haven’t discussed enough.
The Curse of the Ultimate Goal
Imagine you are communicating with a project team that hasn’t launched yet. What would you expect to hear from them? The answer is almost always as follows:
"Our ultimate goal is to be listed on Binance (or Coinbase, Upbit)."
When we talk about the impact of being listed on Binance for a project, this statement is very important. Everyone is waiting for that moment. If you are a major investor or the project founder, and you truly believe you will eventually land on Binance, Coinbase, or Upbit, then what motivation do you have to sell tokens after being listed on Bybit? I think it’s almost zero—except for some operational costs that force you to sell a small portion of tokens.
This is why you see Binance and Coinbase facing significant selling pressure, while Bybit has almost none (Bitget, KuCoin, or Gate may also have none). However, based on our methodology, even after excluding the impact of the announcement day, Binance's listing performance is still better than Coinbase's. Now, I’m sure your question would be:
"What percentage of tokens do you estimate an average large investor or founder would want to sell after the ultimate goal listing?"
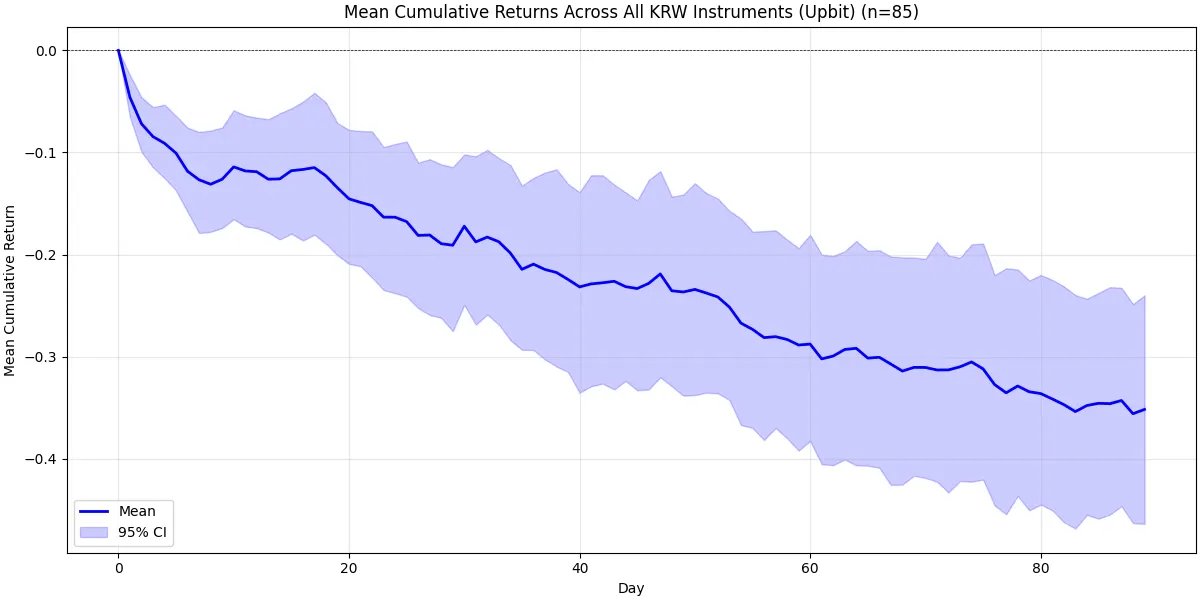
We cannot directly answer this question—there is currently no clear data. But you should at least have an estimate in mind, think through the logic, and then provide a number. I mentioned earlier that Upbit is also an "ultimate goal" exchange, and people like to be listed in Korea. Unfortunately, we still see strong selling pressure after the listing day. For projects, this is almost always a dead end—perhaps not as severe as Binance, but still significant—you can clearly see this in the data. The following chart shows Upbit's performance and the difference between Binance and Upbit.
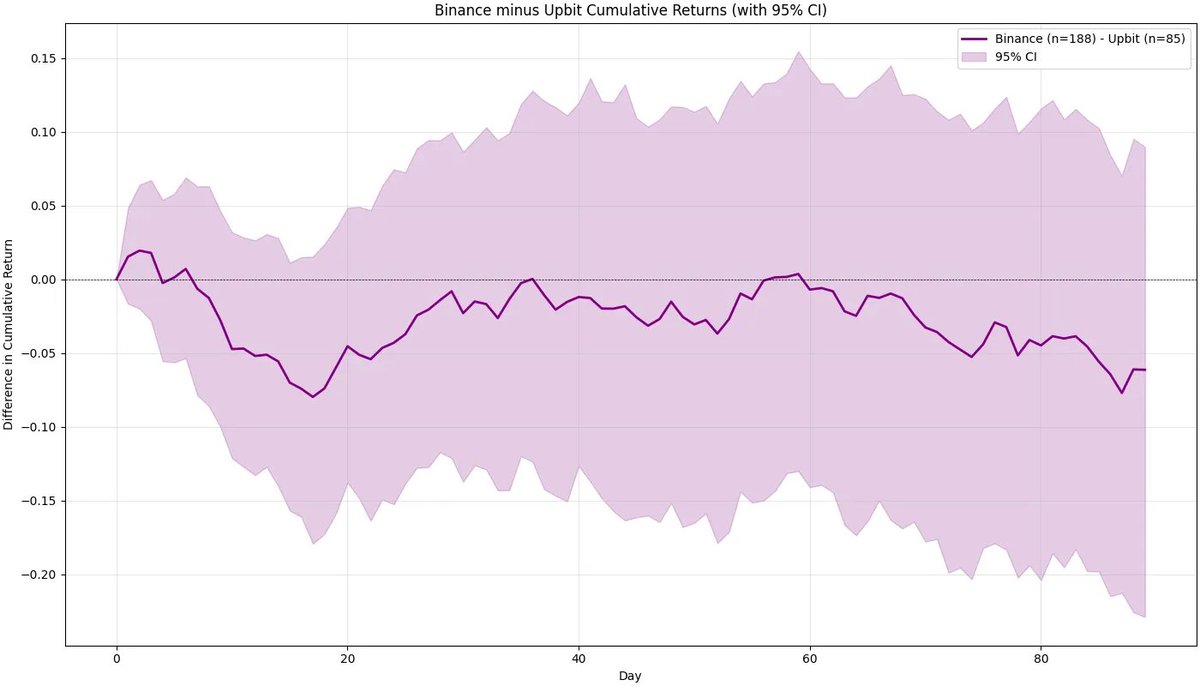
After 90 days, Upbit's performance is slightly better than Binance's, but the difference is so small that we cannot reasonably claim that Upbit is a better listing platform. In both cases, we see strong selling pressure—if you think about it deeply, this is actually completely logical.
How to Price for Liquidity?
There is one thing that almost no one has considered.
After being listed on Binance, liquidity far exceeds that of any other exchange. Binance allows founders and investors to partially close positions as needed or to increase their holdings on a larger scale when they need to buy back (to be honest, I hope this happens often). So how should project teams or investors price this significant increase in liquidity?
This is something that (almost) only Binance can provide—and it is definitely something that every participant in the market should be willing to pay for, directly or indirectly.
We all want deep liquidity and the ability to short or long perpetual contracts (of course, the focus of our analysis here is on spot exchanges, not perpetual contracts, but this is an important feature worth mentioning).
A Simple Way to Test Binance's Liquidity Advantage
I have been thinking of a simple way to test whether Binance's liquidity is truly superior to other exchanges while avoiding significant bias. Here are my thoughts:
Find tokens listed on Bybit and Coinbase.
Find tokens listed on Binance, provided they were listed after being on Bybit and Coinbase (ideally with as long a time gap as possible).
Compare the liquidity of Binance, Bybit, and Coinbase a few days after the tokens are listed on Binance.
In this setup, Bybit and Coinbase have established markets, while Binance is an emerging market. If Binance's liquidity is still significantly better than other platforms, we can confidently say that the liquidity surplus brought by being listed on Binance is real and substantial.
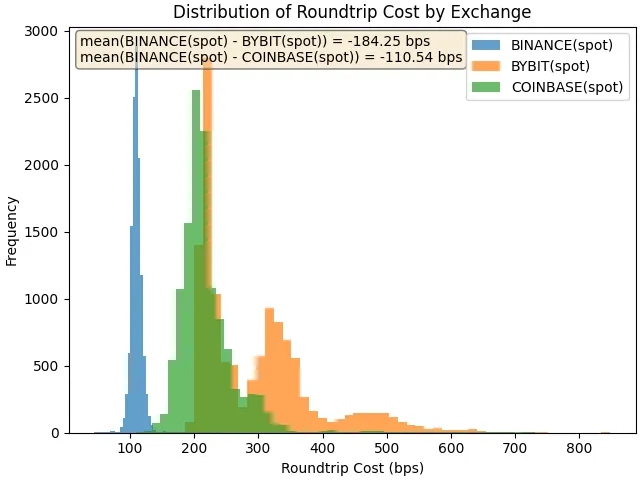
The chart shows the distribution of round-trip costs, i.e., the cost of executing a $100,000 market buy and a $100,000 market sell. The higher the cost, the lower the liquidity. For the token LA, which was listed on Binance more than a month after being listed on Bybit and Coinbase, we found that five days later, the round-trip cost on Binance was 184 basis points lower than Bybit and 110 basis points lower than Coinbase.
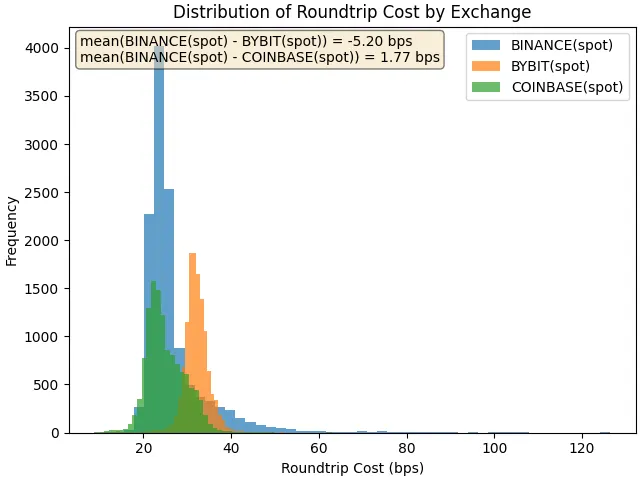
For ONDO, the round-trip costs between Binance and Coinbase are roughly similar—Coinbase has a slight advantage (only 1.77 basis points, possibly due to differences in minimum tick sizes).
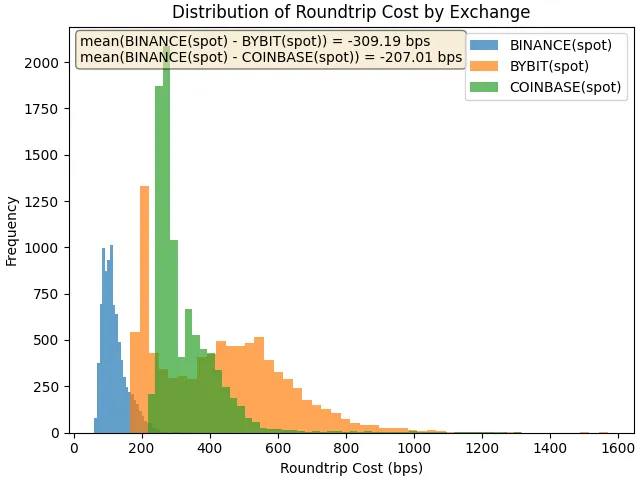
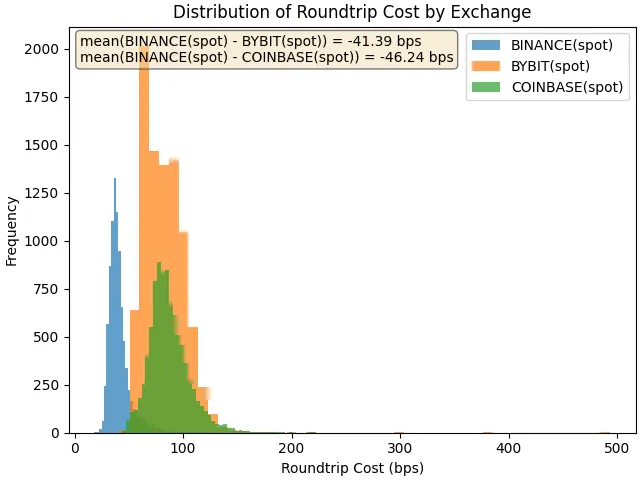
Now let’s look at the product AXL, which has poorer liquidity. Here, the cost differences are enormous. For a $100,000 trade, the cost difference is 309 basis points compared to Bybit and 207 basis points compared to Coinbase. For a $20,000 trade, the cost difference remains 41 basis points and 46 basis points, respectively. These numbers are astonishing from the perspective of any existing or potential holder.
What’s Next?
This is obviously not the only way to research this topic—but it is a biased starting point. If we want to delve deeper, here are some open-ended questions (I won’t answer them now—time is always limited):
How should we incorporate broader market trends and their relationship with listing performance?
How do we quantify the announcement effect and include it in the analysis?
How should we weigh individual cases? Is ONDO more important than AXL? If so, by what metrics (perhaps market cap) should we measure?
Should we make the analysis more robust—e.g., by winsorizing outliers?
Would excluding BSC tokens from the Binance data lead to significant changes in the results?
We could endlessly ask such questions—this is the charm of research.
There is always room for improvement, but ultimately, creativity and research ethics are more important than any specific model. Conducting nearly unbiased research can take you further than any machine learning method. It’s always about your ideas, your data preparation, and your culture of reasoning.
Conclusion
We are not here just to discuss research; we are here to discuss Binance.
Whether you think Binance is "evil" or a "cancer to the industry" is entirely up to you. Please critically examine yourself. Don’t let bias and emotion bind you. Because that’s not where the money is made.
免责声明:本文章仅代表作者个人观点,不代表本平台的立场和观点。本文章仅供信息分享,不构成对任何人的任何投资建议。用户与作者之间的任何争议,与本平台无关。如网页中刊载的文章或图片涉及侵权,请提供相关的权利证明和身份证明发送邮件到support@aicoin.com,本平台相关工作人员将会进行核查。


