Gold and silver prices plummeted sharply from historical highs last night to early this morning, with gold experiencing a significant drop of 6%, marking the largest single-day decline in a decade, while silver fell by 7.1%. Once hailed as the ultimate insurance during turbulent times, these precious metals have unexpectedly become a market alarm bell, forcing investors to reconsider whether the concept of safe-haven assets has been diluted by high leverage and emotional trading.
As traditional safe-haven markets collapse, Bitcoin, regarded as "digital gold," also failed to serve as a refuge. Recently, Bitcoin plummeted from $125,000 to $103,600 in an instant, a decline of over 18%. When gold rises, Bitcoin falls; now that gold is sharply declining, Bitcoin remains stagnant. Based on past experiences, Bitcoin may experience adjustments due to the sentiment in the safe-haven market in the future.
After 10 PM last night, Bitcoin initiated a rapid rebound, peaking around 00:30 today at the take-profit level of approximately $114,000 set by the expert in real trading, reaching a near one-week high. However, just as the market thought the gains were returning, Bitcoin experienced a continuous decline for 8 hours, and as of the time of writing, it was quoted at $108,300, a sharp drop of nearly $6,000, completely erasing last night's gains.
Bitcoin Four-Hour Chart
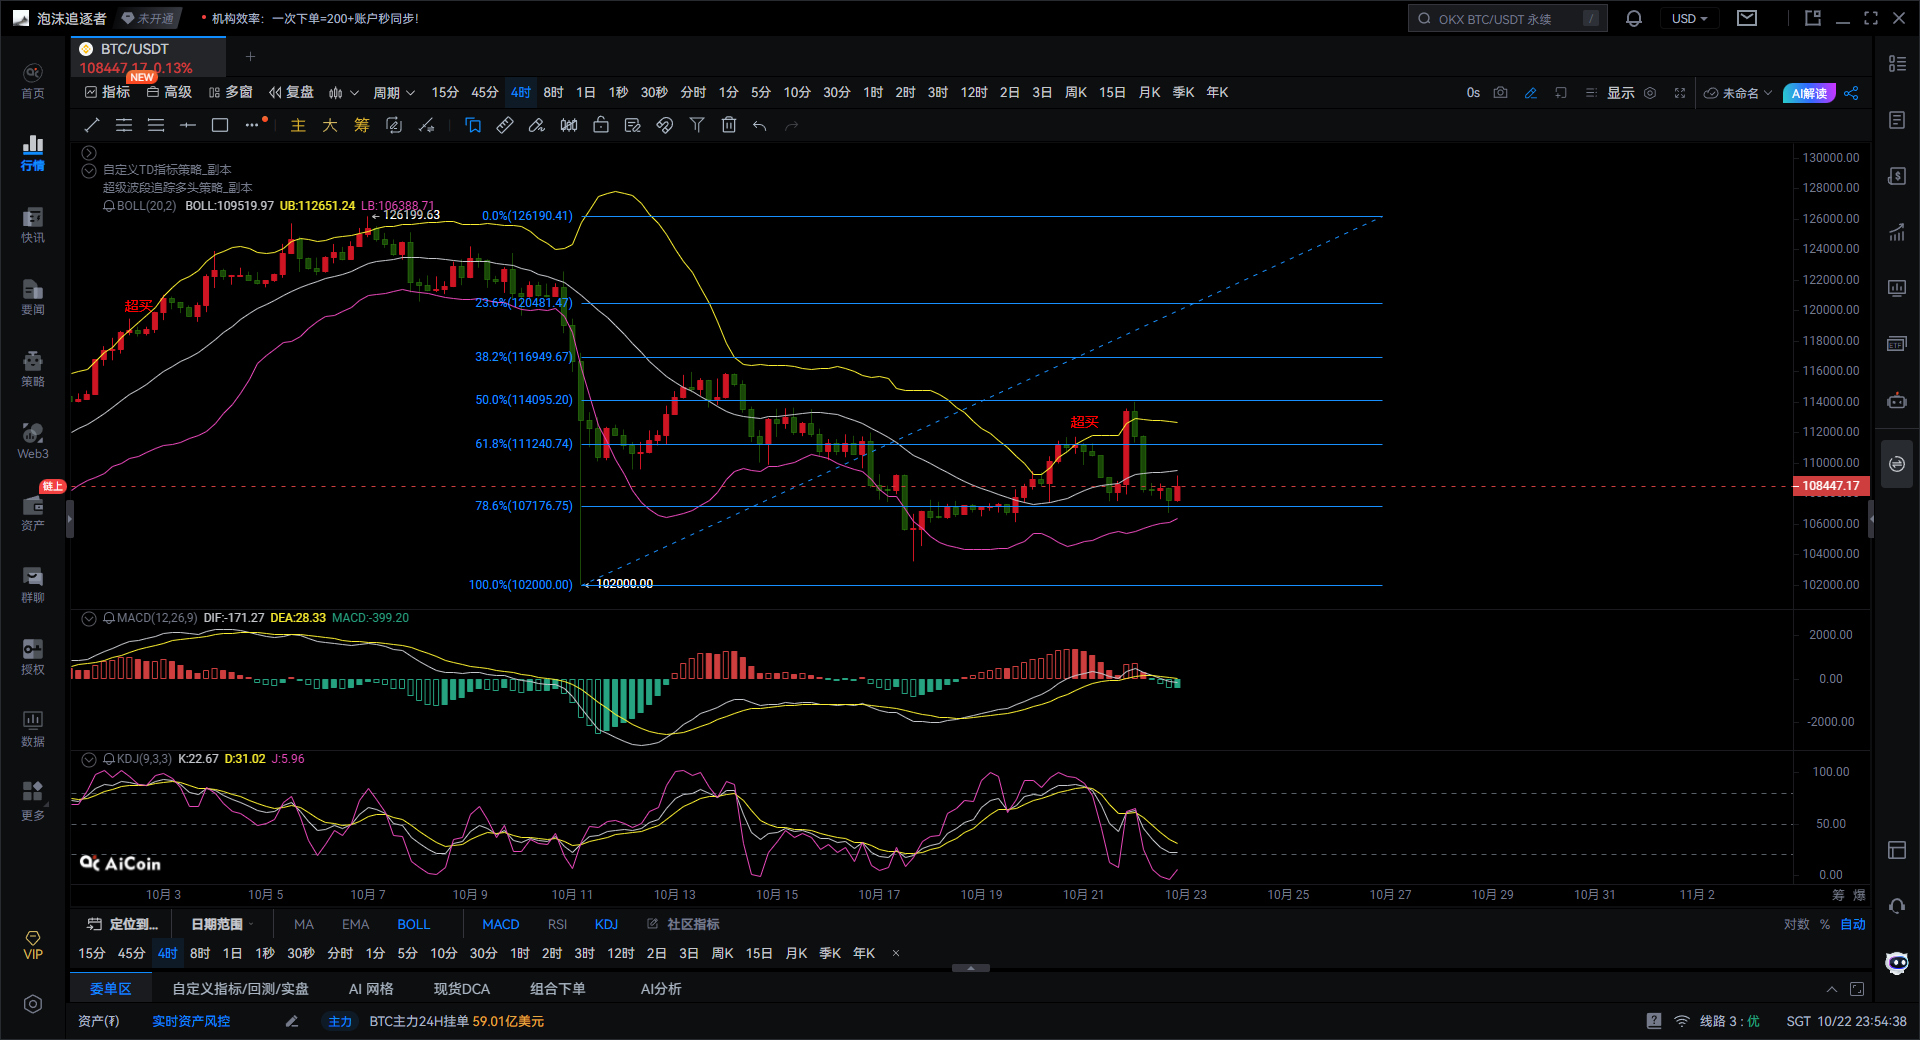
The current Bollinger Bands are narrowing, indicating a decrease in market volatility, with a short-term directional choice approaching. The key mid-band resistance is around $109,519, while the lower band support is relatively solid around $106,000. The price is currently oscillating within the mid-lower band range, indicating that bears are in control but lack sustained downward momentum.
If the price breaks below the lower band support with increased volume, it may further test the low of $102,000. Conversely, if it can stabilize above the mid-band and the Bollinger Bands expand again, a rebound may be initiated, targeting the upper band position of $112,600. At the same time, the upper band and the 38.2% Fibonacci retracement level at $116,500 create dual pressure, making a breakout challenging.
The MACD indicator shows that the DIF line is slightly below the DEA line, forming a death cross state, and the green histogram indicates that short-term rebound momentum is weakening. The golden cross rebound from mid-October has been exhausted; if a new death cross appears along with the expansion of the green histogram, the price may continue to decline. However, if it can stabilize above $108,000, a new golden cross signal may form.
The current KDJ three-line values are K line at 22.67, D line at 31.02, and J line at 5.96, clearly in the oversold area, indicating that short-term downward momentum is sufficient, and a rebound correction may occur at any time.
Recently, the KDJ entered the overbought zone around October 20, quickly forming a death cross downward, leading to a short-term price retreat. At this time, the J line value is deeply dulled at a low level; if the three lines form a new golden cross and the K line value crosses above the D line value, it can be seen as a signal for a phase rebound. Therefore, from the KDJ perspective, there is a demand for a short-term rebound, but it still needs confirmation from the MACD; otherwise, the rebound height will be limited.
The price is currently oscillating within the Fibonacci 61.8%-78.6% retracement range, which is an important support area. Holding the range of $107,000-$108,000 may trigger a rebound to test the 50% retracement level at $114,000; if it breaks below, it may test the low of $102,000.
In summary, the Bitcoin four-hour chart shows that short-term downward momentum is weakening, and a rebound is brewing, but the medium-term trend remains bearish. $108,000 has become a key dividing line between bulls and bears; a breakout may extend the rebound, while a failure to hold may restart the downward trend. It is recommended to closely monitor the performance of the $107,000-$108,000 support area and the resistance effect of the Bollinger Bands mid-band.
Based on the above, the expert provides the following suggestions for reference:
Position to go long on Bitcoin within the range of $107,000-$108,000, targeting $111,240-$112,500, with a stop loss below $107,000.
Giving you a 100% accurate suggestion is not as good as providing you with the right mindset and trend; teaching someone to fish is better than giving them fish. It is suggested to earn for a moment, but learning the mindset will allow you to earn for a lifetime!
Writing time: (2025-10-22, 23:50)

(Written by - Expert on Cryptocurrency) Disclaimer: Online publication has delays; the above suggestions are for reference only. Investment carries risks; proceed with caution!
免责声明:本文章仅代表作者个人观点,不代表本平台的立场和观点。本文章仅供信息分享,不构成对任何人的任何投资建议。用户与作者之间的任何争议,与本平台无关。如网页中刊载的文章或图片涉及侵权,请提供相关的权利证明和身份证明发送邮件到support@aicoin.com,本平台相关工作人员将会进行核查。


