Master Discusses Hot Topics:
In the past 24 hours, the market's direction has completely changed. Global risk assets have surged across the board, with all three major U.S. stock indices rising, and Bitcoin also took off during the day yesterday. The VIX plummeted over 10% in a single large bearish candle, directly signaling a retreat from panic.
Market sentiment has completely flipped bullish, with funds flowing back into risk assets and risk appetite significantly warming. This rebound is not just a random surge; it is a signal of improving liquidity. The simultaneous rise of Bitcoin and gold indicates that the market is not in a panic mode but is clearly betting on the Federal Reserve's interest rates peaking.
The increase in turnover rate is also expected, with URPD data remaining stable, and no one is in a hurry to sell off. The current core logic revolves around the trade and interest rate cut expectations between the U.S. and us. As long as these two main lines do not collapse, the market's foundation will remain stable in the short term.
Returning to the market, the performance is still frustrating. Bitcoin fell slightly deeper last night compared to the night before, but Ethereum and SOL are not following suit, and altcoins are each moving independently. Looking at the positions in hand, some coins are simply behaving like air coins, which is awkward.
Today is already the 21st, and the logic for speculation is clear: good news is speculated on expectations, not on actual outcomes. There will be no movement before the interest rate cut, and don’t expect any major waves after the cut is implemented. Moreover, don’t forget that Japan might raise interest rates at the end of the month; the last time was nearly nine months ago, and if they really turn hawkish this time, it could lead to a complete repricing.
Last week, Bitcoin's weekly chart was actually quite strong. I mentioned last year that this asset has long since detached from the traditional four-year cycle framework. Volatility is decreasing, and Bitcoin's movement is increasingly resembling that of leading tech stocks in the U.S. market.
The significant drop from February to April 2025 has already proven its resilience, even stronger than NVDA. Currently, on a smaller scale, the rebound from 103.5K has not produced a decent impulse wave, and the pattern is almost identical to that from March to August 2024.
If the market needs to adjust, it must give space if not time. From the peak to now, it hasn't even reached a 20% retracement, which is still considered a healthy rhythm; in this major trend, a retracement within 30% is a normal fluctuation.
Last night, U.S. stocks closed higher, but the Bitcoin market did not follow suit because it had already surged in advance over the weekend. The rebound during the day yesterday, at the 4 to 12-hour level, has completed its pullback, and now the market has returned to a phase of observing the strength of smaller time frames.
The structure in the next 30 minutes will determine the short-term direction, while the daily pullback target is the resistance zone above BTC at 112 to 114K. Until it breaks through, don’t chase long positions. There are no reversal signals yet; chasing long positions now is just giving away money. The only strategy is to buy low and sell high, engaging in short-term guerrilla tactics.
The lifeline for bulls is at the 4-hour BOLL middle track at 108.6K. If it falls below this, the rebound ends, and the market will switch back to a bearish rhythm. Conversely, as long as the range between 108.6K and 108.2K holds, bulls can still hold on for another wave.
As for Ethereum, the high and low points from August 2 to 14 are critical zones. Although there was a new high on August 24, it did not hold, indicating insufficient upward momentum. Since then, it has been oscillating downward; on the surface, it appears to be consolidating, but in reality, it is in a downtrend.
Currently, Ethereum's daily trend is still in a downward structure. As long as the range between 4300 and 4100 does not break, the probability of moving downward is greater. The key support is at 3360; if it fails to hold, the next stop will be 2800. Conversely, if it holds, it will continue to oscillate, and breaking it would signify a clear bull-bear divide.
In the short term, it is oscillating repeatedly between 3640 and 4220. After dipping to the lower end of the range over the weekend, it rebounded and is currently around 4100, which is right at the key daily level. As long as 3890 breaks, the liquidity below will be cleared, and the lower range will undoubtedly be tested.
Master Looks at Trends:
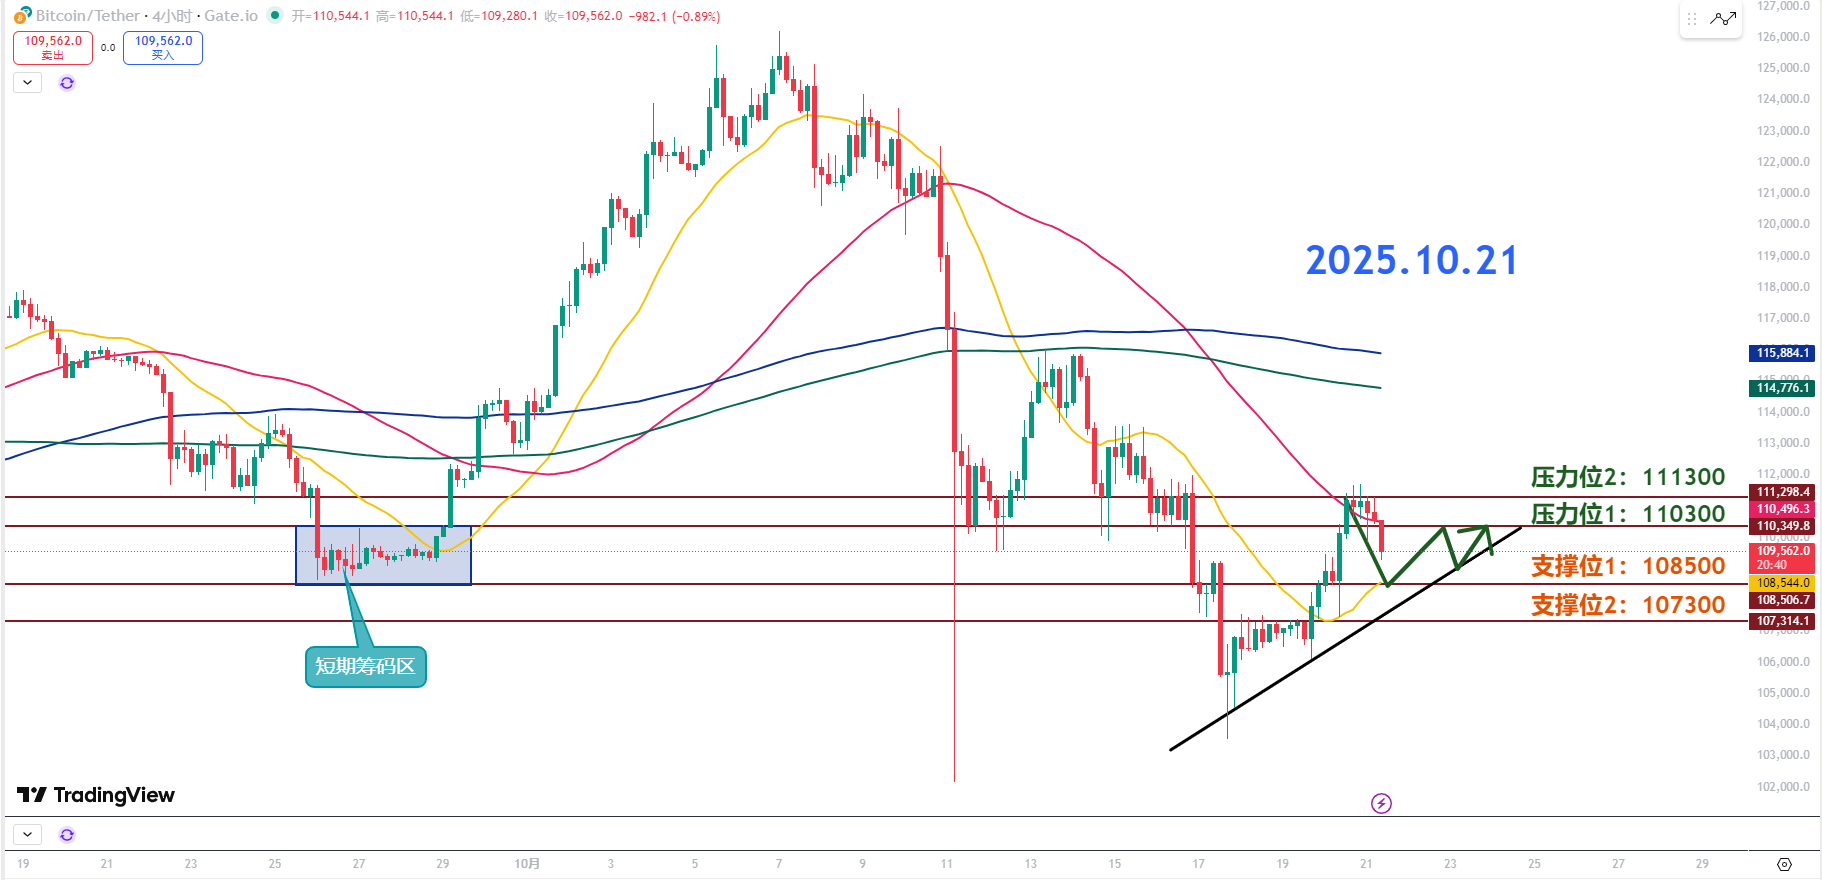
Resistance Level Reference:
Second Resistance Level: 111300
First Resistance Level: 110300
Support Level Reference:
First Support Level: 118500
Second Support Level: 107300
Bitcoin has failed to stabilize above 111K and has been pushed back down, re-entering a bearish range. Currently, there are no obvious signs of capital entering the market, and market sentiment is cautious. This week, there is also CPI data to be released, and most funds are on the sidelines.
From a structural perspective, Bitcoin has returned to the previous short-term accumulation zone, which is in a phase of retesting for confirmation. What needs to be focused on now is whether the short-term upward trend line can hold the low points during this adjustment and rebound along the trend line.
The 20MA remains a key line; as long as it does not fall below 108.5K, this adjustment is still considered healthy. Once it breaks, the downward trend will take over completely.
Overall, this rebound has limited space, and the depth of adjustment is heavier. It is expected to move sideways afterward, and short-term operations should focus on the box oscillation between 108.5K and 110.3K.
The first resistance at 110.3K, which should have been maintained as support, has now been broken and turned into resistance. To reopen the upward space, it must reclaim and stabilize above this level. Currently, it is in a short-term downward trend, and it is crucial to monitor whether there are structural signals of higher lows in smaller cycles.
The second resistance at 111.3K is a strong pressure zone. To push up to 113 to 115K, it must break through and stabilize above 111K; otherwise, no upward movement can be expected. In the short term, especially before the data release on Thursday and Friday, the probability of maintaining a box oscillation is greater.
The first support at 108.5K is currently the most critical short-term support, coinciding with the lower edge of the previous box and the 20MA. If it holds, the logic for a rebound can still be valid. If it is broken, caution is needed for a potential continuation of the N-shaped decline.
The second support at 107.3K was originally a resistance level, which later became support after breaking through, and it is now an important defense line. If this level is also broken, the short-term bulls will be directly finished, and the market will open up new downward space.
However, this is also a high-risk, high-reward zone. In the short term, one can bet on a short rebound, but strict stop-loss controls are necessary. For short-term operations, first focus on the support, then wait for low-cycle rebound signals.
10.21 Master’s Band Strategy:
Long Entry Reference: Not currently applicable
Short Entry Reference: Short in the 110500-111300 range in batches, Target: 108500-107300
If you truly want to learn something from a blogger, you need to keep following them, rather than making hasty conclusions after just a few market observations. This market is filled with performative players; today they screenshot long positions, and tomorrow they summarize short positions, making it seem like they "always catch the top and bottom," but in reality, it’s all hindsight. A truly worthy blogger will have a trading logic that is consistent, coherent, and withstands scrutiny, rather than jumping in only when the market moves. Don’t be blinded by flashy data and out-of-context screenshots; long-term observation and deep understanding are necessary to discern who is a thinker and who is a dreamer!
This content is exclusively planned and published by Master Chen (public account: Coin God Master Chen). For more real-time investment strategies, solutions, spot trading, short, medium, and long-term contract trading techniques, operational skills, and knowledge about candlesticks, you can join Master Chen for learning and communication. A free experience group for fans and community live broadcasts are now available!

Warm reminder: This article is only written by Master Chen on the official public account (as shown above). Other advertisements at the end of the article and in the comments section are unrelated to the author! Please be cautious in distinguishing between true and false, and thank you for reading.
免责声明:本文章仅代表作者个人观点,不代表本平台的立场和观点。本文章仅供信息分享,不构成对任何人的任何投资建议。用户与作者之间的任何争议,与本平台无关。如网页中刊载的文章或图片涉及侵权,请提供相关的权利证明和身份证明发送邮件到support@aicoin.com,本平台相关工作人员将会进行核查。


