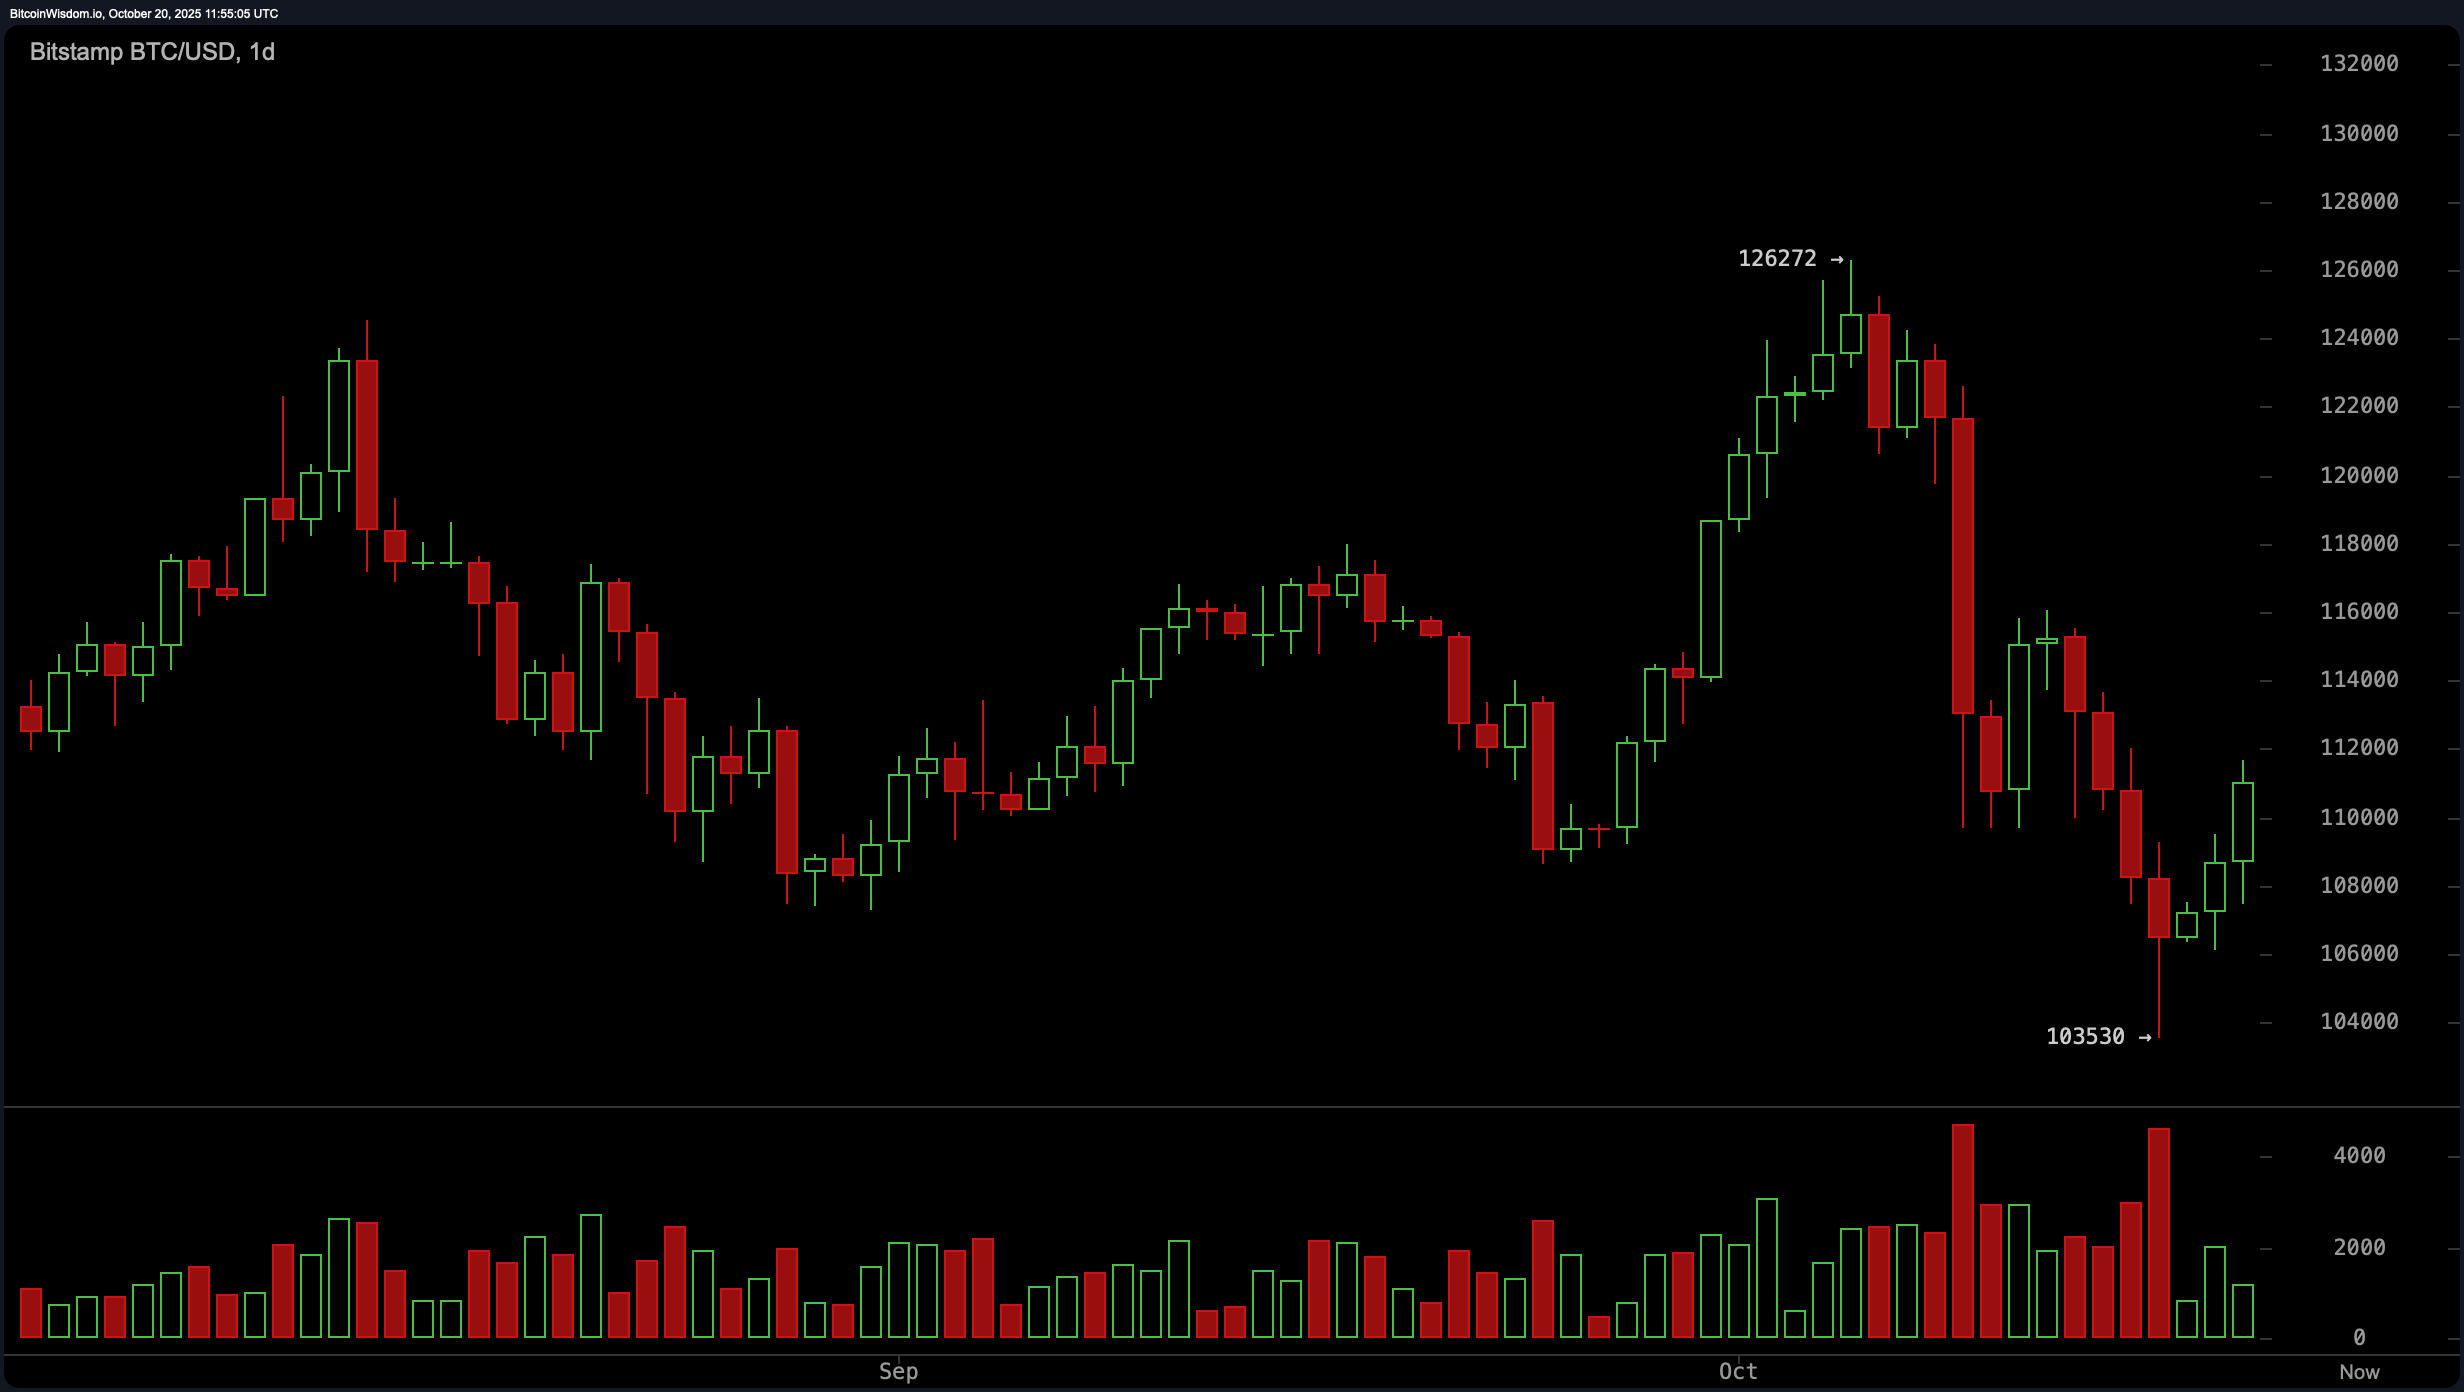
If the daily chart had a mood, it would be cautiously optimistic. After plummeting from a dramatic rejection at $126,000 to a sharp bounce at the $103,530 level, bitcoin is waltzing near the $111,000 mark like it owns the dancefloor. That bounce wasn’t just a fluke—it came with volume that screamed capitulation. The trend is currently short-term bullish, but don’t get too cozy. A close above $112,000 could open the door to the $118,000 zone, but fall below $106,000 and this bullish façade falls apart faster than a poorly coded memecoin.

BTC/USD 1-day chart via Bitstamp on Oct. 20, 2025.
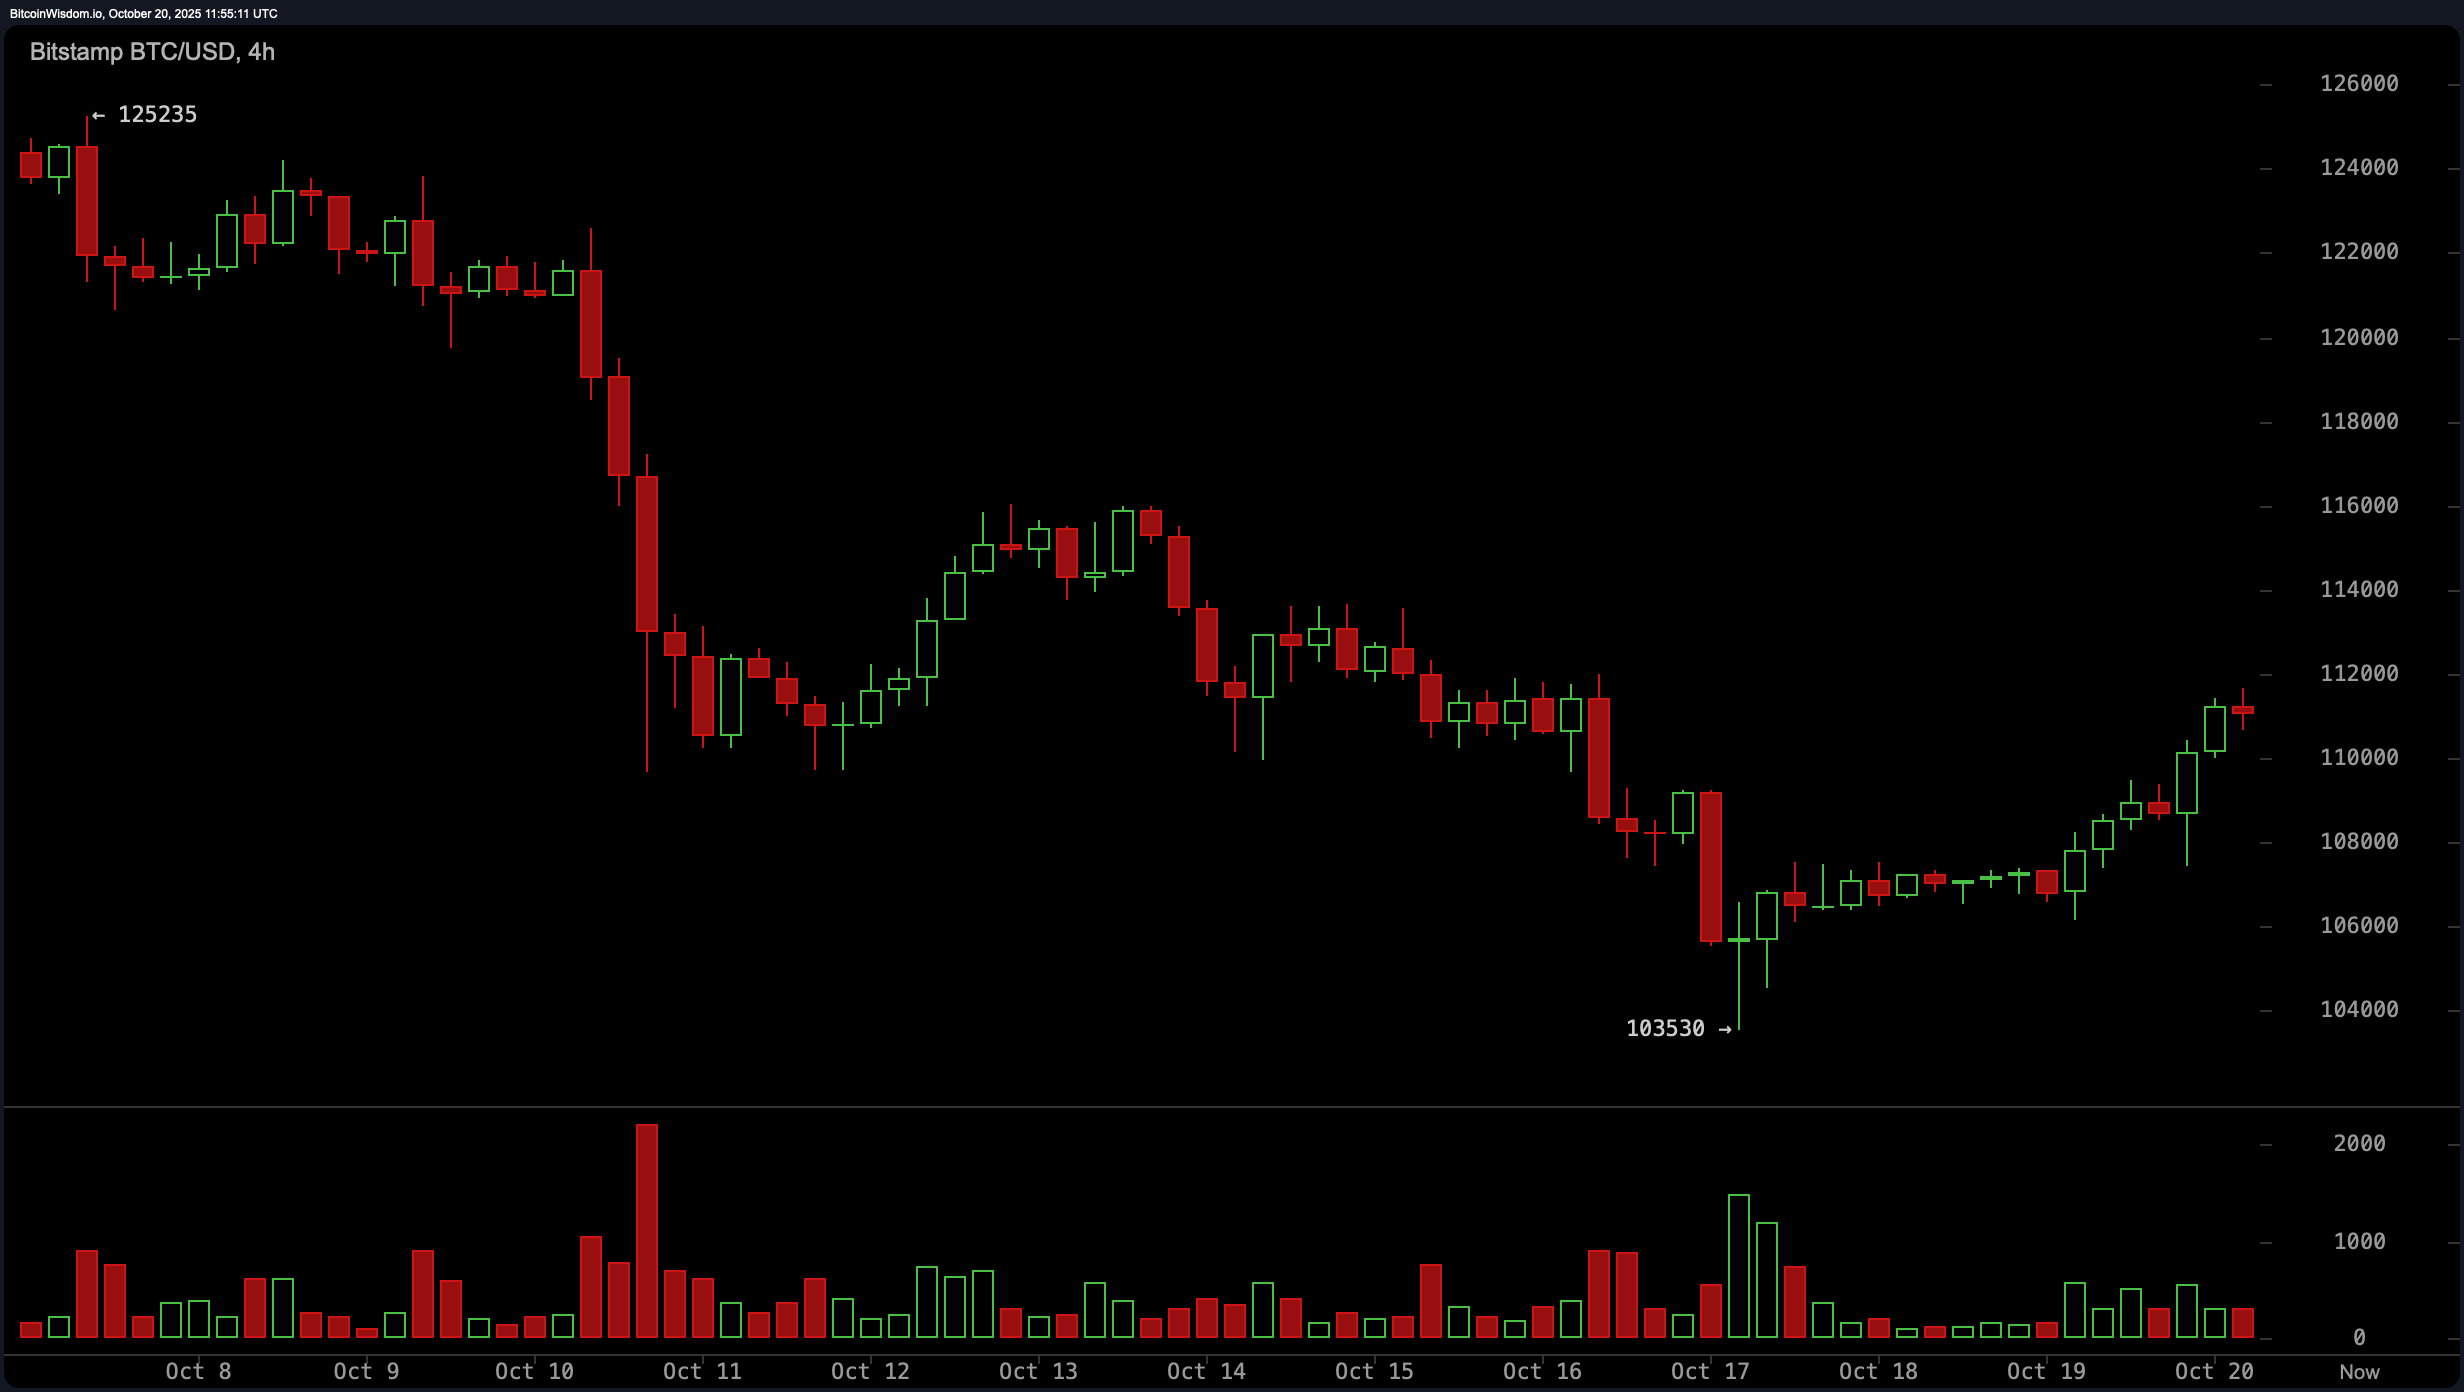
On the 4-hour chart, bitcoin is showing the finesse of a comeback tour. The asset is recovering in a stair-step pattern after breaking out of a falling wedge—a classic bullish setup, mind you. With support at $103,530 firmly battle-tested and resistance looming just under $113,000, the stage is set. Price consolidation around $111,000 with tapering volume suggests that bitcoin might be holding its breath before the next move. If it reclaims $112,000 with conviction and a volume assist, the next ticket punches toward $116,000–$118,000.

BTC/USD 4-hour chart via Bitstamp on Oct. 20, 2025.
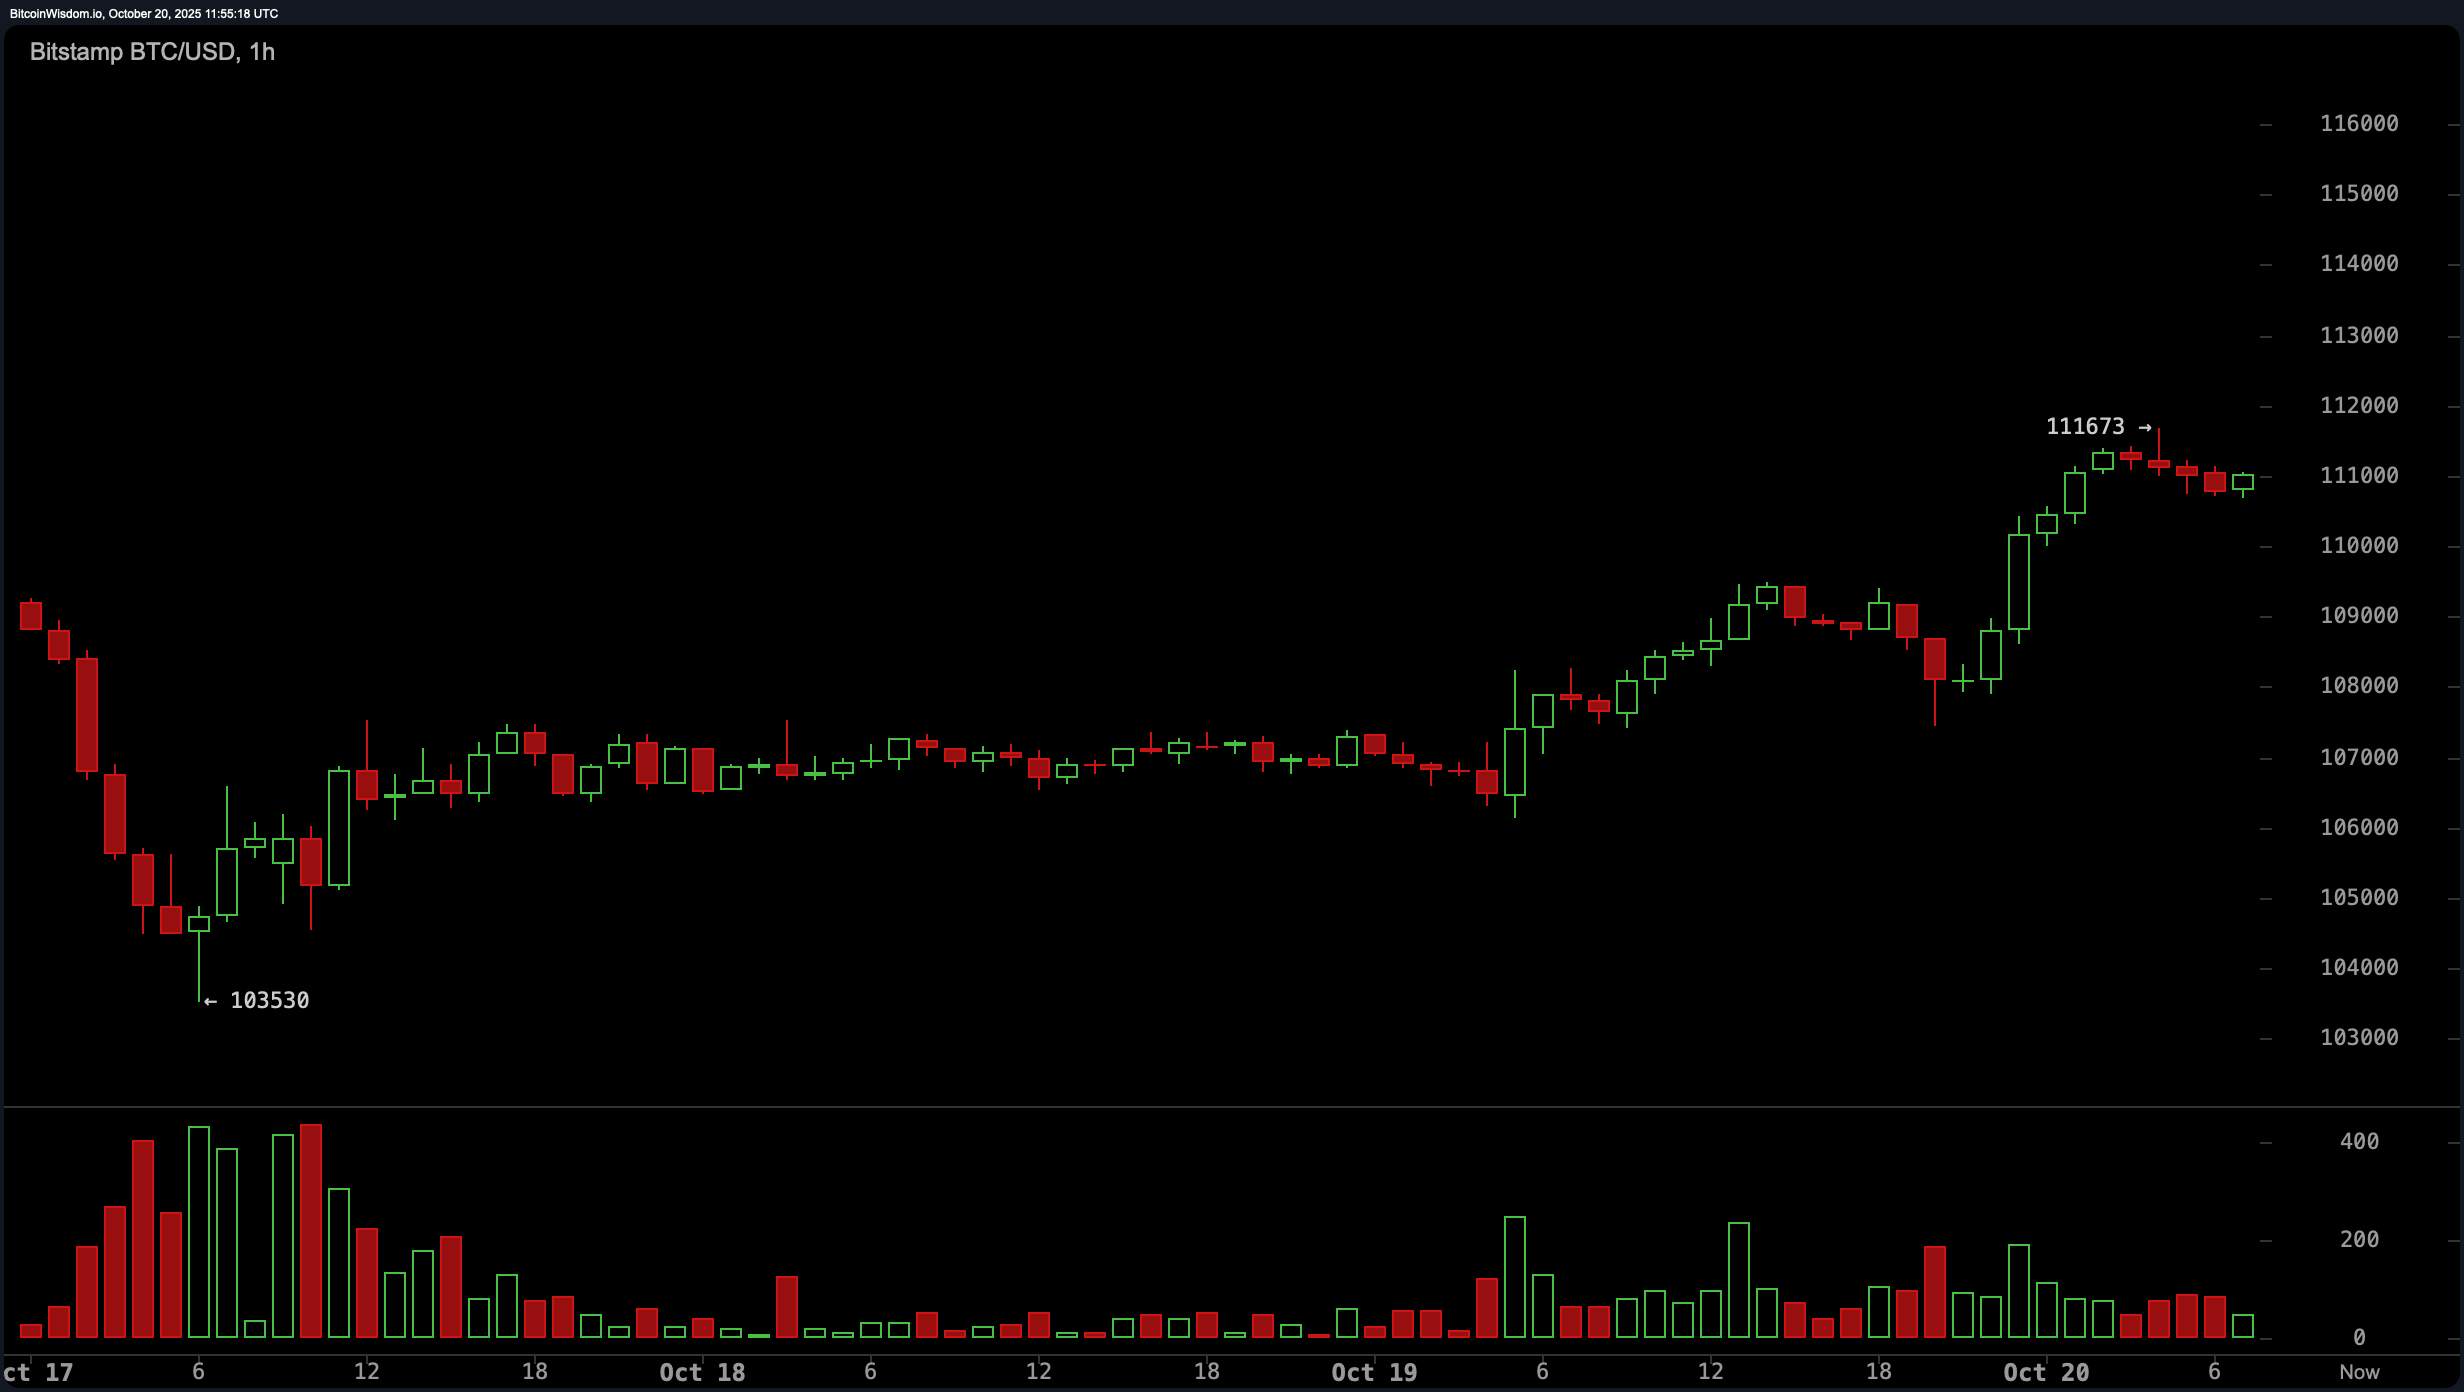
Intraday movements are telling a more neutral tale with a slight bullish undertone. The hourly chart shows a slow grind upward, but the $112,000 resistance is proving as stubborn as a maximalist at an altcoin convention. The key here is momentum: higher lows, green candle volume spikes, and a solid $108,000 support base. Traders looking for action should wait for a breakout above $112,000 or a retreat to $108,000 for a potentially more favorable re-entry.

BTC/USD 1-hour chart via Bitstamp on Oct. 20, 2025.
The oscillators are whispering “standby” rather than shouting directives. The relative strength index (RSI) sits at 45—perfectly noncommittal. The stochastic oscillator is lounging at 24, and the commodity channel index (CCI) is sulking in neutral territory at -71. The average directional index (ADX) holds at 27, indicating an indecisive trend. Meanwhile, the awesome oscillator is in negative terrain at -6,726. Momentum is one of the few indicators flashing a green light at -1,970, while the moving average convergence divergence (MACD) level is less enthused, posting a bearish signal at -1,925.
Moving averages (MAs) are throwing a mixed bag of signals, as if they can’t quite agree on dinner plans. The 10-period simple moving average (SMA) is slightly bullish at $110,663, while the 10-period exponential moving average (EMA) is tipping bearish at $111,086. Beyond that, it’s a sea of bearish signals—both 20, 30, 50, and 100-period EMAs and SMAs are signaling downside pressure. However, the 200-period EMAs and SMAs stand as the bulls’ last defense, firmly below current price at $108,104 and $107,909, respectively, offering a solid line in the sand for deeper pullbacks.
Bull Verdict:
Bitcoin is staging a comeback with the grace of a seasoned performer. With a strong bounce off $103,530, higher lows forming on multiple timeframes, and volume spikes that suggest accumulation rather than exit, momentum appears to favor upward continuation—if and only if the $112,000 ceiling cracks. A confirmed break above that level could send bitcoin toward the $116,000–$118,000 range, turning the current stall into launch prep.
Bear Verdict:
Despite bitcoin’s recovery attempts, the broader structure is still under pressure. Nearly every major moving average above the 10-period simple average is leaning south, and key oscillators like the moving average convergence divergence (MACD) and awesome oscillator are flashing red. Resistance at $112,000 has teeth, and without a definitive break above, the setup risks slipping back toward the $106,000–$108,000 region, potentially unraveling the short-term bullish case.
- What is bitcoin’s current price range?
bitcoin is trading between $110,803 and $111,057 in the last hour. - What’s the key resistance level for bitcoin today?
The $112,000 mark is the critical resistance bitcoin must clear. - Is bitcoin showing bullish or bearish signals now?
Technical indicators show mixed signals with short-term bullish momentum. - What’s bitcoin’s intraday low and high today?
bitcoin’s 24-hour range spans from $107,453 to $111,374.
免责声明:本文章仅代表作者个人观点,不代表本平台的立场和观点。本文章仅供信息分享,不构成对任何人的任何投资建议。用户与作者之间的任何争议,与本平台无关。如网页中刊载的文章或图片涉及侵权,请提供相关的权利证明和身份证明发送邮件到support@aicoin.com,本平台相关工作人员将会进行核查。


