
Since the spike on the 11th, Bitcoin has rebounded upwards for two days, followed by a continuous decline. We have also reminded to wait for the opportunity to test the spike again. However, it currently looks like the lowest point reached was 103528, and it still has not made an effective second rebound. The price has touched the rising support line since 15400, which has been tested multiple times in 2024 and early 2025; additionally, the daily price has fallen below the MA200. If the bottom of the spike on the 11th is broken again, there is a chance it could drop to around 95000, which would be a retest of the weekly MA60.
The weekly MACD's bottom divergence has failed and continues to stay below the zero axis, so the risk remains high in the short term. 100,000 is the dividing line for veteran investors regarding Bitcoin's bull and bear markets; if it falls below this level, it may exacerbate market panic.
Ethereum's weekly chart is below the previously formed double bearish and single bullish candlestick. When the closing line formed this pattern last week, I reminded that short-term risks were increasing. The current MACD histogram has returned to the zero axis, with the fast and slow lines crossing. Although there is an expectation of a short-term rebound, the subsequent trend still leans bearish.
In the U.S. stock market, all three major indices closed with doji stars, forming an inside bar pattern within the previous week's bearish candlestick. This situation requires caution for a trend reversal. Typically, such patterns at high levels are often signals for a decline, and we need to observe the actual trend next week.
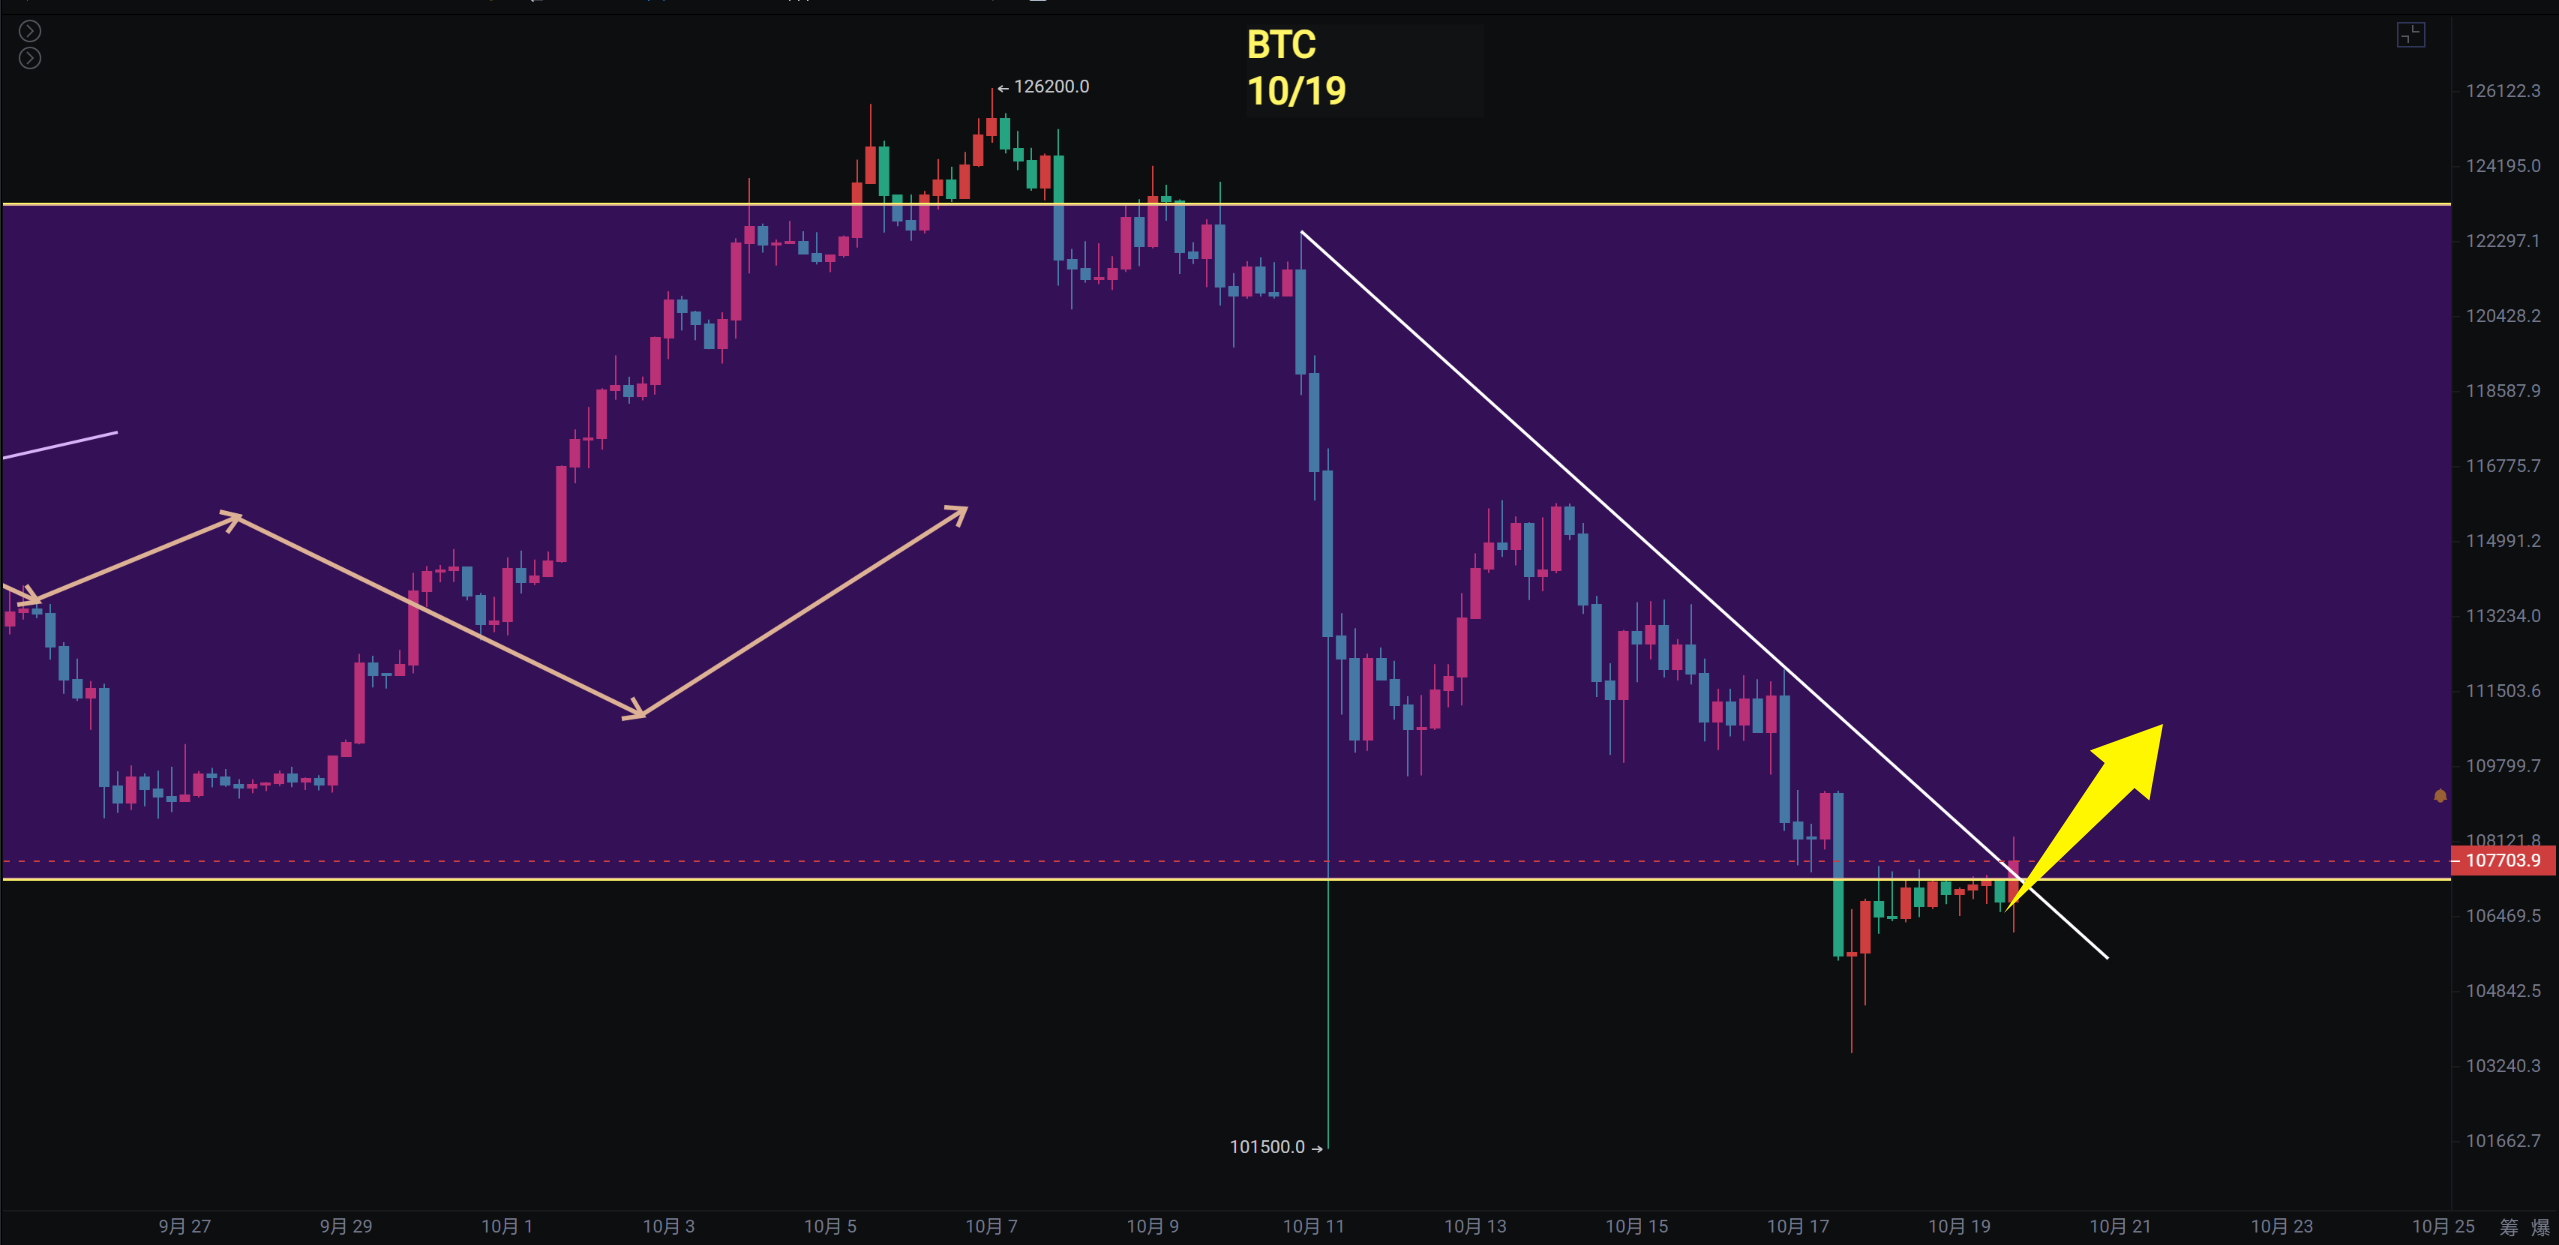
Bitcoin
After the second test spike near 103500, Bitcoin has rebounded but has now fallen below the previous bottom of 107200, indicating a short-term demand for a rebound. The decline on the 11th and the second test on the 17th both had increased volume, but the subsequent rebound is expected to be limited.
Both the daily and weekly charts are facing the test of the rising support line since the end of 2022. Some friends have mentioned the Vegas channel support; the current price has fallen below the 144 and 169 channels, with a certain distance remaining from the 576 and 676 channels. The current trend is more consistent with the characteristics of retesting the 288 and 338 channels. This indicator is used infrequently, so it is uncertain whether it is standard, but in 2024, April 2025, and the current trend, there have been instances of retesting this support.
● Support: 100000—103500

● Resistance: 116000—118600
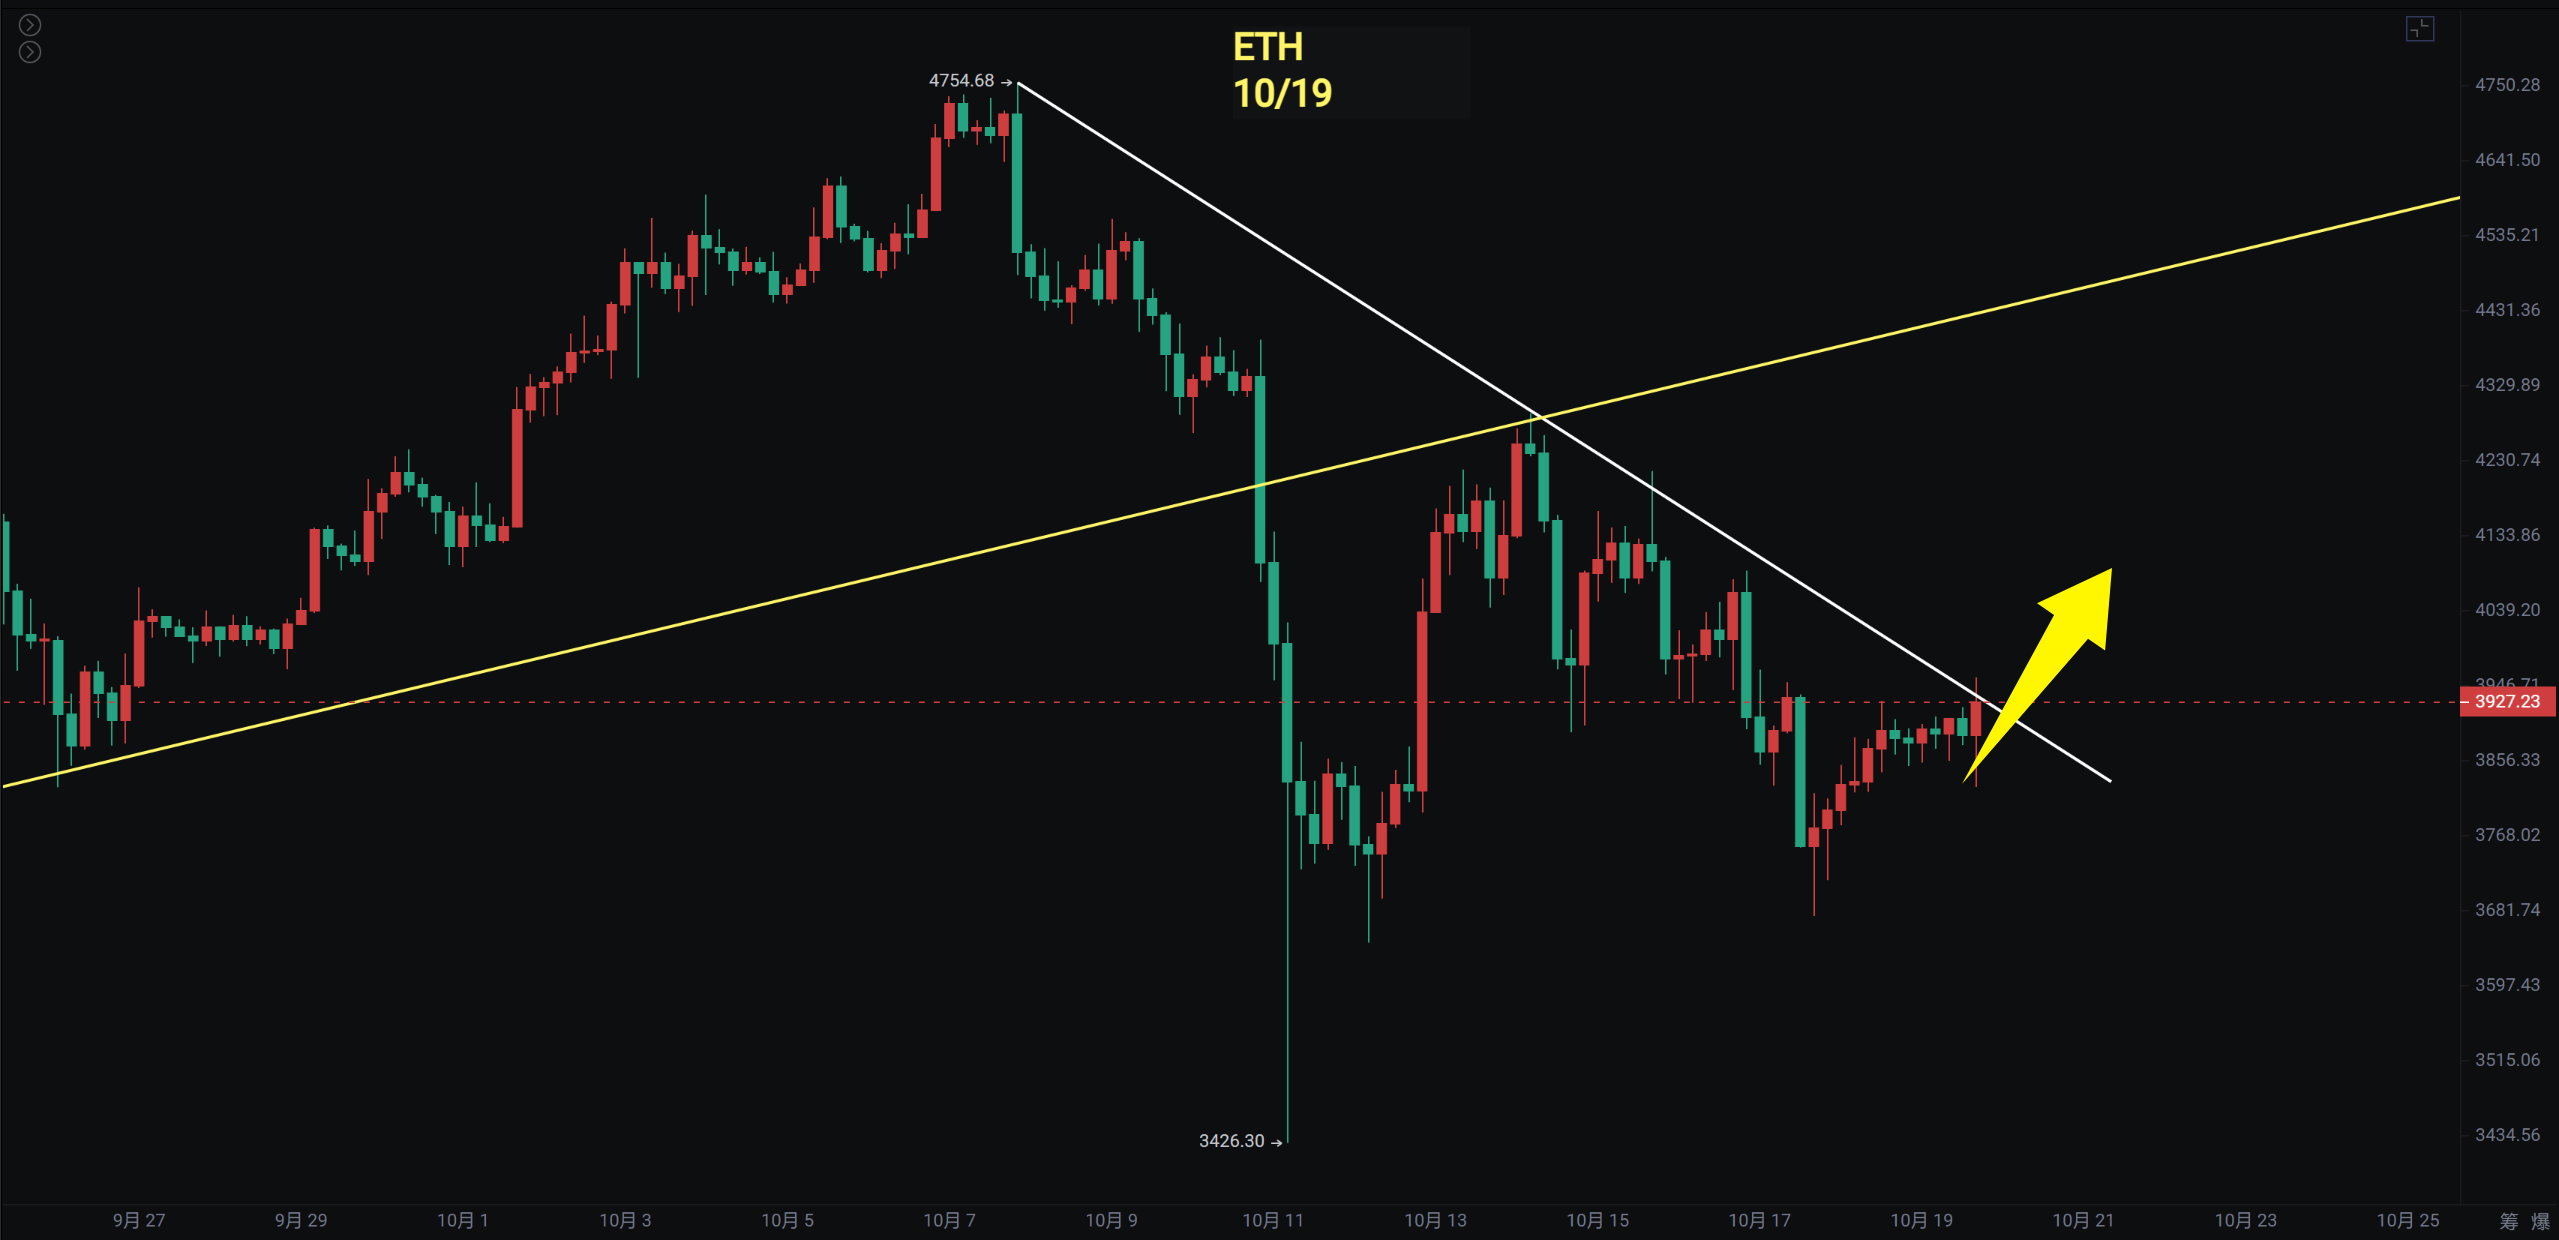
Ethereum
After two months of high-level fluctuations, Ethereum has chosen to break downwards, with the weekly chart showing a double bearish and single bullish candlestick pattern. This week, it is highly likely to close with a doji star; additionally, the rising support line on the daily chart has been broken. If it cannot close above the support line, the risk remains high.
The decline on the 4-hour level is smaller than Bitcoin's, and currently, we need to pay attention to whether it can break the downward trend line. If it breaks through, there is still a short-term demand for a rebound. There are 10 days left until the interest rate cut, so next week's trend is crucial.
● Support: 3435—3675

● Resistance: 4100—4300
If you like my views, please like, comment, and share. Let's navigate through the bull and bear markets together!!!
The article is time-sensitive and for reference only; it is updated in real-time.
Focusing on K-line technical research, we aim to win global investment opportunities. Public account: BTC Trading Prince Fusu

免责声明:本文章仅代表作者个人观点,不代表本平台的立场和观点。本文章仅供信息分享,不构成对任何人的任何投资建议。用户与作者之间的任何争议,与本平台无关。如网页中刊载的文章或图片涉及侵权,请提供相关的权利证明和身份证明发送邮件到support@aicoin.com,本平台相关工作人员将会进行核查。


