On October 15, traders dumped $1.8 billion in profits, marking the largest single-day profit realization wave since early summer this year.
On the same day, $430 million in realized losses surfaced, confirming the widespread consensus after the weekend's plunge: momentum is fading, and funds are rushing out. As of October 17, the price of Bitcoin fell below $110,000, having declined over 10% since the beginning of the month.
This is not a gradual correction but a rapid liquidation by investors who entered in early 2025. Long-term holders (those holding for over 3 months) dominated the selling, with their profit realization scale being six times that of short-term holders. Even during the plunge, they remain deeply in profit—this is not panic selling but a rational risk-off strategy: locking in gains to avoid the illusion of a rebound when weak signals emerge.

Historical warning: only in bear markets does over 30% of the circulating supply fall into the abyss of losses. We are now approaching that threshold. If the $100,000 level holds, the cost baseline resets, and bullish momentum may recover; if it fails, a correction could extend to $80,000, representing a 35% drop from the ATH. The selling pressure is significant.
Bitcoin's stability remains impressive, but on-chain signals indicate that confidence is quietly collapsing. Bulls are holding the line, but each bearish candlestick raises doubts—should one buy the dip or catch a falling knife? Below, we analyze this crisis from multiple dimensions to capture clues for a turnaround.
1. Profit Selling Wave: The Calm Retreat of Whales
Staggering Selling Scale:
● On October 15, $1.8 billion in profits were realized in a single day, with cumulative sales exceeding $5 billion in October, setting a new quarterly high. On the same day, the market also saw $430 million in realized losses.
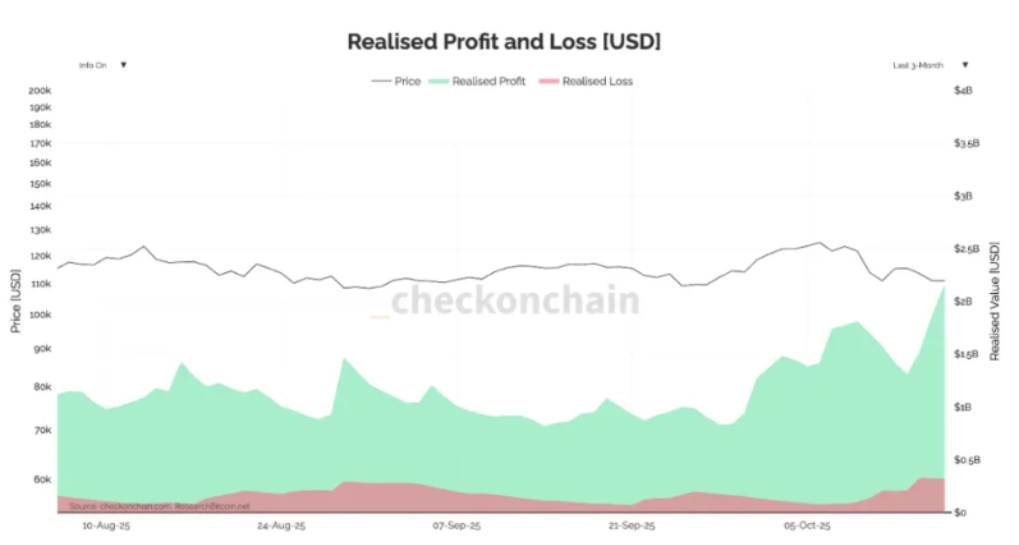
The total sales volume surged nearly 70% compared to the same period last year, indicating that the bullish momentum is weakening. Whales are adjusting their positions at high prices, but without new funds stepping in, prices could easily breach key support levels.
Characteristics of the Selling Entities:
● Long-term holders contributed 65% of the selling volume, with an average cost price of $40,000 to $50,000, enjoying over 150% in unrealized profits, and currently reducing their positions by only 20-30%, retaining most of their holdings.
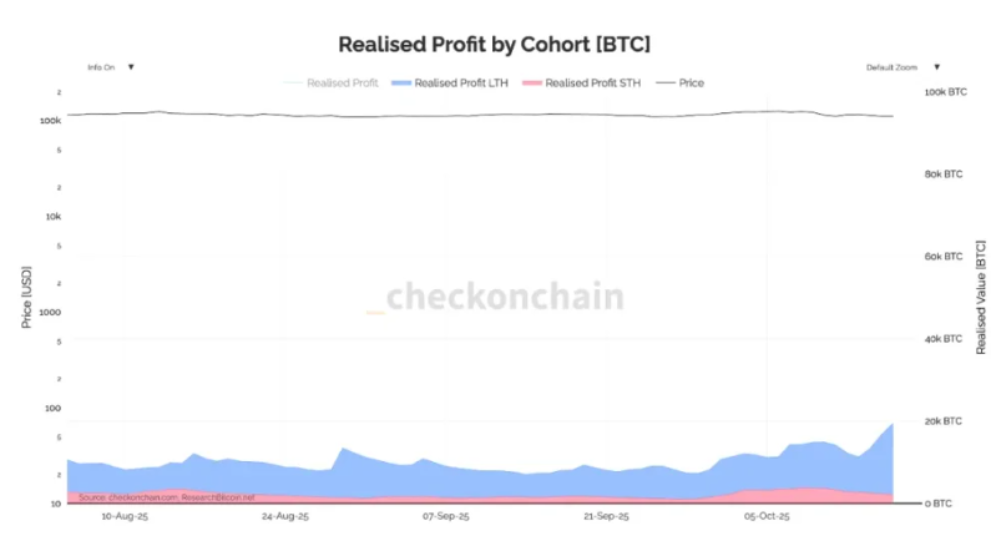
Behavior Analysis: These experienced investors are not liquidating entirely but are making precise, surgical reductions—controlling risk while preserving capital and leaving room for future low-price replenishment.
Market Liquidity Concerns: Exchanges have seen three consecutive days of net outflows, with withdrawals from Binance and Coinbase surging by 30%. A significant amount of funds is flowing into cold wallets or DeFi protocols, akin to draining the market's blood, putting short-term liquidity under severe pressure.
2. Losses Spreading: From Point to Area Crisis
Expansion of Losses
● Realized losses have reached $430 million, with the profit-loss ratio tightening from 1:3 to 1:2, and half of short-term holders are now in unrealized losses, with an average cost price as high as $95,000. The tightening profit-loss ratio sends out early warning signals. Short-term holders are mostly retail investors chasing highs, and once unrealized losses appear, it can easily trigger a chain reaction of stop-losses, creating a snowball effect.
Accelerating Unrealized Losses
● Currently, unrealized losses account for 2% of the total market value, with a daily growth rate of 0.15%. If this ratio exceeds 3%, it will reach a historically dangerous threshold. Retail stop-losses could trigger algorithmic trading follow-ups, with hidden risks of leverage explosions. The short position ratio on CME futures has risen to 45%, and the fear index could spike from 25 to 50.
Divergence in Market Views
● Glassnode's Pierre Rochard believes: "This is just a normal correction in a bull market, similar to the situation in March 2024"; ARK's Chris Burniske warns: "When the bear market started in 2022, a 2% loss was the first signal."
This professional divergence itself reflects the market's uncertainty, becoming a thermometer for observing sentiment.
3. Veteran Position Reduction: Strategic Intent of Rational Retreat
Low costs form a natural moat, and substantial profit buffers allow them to cope with volatility calmly. This gradual reduction is a sign of experience, aimed at ensuring portfolio safety through the winter. A similar situation occurred at the end of the 2018 bear market, where the reductions built strength for the 2020 bull market. Notably, the funds from selling have largely shifted to ETH or stablecoins, creating an internal cycle rather than a complete exit.
Advantages of Long-term Holders
● After enduring the half bull market of 2024, their average cost price is only $42,000; even if the price drops to $80,000, they still maintain an 80% profit margin, with current daily sales volume around 5,000 coins, keeping the pace manageable.
Macroeconomic Pressures
● U.S. Treasury yields remain high at 4.5%, and expectations for Fed rate cuts have fallen through.
● The U.S. dollar index stabilizes at 105, with BTC's correlation to the Nasdaq index reaching 0.7.
● Geopolitical tensions in the Middle East have led to a resurgence of traditional gold as a safe haven.
4. Exhaustion Warning: Signals of a Turning Point in October
Market Appearance vs. Substance
● At the beginning of the month, prices quickly surged from $90,000 to $115,000, with trading volume exceeding $100 billion. However, the MVRV ratio fell from 3.2 to 2.8, and the number of new addresses decreased by 15%, indicating that the apparent prosperity is built on shaky foundations.
Deteriorating Signs
● Selling continues unabated, with exchange inventories reaching 2.5 million coins, and self-custody addresses have surged—though this enhances security, it freezes market liquidity.
Cumulative Catalysts
● On the 15th, CPI data exceeded expectations; weakness in tech stocks transmitted to the crypto market; pessimistic sentiment spread under the social media hashtag #BitcoinFatigue.
5. Technical Analysis
● According to the BTC/USDT one-hour candlestick chart, the first key defense line is at $107,400, while deeper support lies at $101,600.
● However, multiple technical indicators confirm a "fatigued" state: in the MACD (12, 26, 9), the DIF value of 575 is positive, but the DEA remains deeply in the negative zone at -679, indicating a strong contrast where short-term momentum attempts to rebound but struggles to reverse the overall weak pattern;
● Meanwhile, the OBV (On-Balance Volume) indicator is at -46,789, visually revealing insufficient willingness to follow through during intraday rebounds, with the overall state still in a price-volume divergence outflow.
● Nevertheless, the market is not entirely hopeless. In the KDJ indicator, the K value (73) and D value (65) have entered a strong zone, while the J value (90) has reached the overbought line, introducing a slight variable into the current stalemate. It suggests that a technical rebound based on hourly levels is brewing, potentially testing and contending with the first-line support at $107,400.
● However, if the rebound fails to gain effective volume (OBV) support and does not firmly establish above the key support, the bears are likely to strike again.
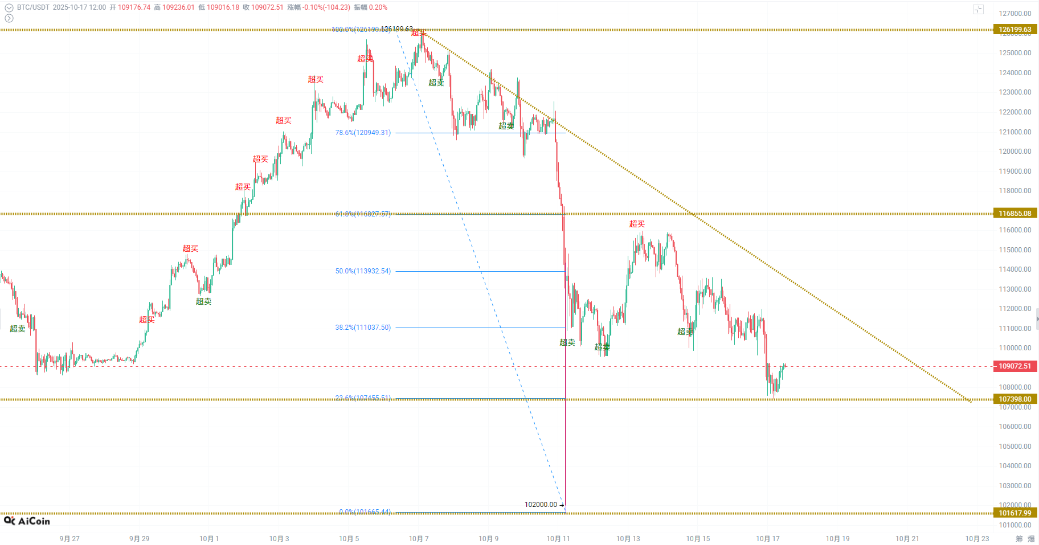

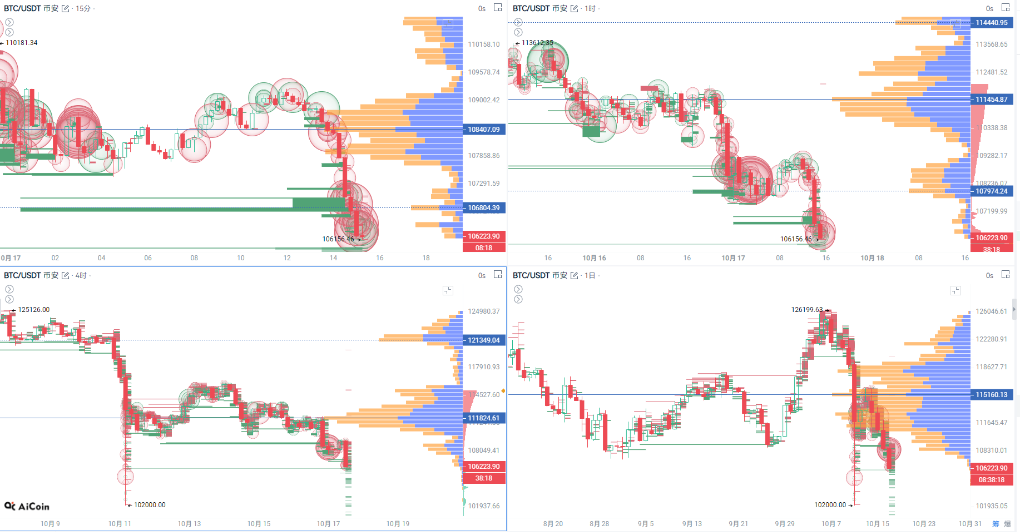
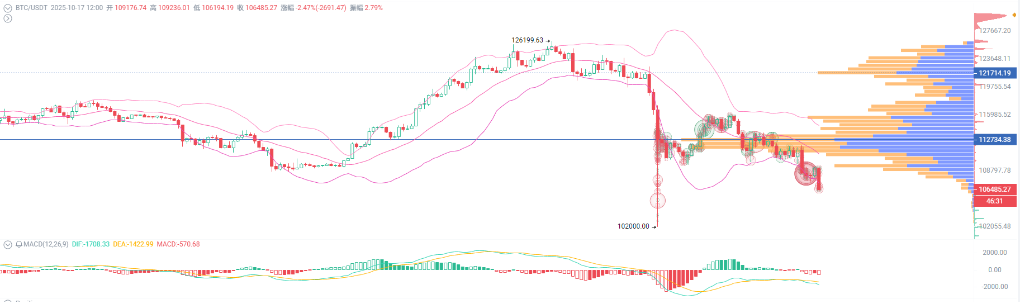
● The multi-cycle chip distribution of Bitcoin shows clear signs of structural reorganization. From the 4-hour and daily cycles, the volume profile indicates that the key support range is concentrated around $105,000 to $110,000, with the POC (Point of Control) at about $110,000, forming a strong accumulation zone for buyers, while above $117,000, over 500,000 coins have accumulated, showing signs of loosening, which may trigger an extreme correction to $98,000 to $104,000.
● In the MACD custom indicator strategy on the AiCoin platform, users can capture Bitcoin's bullish and bearish turning signals through flexible parameter settings (such as 12, 26, 9) for efficient profit optimization.
● From the 4-hour candlestick chart above, the MACD line (blue) and the signal line (orange) have recently formed a golden cross (MACD 12, 26, 9 crossing above the signal line), accompanied by the histogram turning red and breaking through the zero axis, triggering "buy" alert conditions, combined with RSI oversold rebound (rising from around 30 to above 50) and increased trading volume (orange histogram surging to 126,963 contracts), indicating enhanced short-term bullish momentum, suggesting building positions near the $102,000 support level, targeting resistance at $117,000.
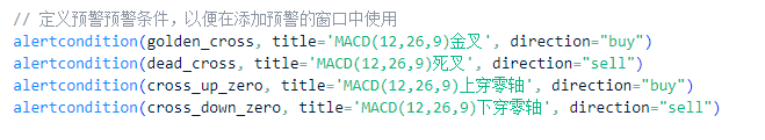
● The core of this strategy lies in multiple overlapping alerts: golden cross confirms trend initiation, death cross warns of profit-taking exit, zero axis crossover strengthens long signals, while crossing below suggests reducing positions to avoid risk.
● In practical application, by combining AiCoin's backtesting tools, users can simulate and validate on historical data, helping retail investors accurately grasp seasonal upward windows, significantly reducing emotional trading risks, ultimately aiding in the steady appreciation of assets.

Outlook: The "Life and Death Game" at the $100,000 Level
The bulls are still holding the line. Their steadfastness resembles the stubbornness of veterans. But each bearish candlestick amplifies the question: is this a buying opportunity or a knife-catching game?
On-chain signals are ruthless: confidence is eroding, fatigue is intensifying. Bitcoin's "hidden breath" may just be the calm before the storm. Investors, fasten your seatbelts— the next turning point may be tonight.
Join our community to discuss and grow stronger together!
Official Telegram community: https://t.me/aicoincn
AiCoin Chinese Twitter: https://x.com/AiCoinzh
OKX benefits group: https://aicoin.com/link/chat?cid=l61eM4owQ
Binance benefits group: https://aicoin.com/link/chat?cid=ynr7d1P6Z
免责声明:本文章仅代表作者个人观点,不代表本平台的立场和观点。本文章仅供信息分享,不构成对任何人的任何投资建议。用户与作者之间的任何争议,与本平台无关。如网页中刊载的文章或图片涉及侵权,请提供相关的权利证明和身份证明发送邮件到support@aicoin.com,本平台相关工作人员将会进行核查。


