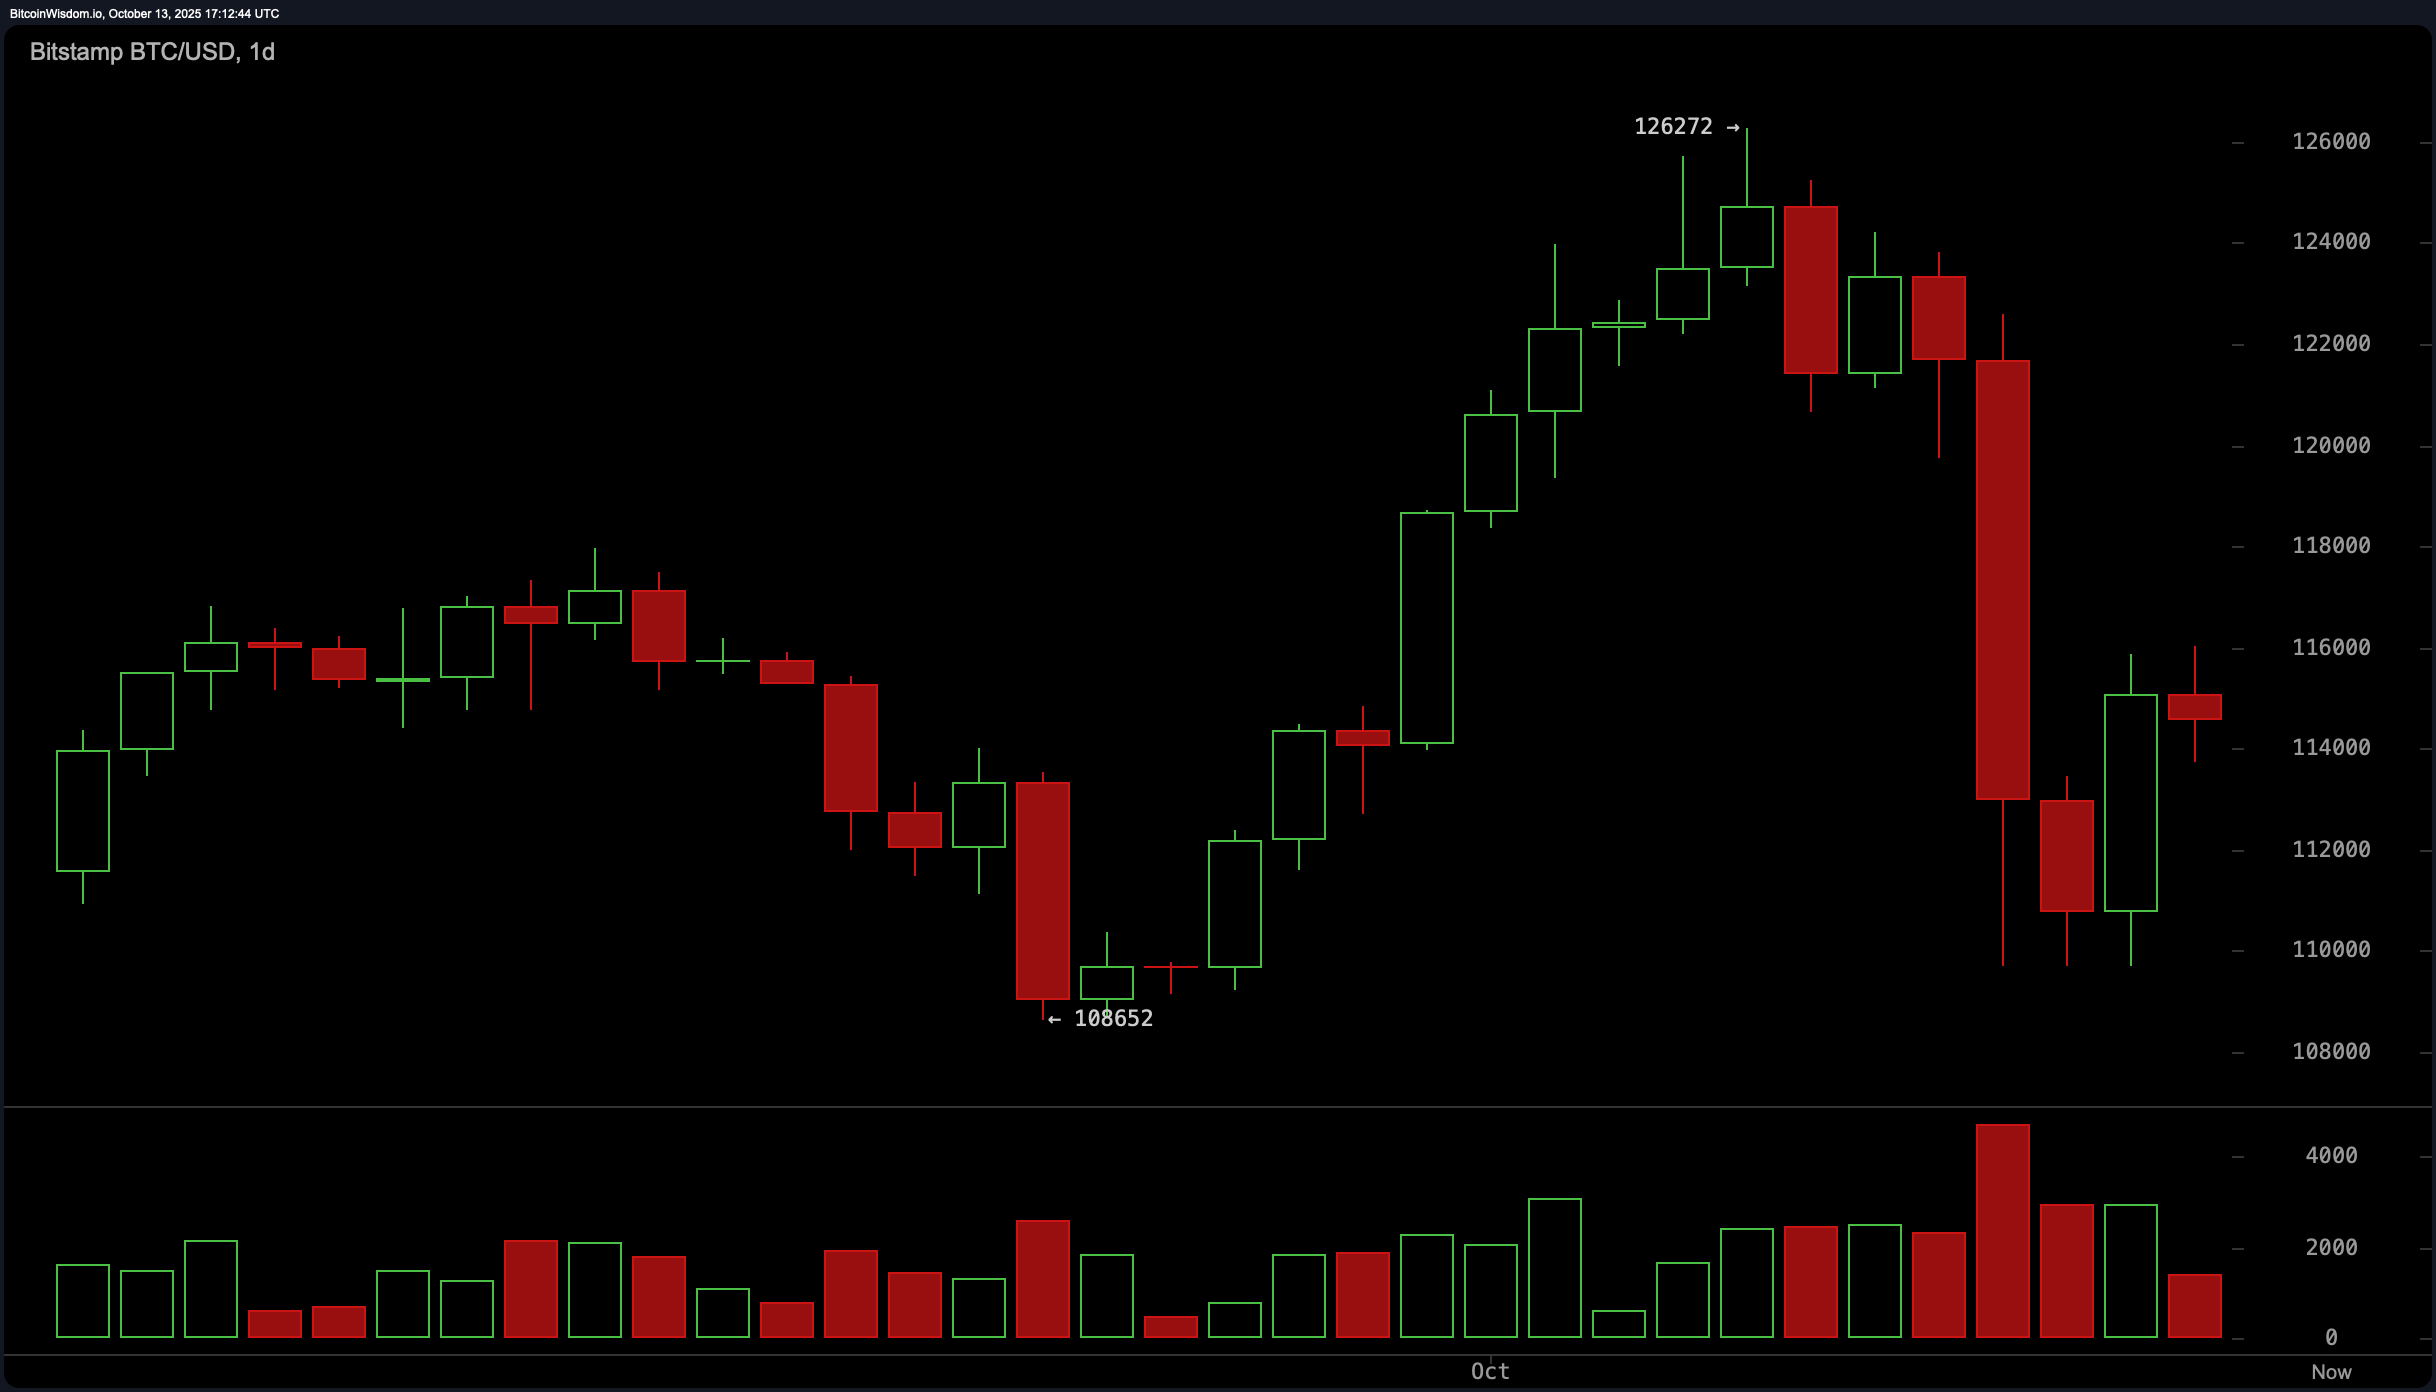
Bitcoin price action on the daily chart reveals a notable bearish structure, marked by a double top formation near $126,000 and a subsequent drop driven by high-volume selling. The breakdown was punctuated by a pronounced bearish engulfing candle, which negated multiple prior bullish sessions and drove bitcoin down toward $108,652, where it found temporary support.
Despite a short-lived rebound, the lack of sustained volume on upward moves indicates that upside momentum remains fragile. Consolidation near the $114,000–$116,000 zone suggests market indecision and highlights the importance of price stability above $116,500 for any trend continuation.

BTC/USD 1-day chart via Bitstamp on Oct. 13, 2025.
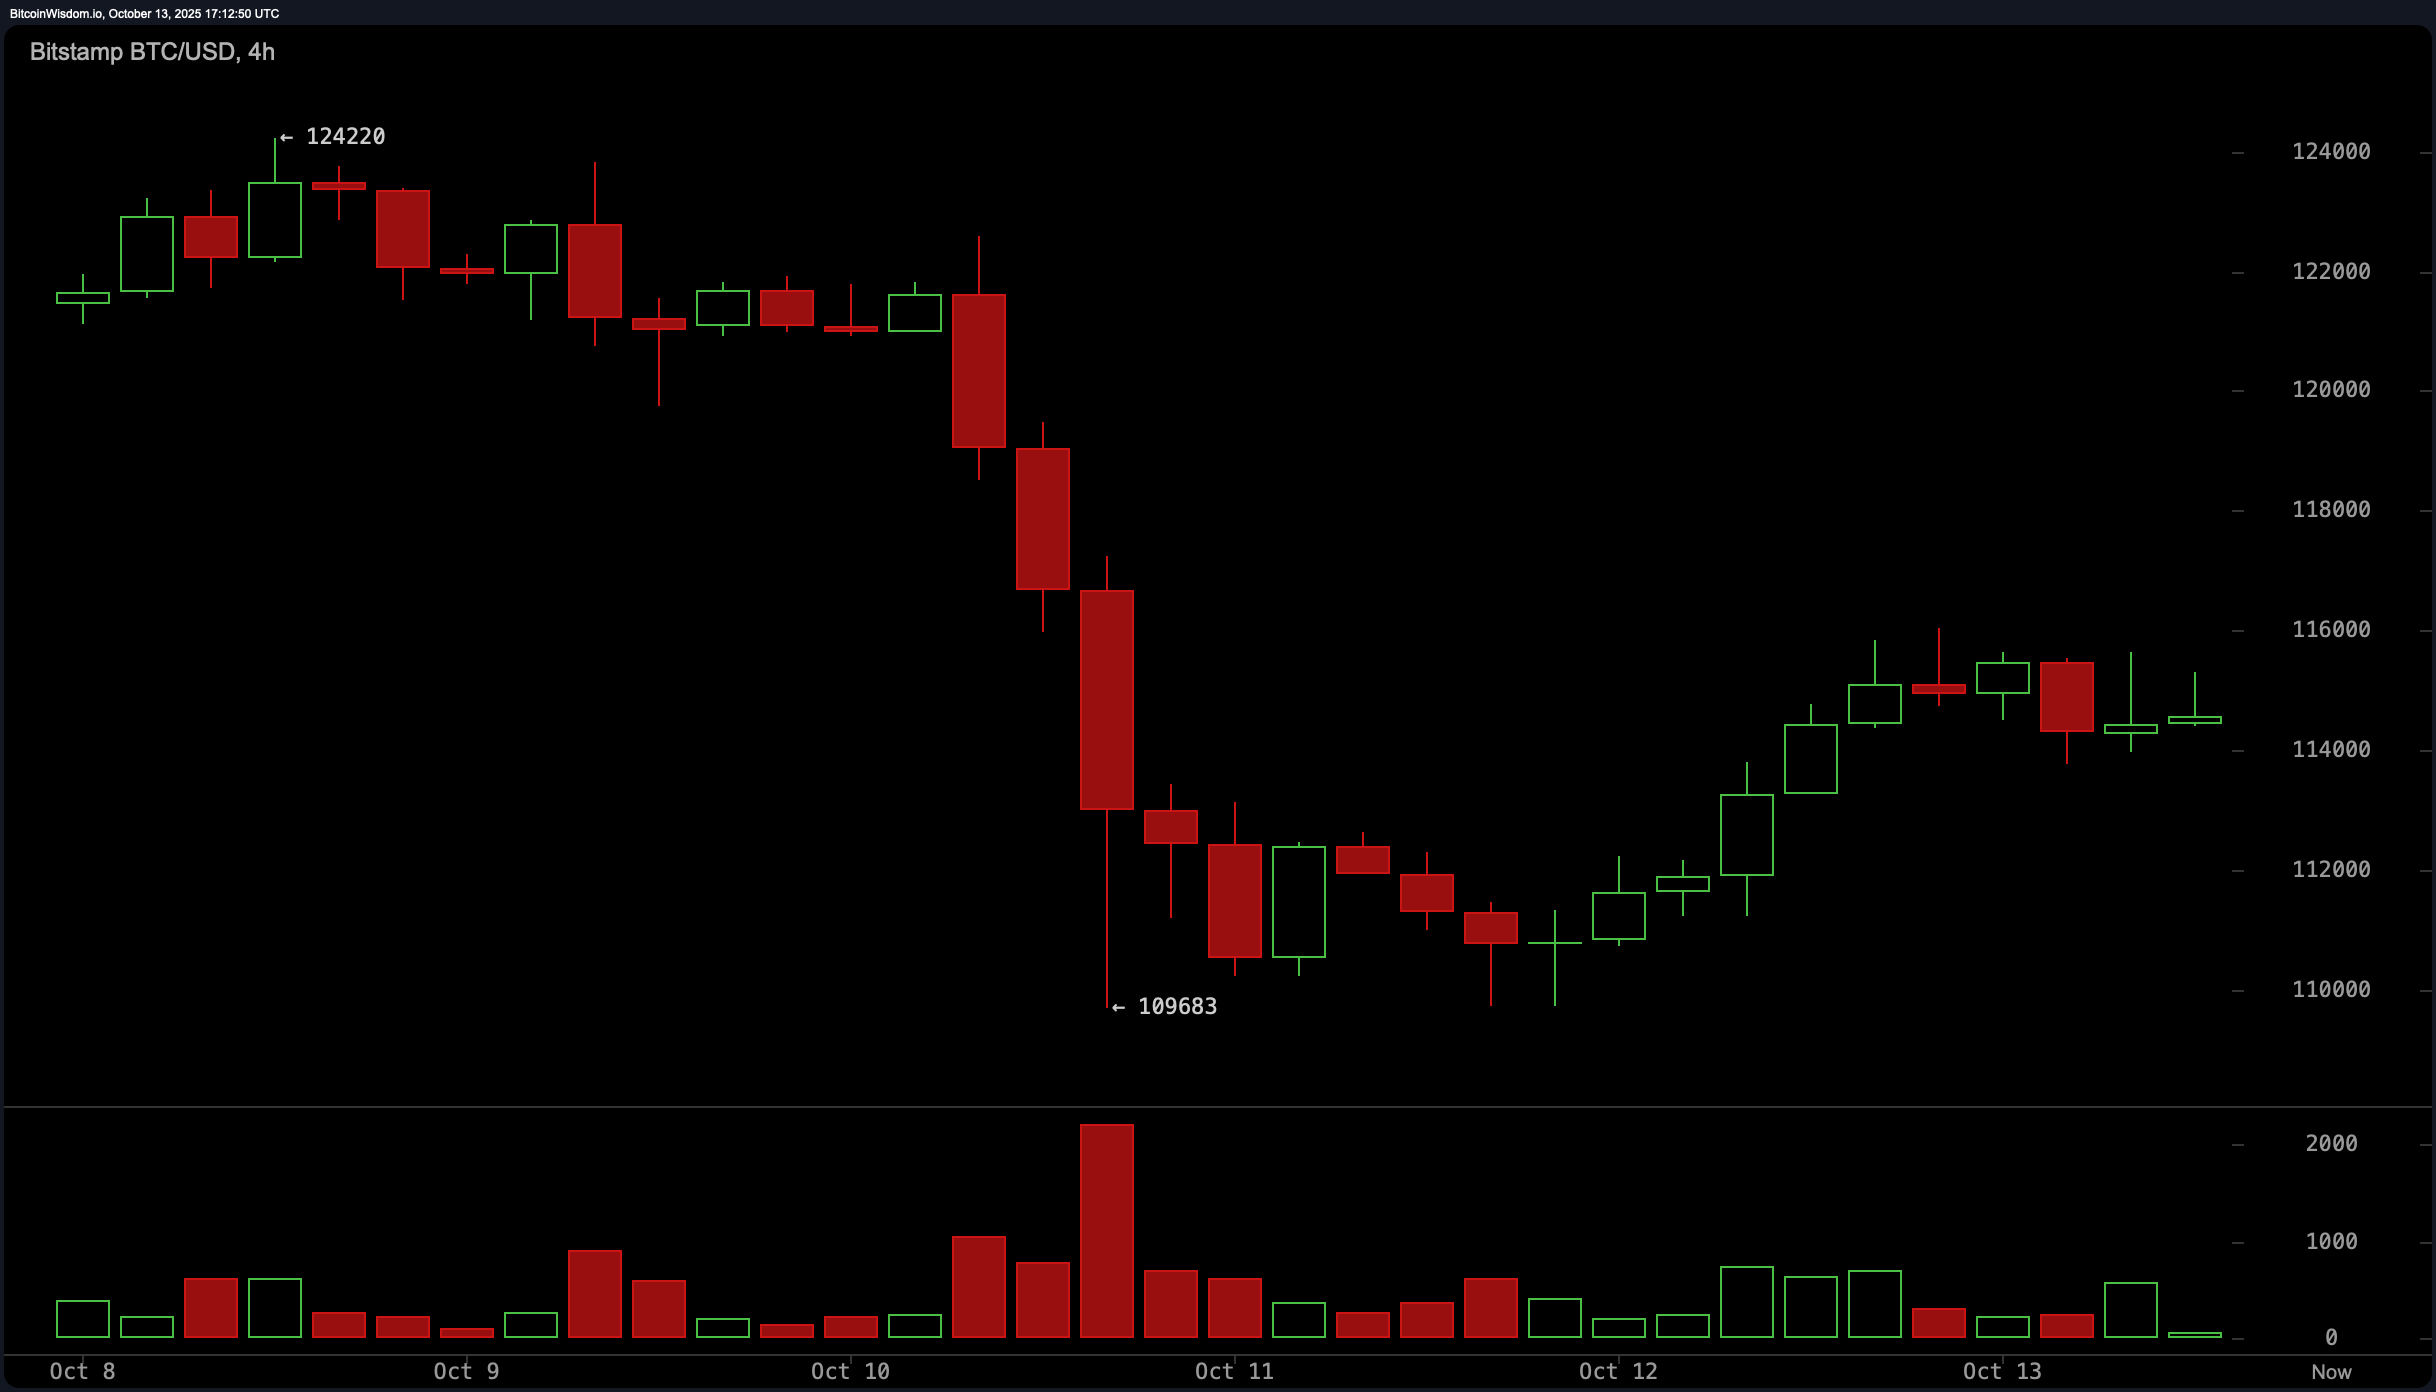
The 4-hour chart supports this cautionary tone. Bitcoin broke out of a descending trendline by establishing a sequence of higher highs and higher lows, yet bullish attempts above $116,000 have failed to gain traction. Price has since entered a consolidation pattern between $114,000 and $116,000. Volume has been declining steadily, which may point either to waning momentum or the beginning of a base-building phase. Until a breakout or breakdown occurs, the price remains in a holding pattern that will likely be resolved by a volume-driven move.

BTC/USD 4-hour chart via Bitstamp on Oct. 13, 2025.
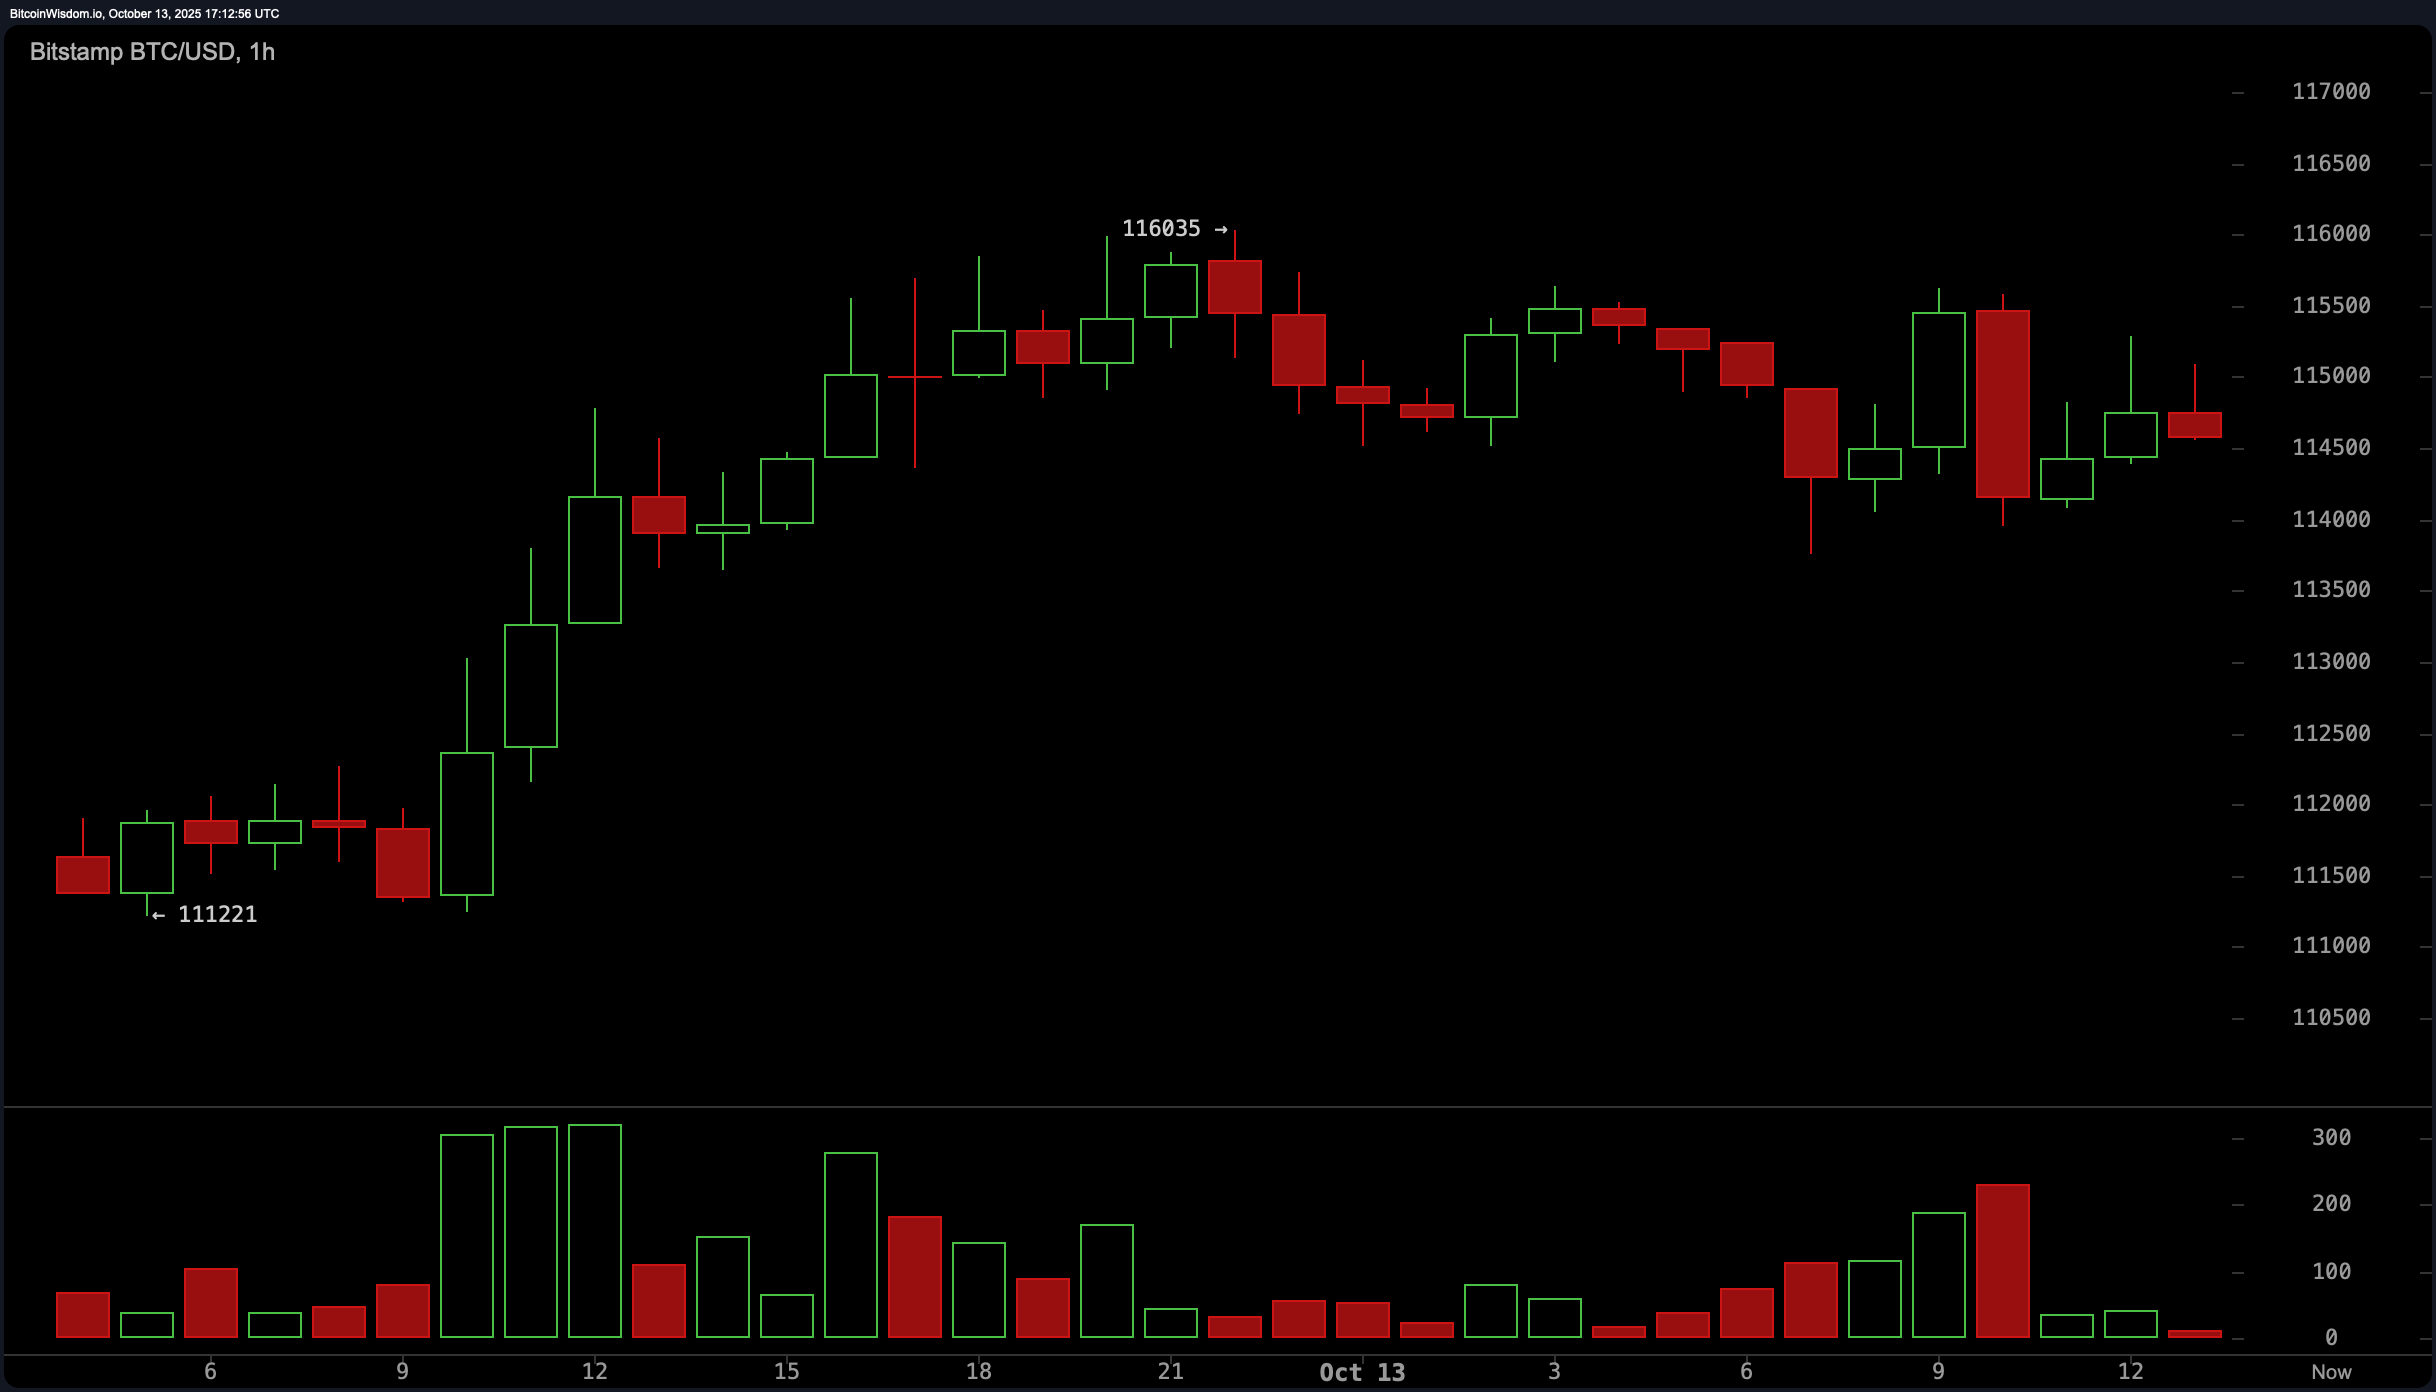
On the hourly chart, bitcoin is displaying a narrow range-bound structure following an earlier bounce. Repeated rejections near the $116,000 level suggest overhead resistance, while short-term support is evident around $114,000–$114,500. Notably, volume on this timeframe has dried up significantly, often a precursor to a larger directional shift. Given this context, any breakout above $116,200 could lead to a rapid test of $118,000, but failure to hold $114,000 risks deeper retracement into lower support zones.

BTC/USD 1-hour chart via Bitstamp on Oct. 13, 2025.
Oscillator readings largely underscore a neutral to weak momentum environment. The relative strength index (RSI) reads 47, suggesting a lack of directional conviction. The stochastic oscillator is at 24, while the commodity channel index (CCI) is at −26—both are also in neutral zones. Meanwhile, the average directional index (ADX) is at 26, reflecting a moderate trend strength without a clear direction. However, bearish signals emerge from the awesome oscillator, momentum indicator, and moving average convergence divergence (MACD), which read −583, −7,656, and 398 respectively—each pointing to lingering downside pressure.
Moving averages across multiple timeframes are generally skewed bearish. On the shorter end, both the 10-period exponential moving average (EMA) at $116,842 and the 10-period simple moving average (SMA) at $119,062 are positioned above the current price, indicating downward pressure. Similar bearish alignment is observed across the 20-, 30-, and 50-period EMAs and SMAs. However, signs of longer-term support are evident, with the 100-period EMA at $113,552 and the 200-period EMAs and SMAs near $108,000 and $106,992, respectively, all showing potential support zones. This divergence suggests bitcoin is at a technical crossroads, awaiting volume confirmation to define its next trend direction.
Bull Verdict:
Should bitcoin reclaim and sustain levels above $116,500 with volume confirmation, the recent consolidation may resolve in favor of the bulls. This would open the path toward retesting the $118,000–$120,000 zone, particularly if reinforced by a bullish candlestick formation and improving momentum indicators.
Bear Verdict:
If bitcoin fails to hold the $114,000 support and retreats with increasing volume, a renewed test of the $110,000–$108,000 range becomes likely. The presence of multiple sell signals across momentum oscillators and short-term moving averages reinforces downside vulnerability in the absence of a strong recovery above $116,000.
- Where is bitcoin trading now?
Bitcoin is currently priced at $114,846, consolidating between $113,696 and $115,792. - What key level must bitcoin break to move higher?
Bitcoin must reclaim and hold above $116,500 with volume confirmation for further upside. - What support level is crucial for bitcoin bulls?
Holding above $114,000 is essential to prevent a drop toward $110,000–$108,000. - Are technical indicators bullish or bearish today?
Momentum and moving averages lean bearish, while oscillators remain mostly neutral.
免责声明:本文章仅代表作者个人观点,不代表本平台的立场和观点。本文章仅供信息分享,不构成对任何人的任何投资建议。用户与作者之间的任何争议,与本平台无关。如网页中刊载的文章或图片涉及侵权,请提供相关的权利证明和身份证明发送邮件到support@aicoin.com,本平台相关工作人员将会进行核查。


