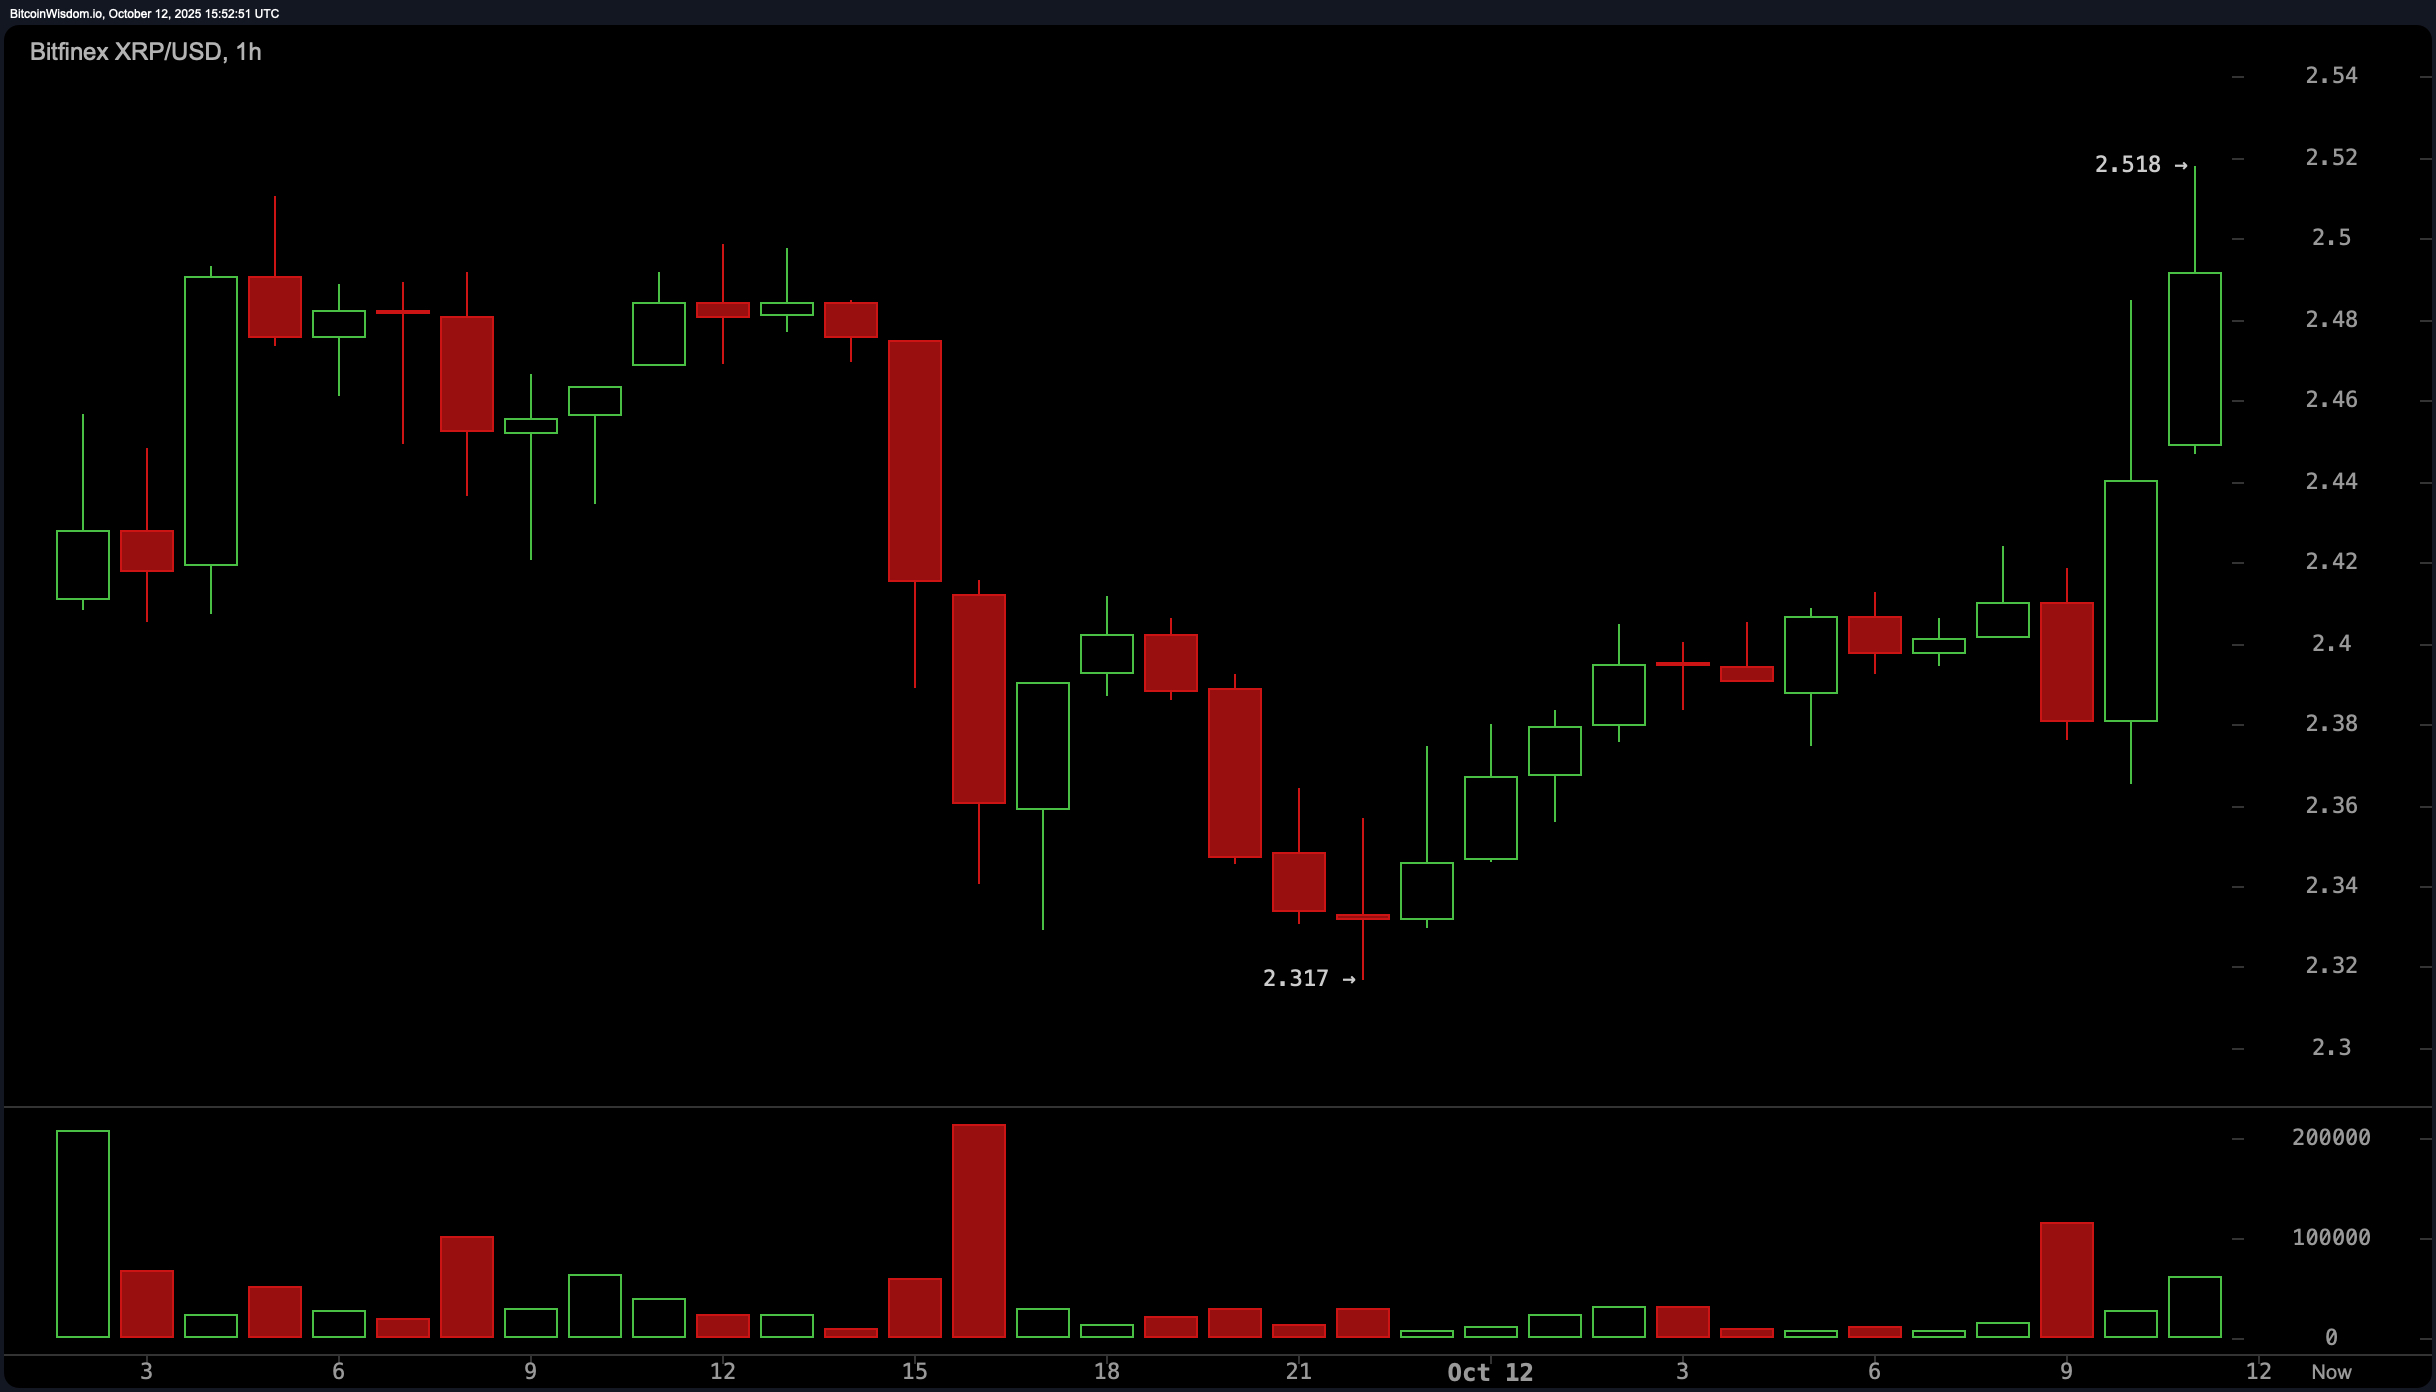
The 1-hour chart for XRP presents a continuation of bearish short-term structure, dominated by lower highs and lower lows. The price action formed a consolidation band between $2.35 and $2.50, suggesting accumulation or hesitation. However, trading volume continued to decline, accompanied by narrow-range candles, indicating an absence of strong conviction from either buyers or sellers.
Swing positions should be avoided until a breakout above or a breakdown below the consolidation resolves directionally.

XRP/USDC via Binance on Oct. 12, 2025, 1-hour chart.
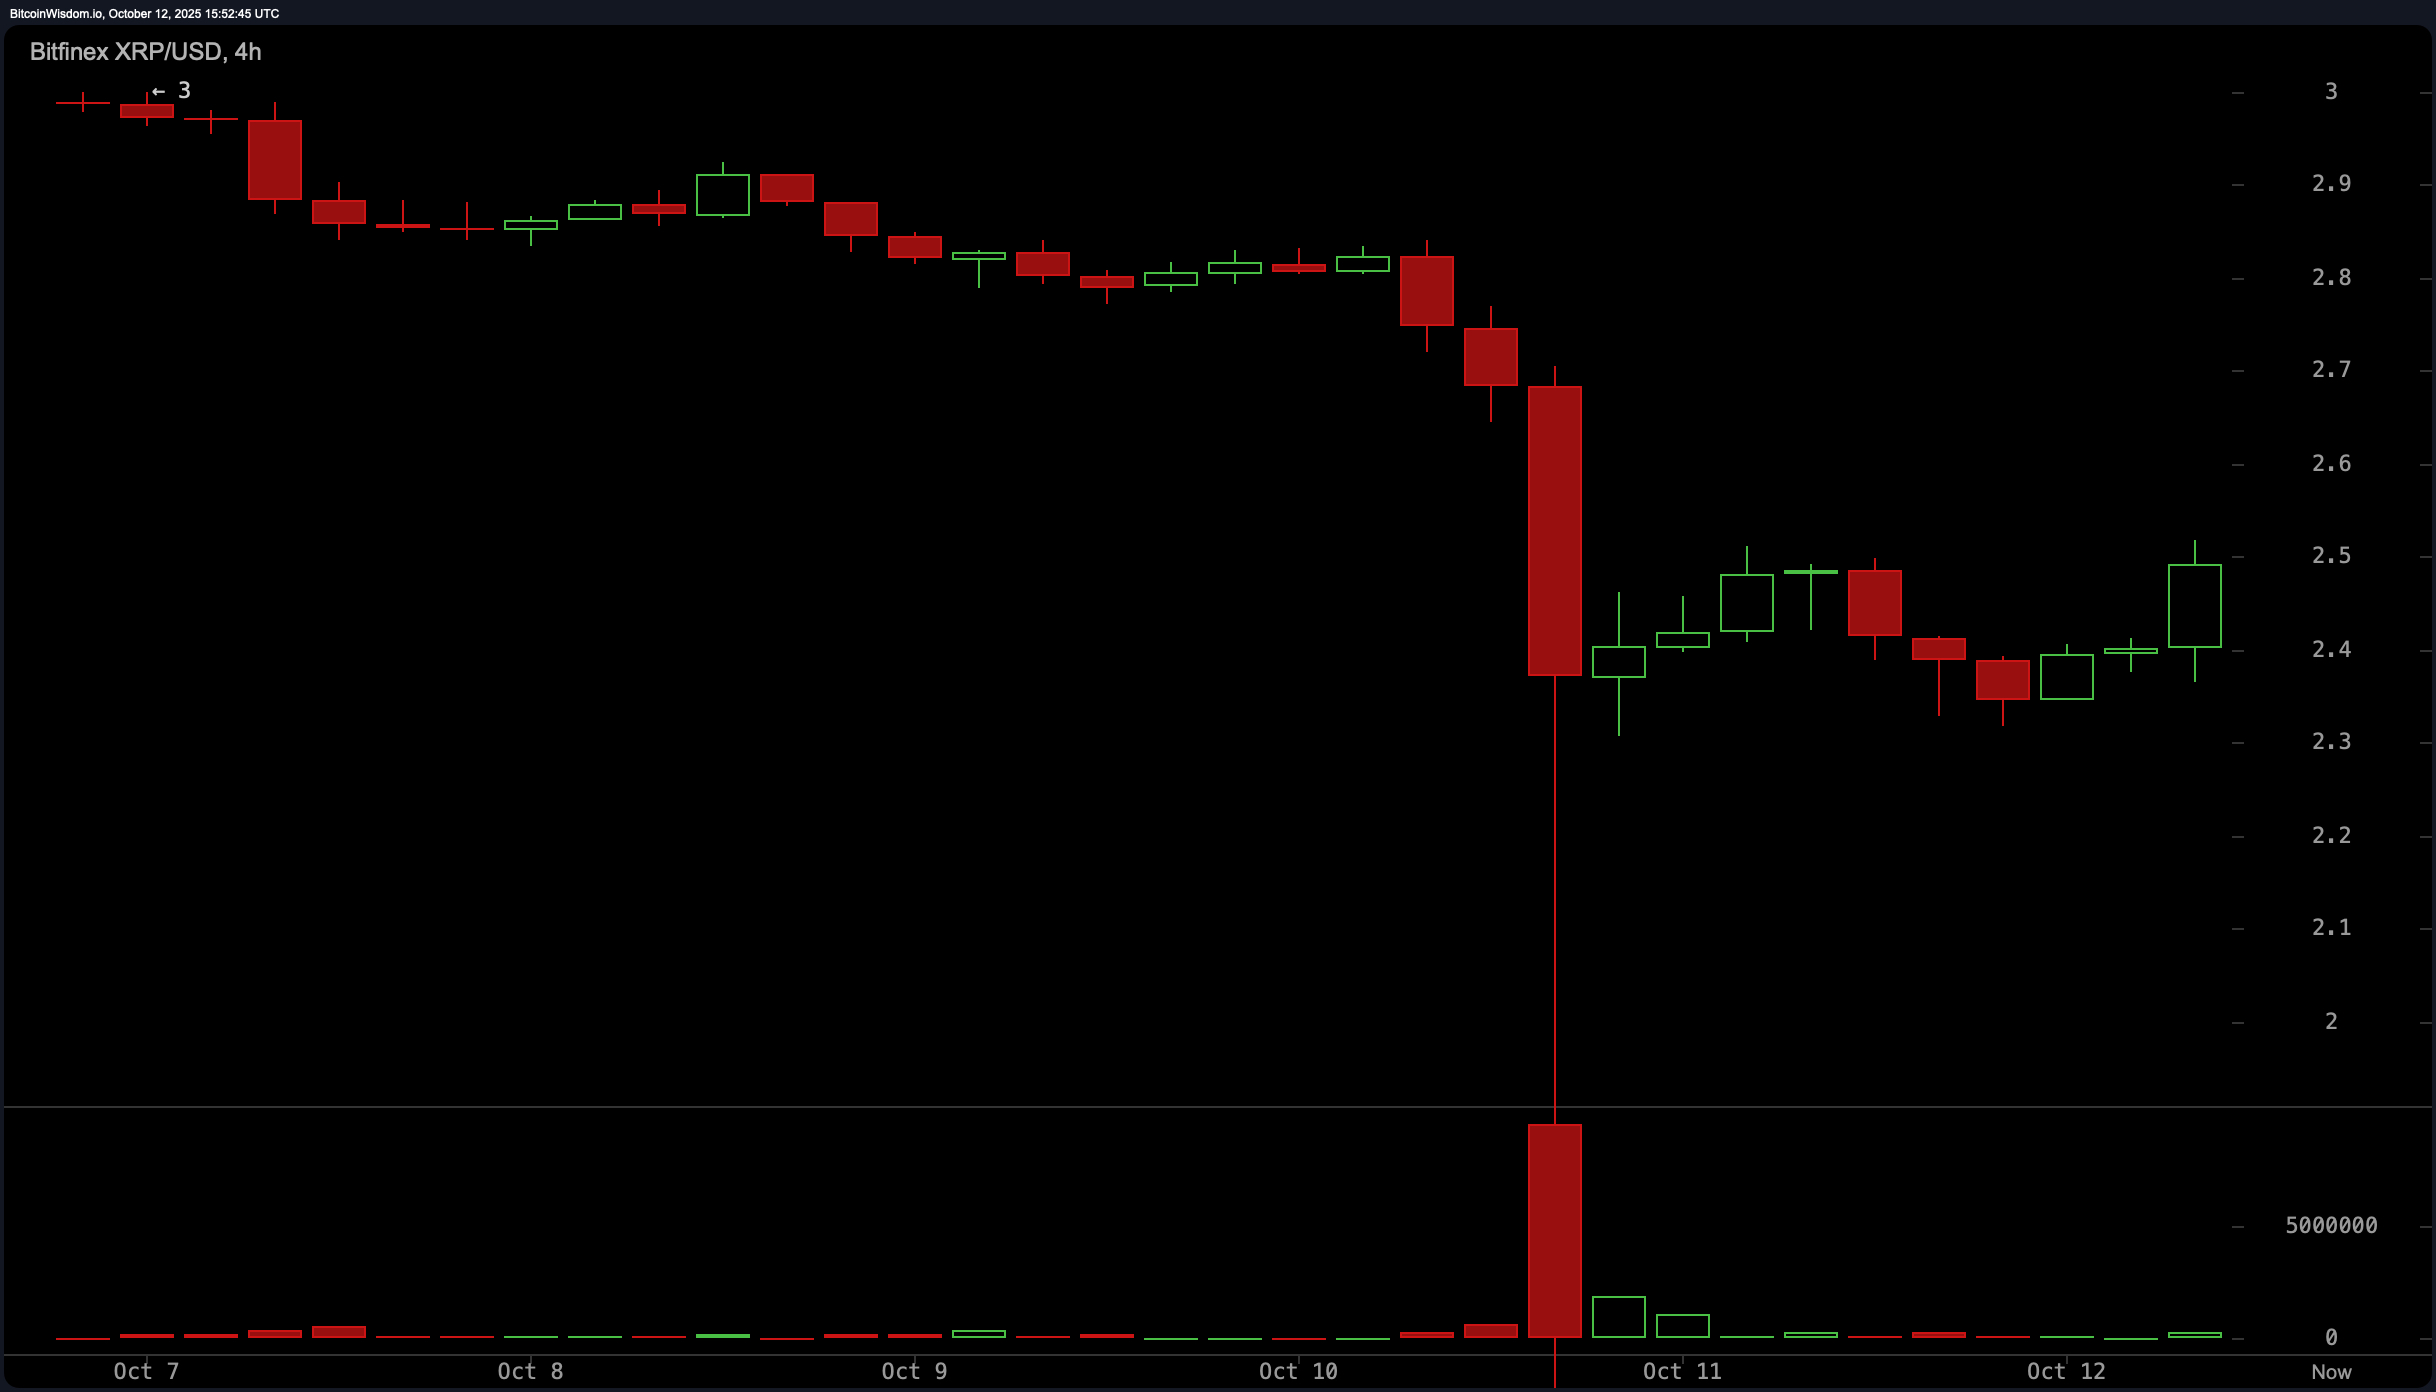
On the 4-hour chart, XRP’s trajectory has been defined by a breakdown pattern and a series of lower highs. The asset is currently stabilizing around $2.49 following a modest attempt to recover, but bullish momentum is notably absent. The decline was marked by a significant surge in sell-side volume, and the recent tapering in volume reflects market indecision. A convincing close above $2.60 with increasing volume could signal a potential short-term reversal. Conversely, if XRP closes below the $2.30 level, downside targets near $2.15 or even $2.00 may come into play.

XRP/USDC via Binance on Oct. 12, 2025, 4-hour chart.
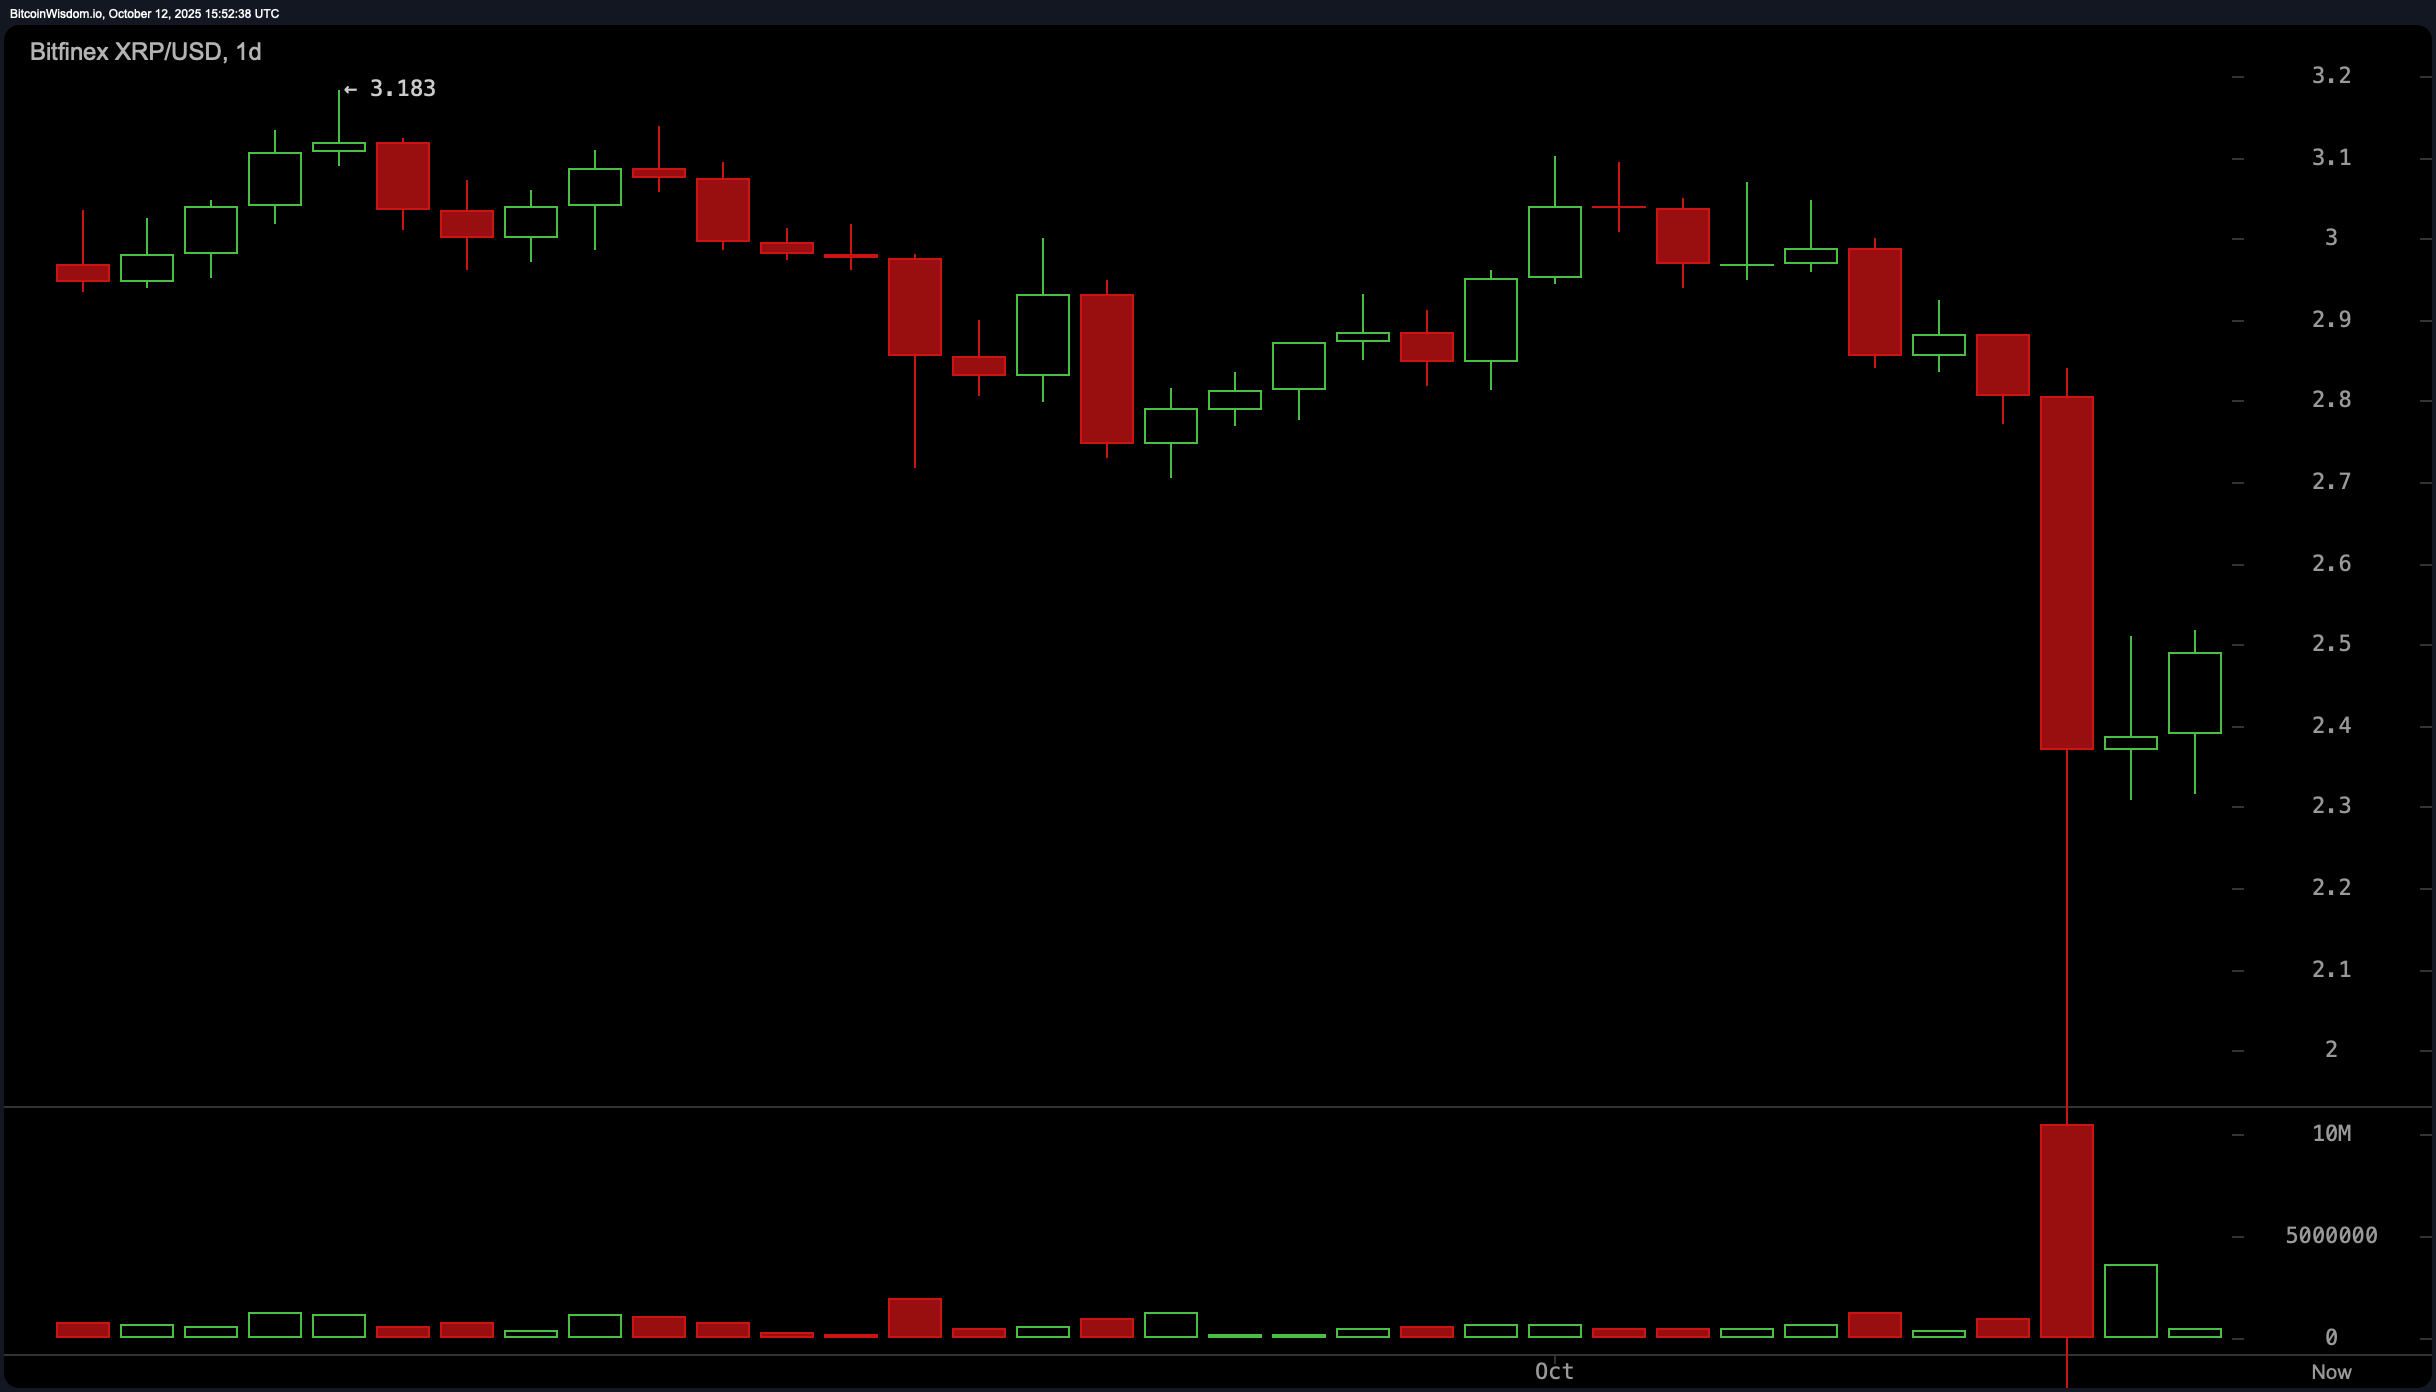
The daily chart provides a broader perspective, highlighting a sharp reversal after peaking near $3.19. The breach of support around $2.80 was characterized by a high-volume red candle, pushing the price downward to nearly $2.20. Despite a minor bounce, the market failed to generate sustained upside pressure, and follow-up volume has been weak—signaling a lack of buyer commitment.
Traders are advised to remain on the sidelines for new long positions unless the price breaks and holds above $2.60 with meaningful volume. Short opportunities may emerge if the price revisits the $2.70 to $2.80 range and fails to sustain momentum.

XRP/USDC via Binance on Oct. 12, 2025, 1-day chart.
Oscillator readings reflect a state of caution across indicators. The relative strength index (RSI) is at 26.77, indicating that the asset is nearing oversold territory but not issuing a directional bias. The Stochastic oscillator sits neutrally at 52.34, while the commodity channel index (CCI), at -199.36, shows a condition of significant price deviation from the mean, potentially flagging undervaluation.
The average directional index (ADX) at 24.55 denotes a weak trend environment. The Awesome oscillator, at -0.36, highlights limited positive momentum, and the momentum indicator at -0.67 points to the presence of downside inertia. The moving average convergence divergence (MACD) level at -0.11 further confirms weakening price momentum on the short to mid-term scale.
Moving averages (MAs) across all observed periods reflect downward pressure. The 10-period exponential moving average (EMA) and simple moving average (SMA) are at $2.665 and $2.763, respectively, positioning below recent price levels. Similarly, the 20-period EMA is $2.776 and the SMA is $2.815, continuing the downward slant.
Medium-term levels show the 30-period EMA at $2.825 and the SMA at $2.881, with the 50-period EMA and SMA recorded at $2.864 and $2.890. Longer-term sentiment remains aligned with this pattern: the 100-period EMA is at $2.826 while the SMA is $2.954, and the 200-period EMA and SMA are at $2.633 and $2.578, respectively. This consistent positioning of MAs above the current price reinforces a prevailing bearish trend structure.
Bull Verdict:
For bullish traders, a decisive breakout above $2.55 to $2.60 on strong volume could signal the early stages of a recovery. Reclaiming the $2.60–$2.80 range would further validate upward momentum, potentially paving the way for a retest of the $2.90 to $3.00 resistance zone, the roadblocks.
Bear Verdict:
From a bearish standpoint, the inability to hold above $2.50, combined with persistent weakness across moving averages and momentum indicators, suggests further downside is likely. A close below $2.30 could open the path toward deeper retracements, with targets near $2.15 or even $2 in play.
- ❓Why is XRP showing bearish signals right now?
Because multiple charts reveal lower highs, weak momentum, and declining trading volume — all pointing to fading buyer confidence. - ❓What key price levels should XRP traders watch next?
A close above $2.60 could hint at a rebound, while a drop below $2.30 may trigger deeper declines toward $2.15–$2.00. - ❓Are there any opportunities for short-term XRP traders?
Yes, scalpers might target small gains between $2.30–$2.40, but risk management is crucial in such a low-conviction setup. - ❓What’s the overall market sentiment for XRP?
Overall sentiment remains bearish, with moving averages and momentum indicators confirming downward pressure across all time frames.
免责声明:本文章仅代表作者个人观点,不代表本平台的立场和观点。本文章仅供信息分享,不构成对任何人的任何投资建议。用户与作者之间的任何争议,与本平台无关。如网页中刊载的文章或图片涉及侵权,请提供相关的权利证明和身份证明发送邮件到support@aicoin.com,本平台相关工作人员将会进行核查。


