
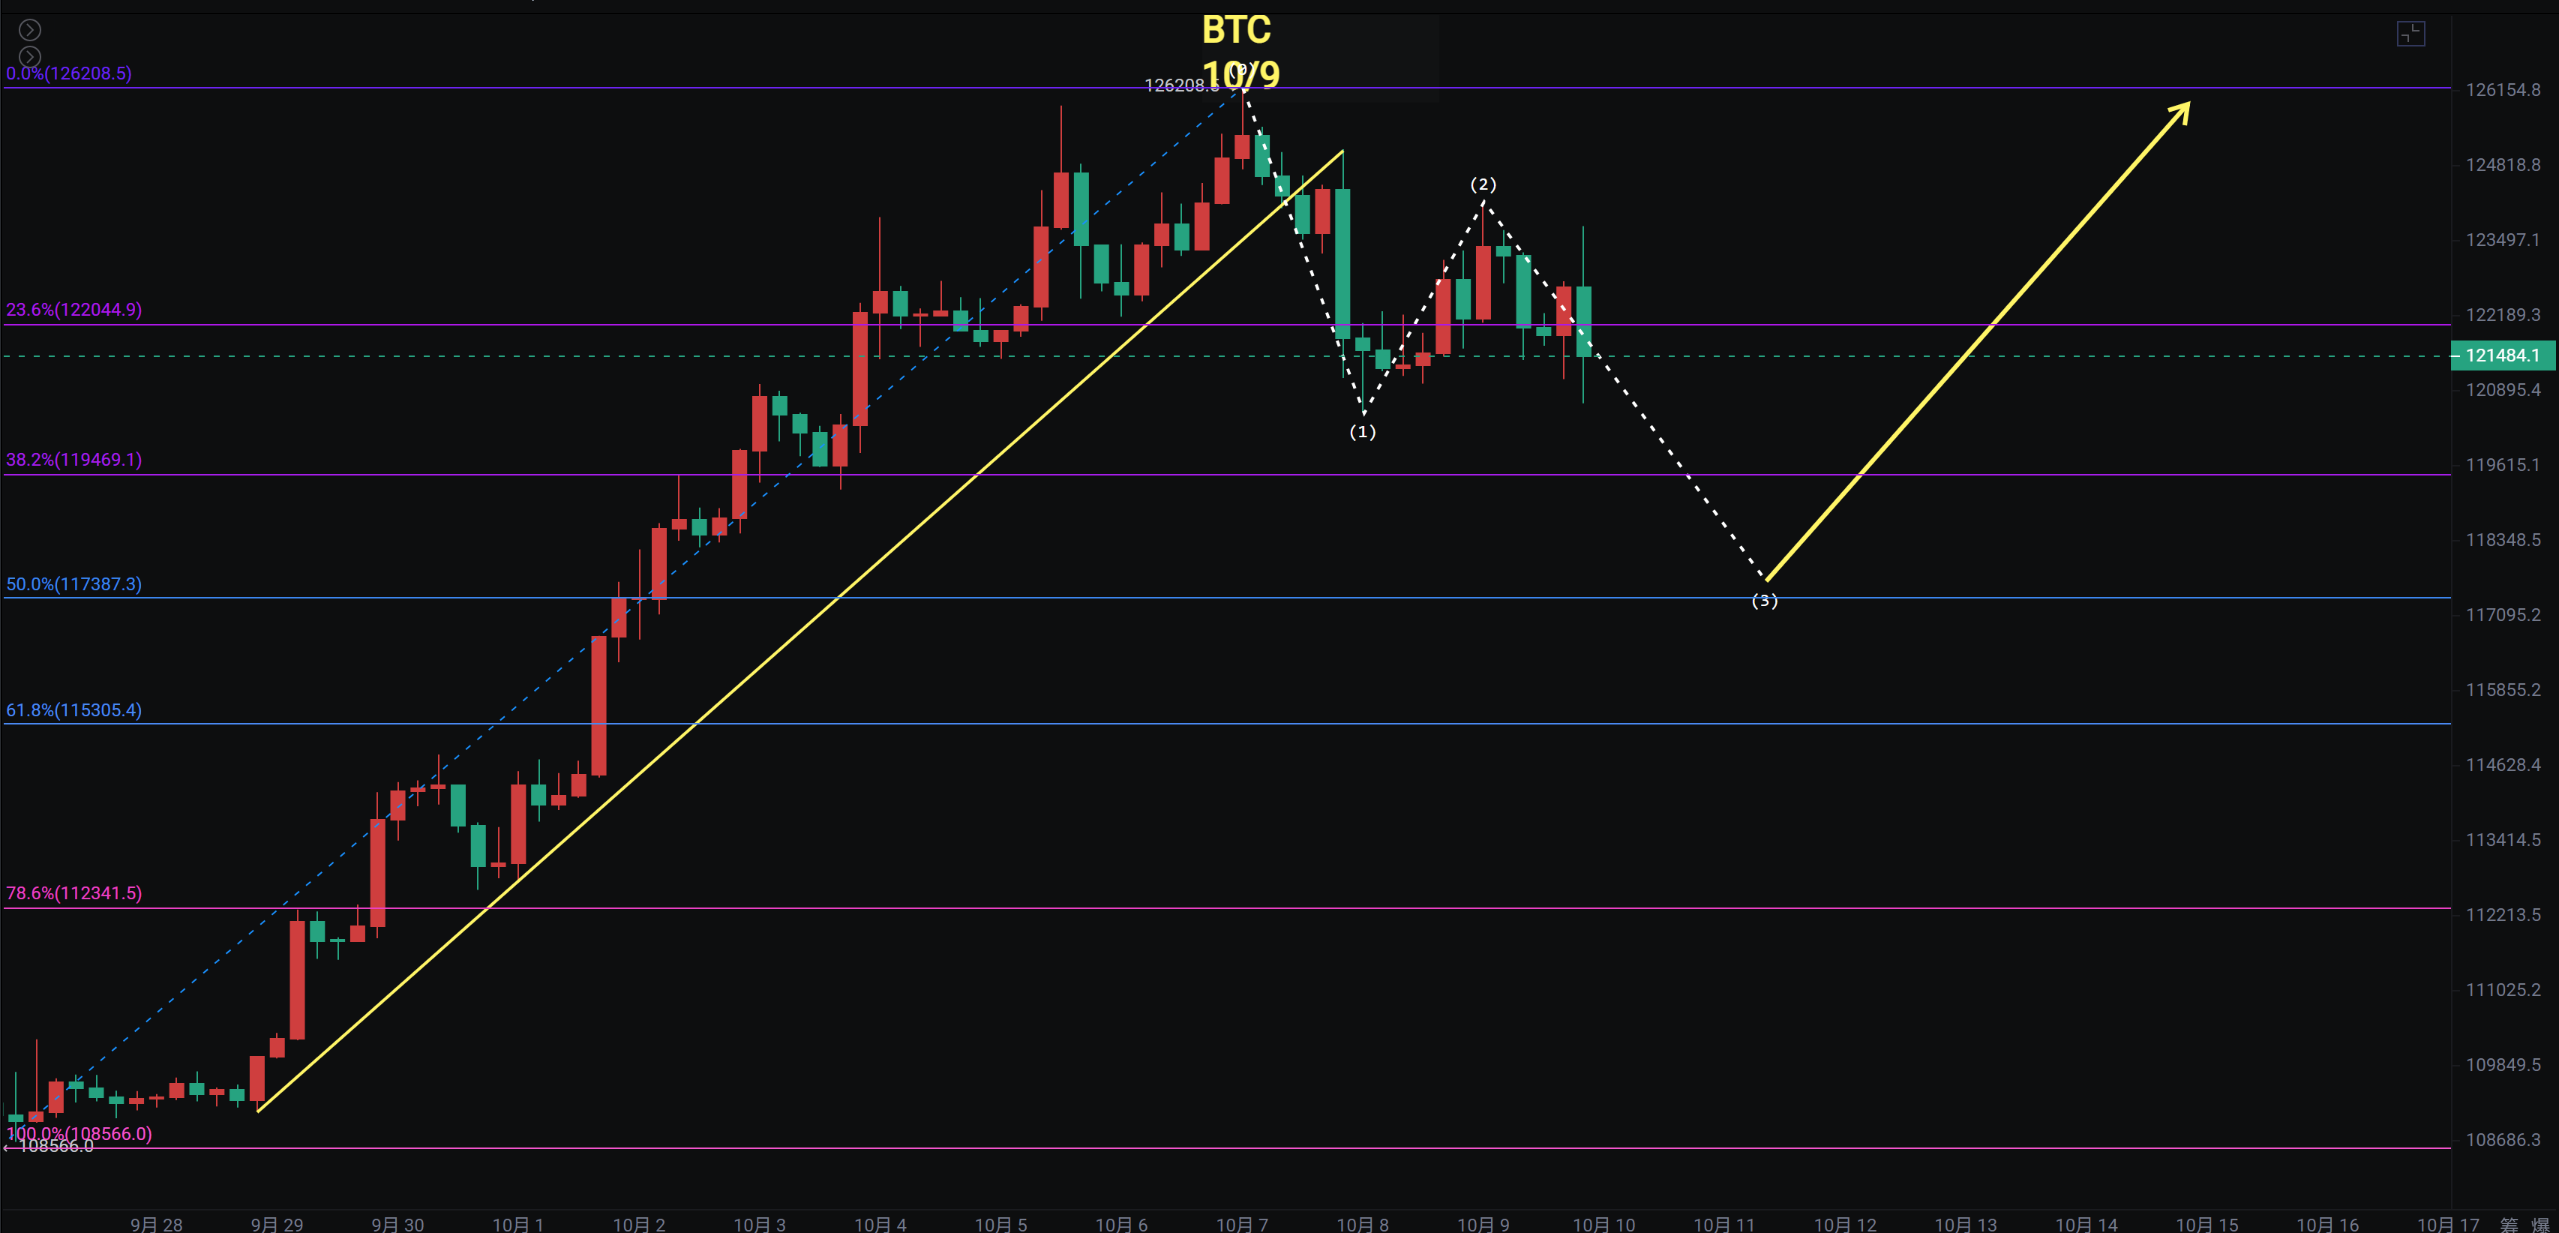
After Bitcoin reached a new high, a bearish engulfing pattern appeared on the daily chart. The rebounds yesterday and today are both below 124,000. The downward three-wave pattern on the 4-hour chart has not yet completed, with support at the W neckline between 117,000 and 117,500. We will see if there is a chance for a rebound. The daily chart is also under pressure at the top of the range and has pulled back. Yesterday, the analyst reminded that there has not yet been a buying point for going long, with target support in the Fibonacci 0.5 and 0.618 range, where one can consider entering long.
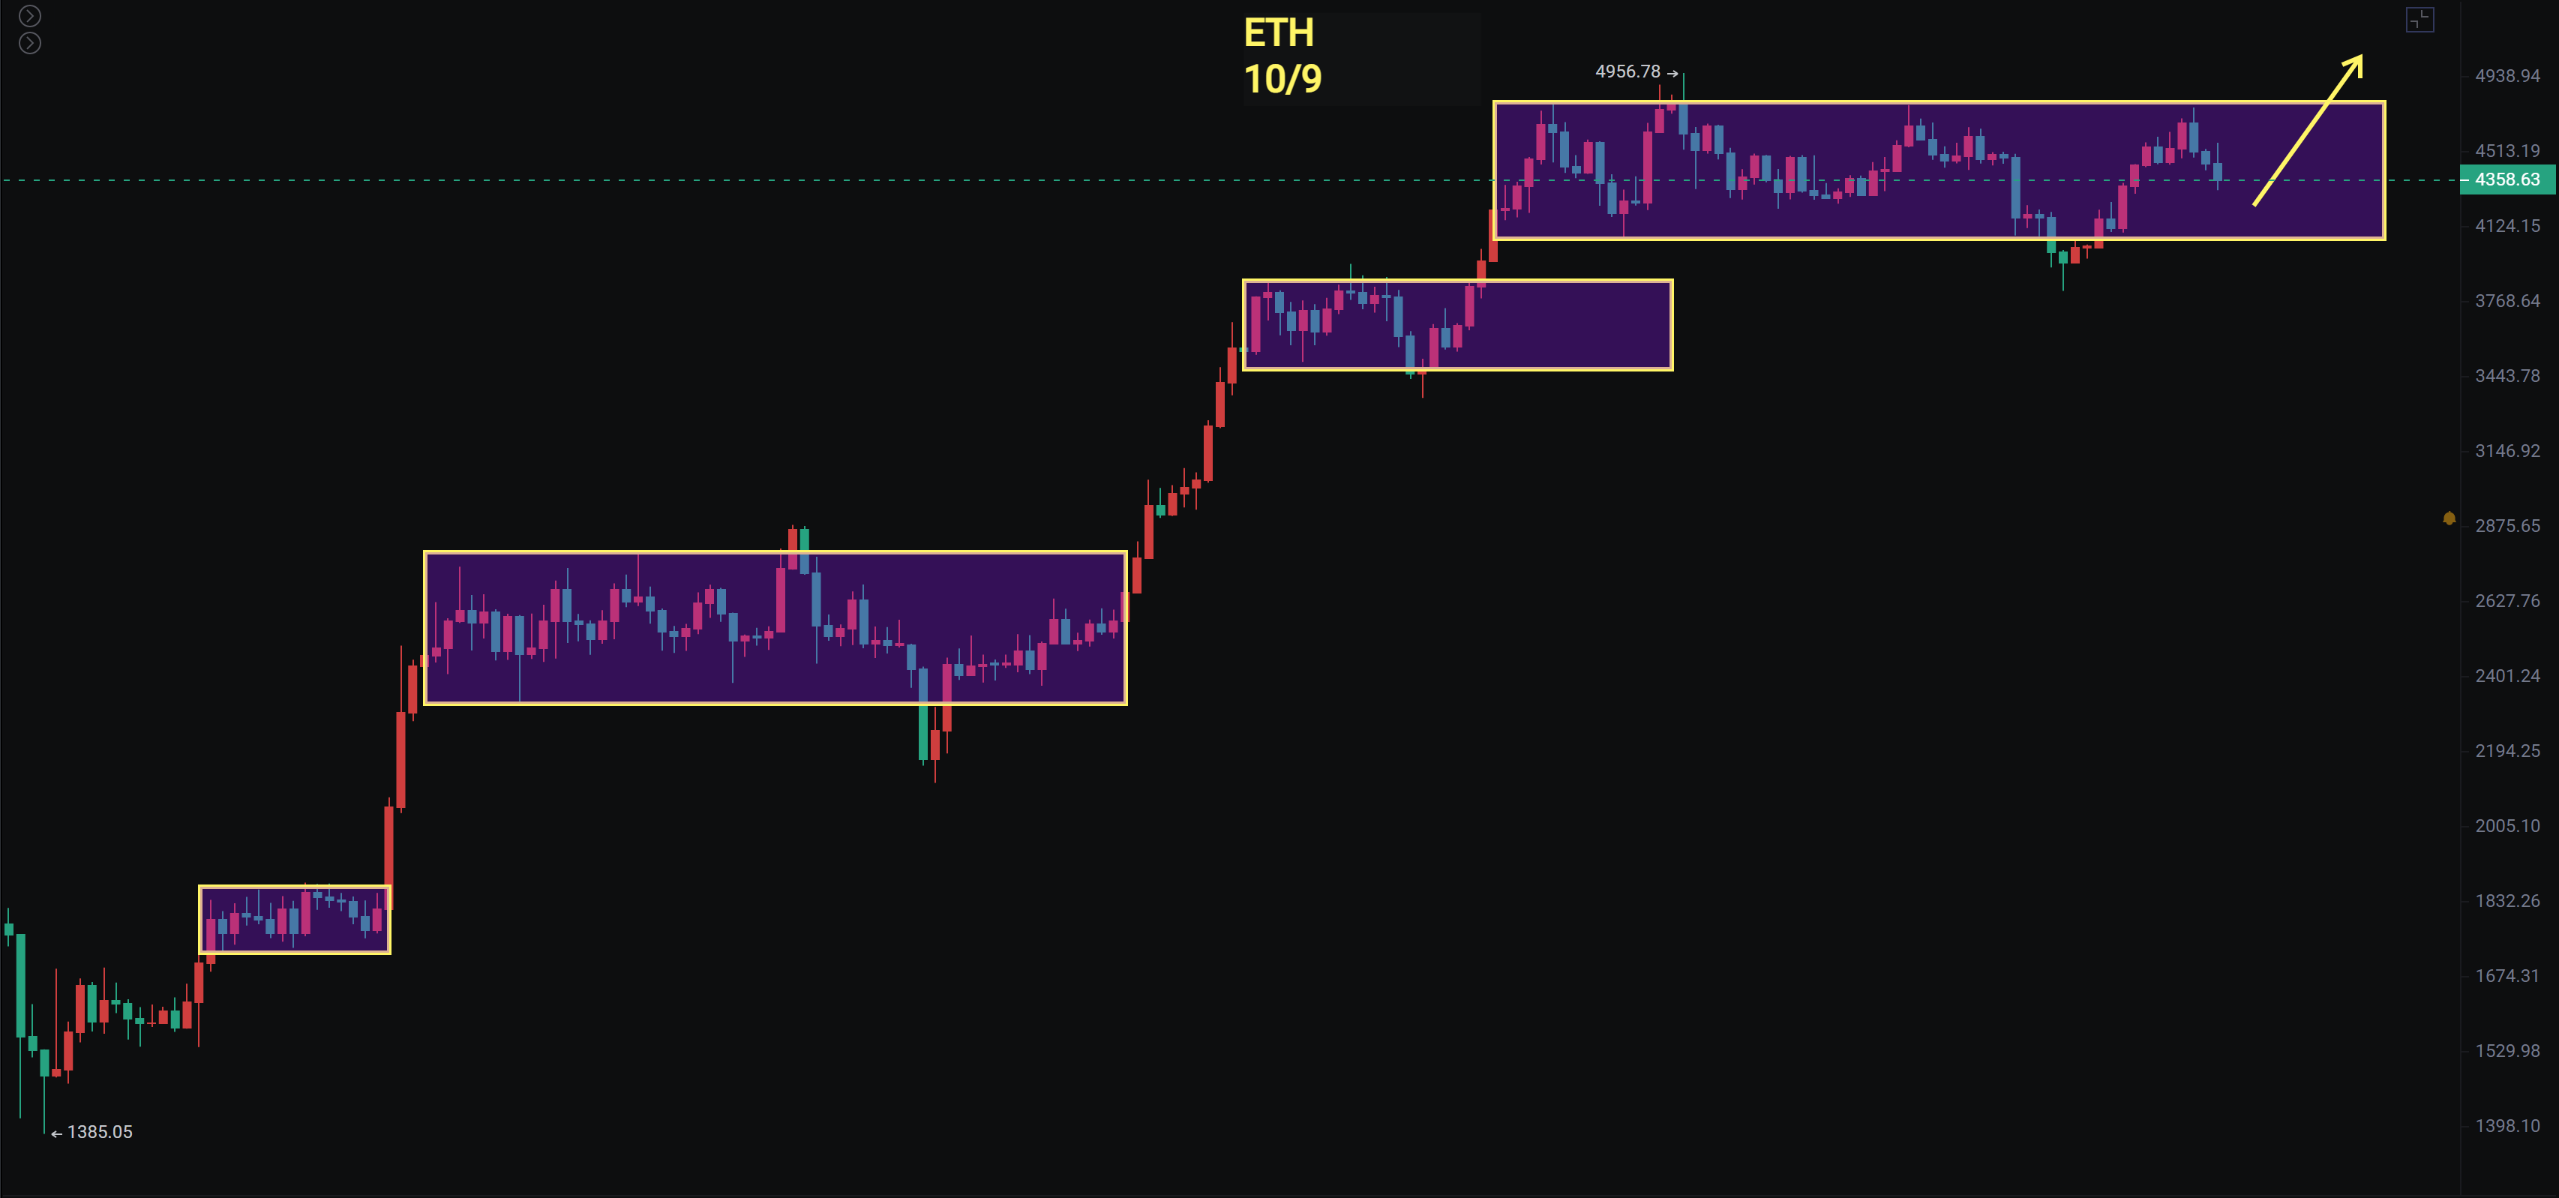
Ethereum's pullback is smoother, dropping to around 4,300 at the time of writing, with further support at 4,200 and 4,060.
In the altcoin sector, ZEC and ZEN have performed well in this wave, and BNB has reached a new high, presenting further opportunities after the pullback.
Bitcoin
The daily chart of Bitcoin has formed a bearish engulfing pattern after reaching a new high. Both yesterday and today have shown doji candles, with limited rebound height, currently testing support between 120,000 and 121,000.
On the 4-hour chart, the ascending support line has been broken, currently retracing between 0.382 and 0.236. Friends who previously went long may consider re-entering between 0.5 and 0.68, which is around 117,000 to 117,500. The overall probability of maintaining a range-bound movement on the daily chart has been high since mid-July, and the outlook for Q4 remains optimistic.
● Support: 117,000—117,500

● Resistance: 124,000—126,000
Ethereum
Ethereum's structure is still very clear, oscillating within the range, with recent support at 4,200. Since breaking through 4,100 on August 9, it has been in a range for 61 days. The analyst previously mentioned that from May to July, it also oscillated for more than two months, so after the recent false breakdown and recovery, it is best not to break down further; otherwise, the subsequent movement will be more troublesome.
The 4-hour chart is approaching the Fibonacci 0.5 retracement. Continuing downward, there will be support around 4,150 to 4,200, and one can consider entering long in batches.
● Support: 4,060—4,200

● Resistance: 4,560—4,755
If you like my views, please like, comment, and share. Let's navigate through the bull and bear markets together!!!
The article is time-sensitive and for reference only, updated in real-time.
Focusing on K-line technical research, sharing global investment opportunities. Public account: BTC Trading Analyst Fusu

免责声明:本文章仅代表作者个人观点,不代表本平台的立场和观点。本文章仅供信息分享,不构成对任何人的任何投资建议。用户与作者之间的任何争议,与本平台无关。如网页中刊载的文章或图片涉及侵权,请提供相关的权利证明和身份证明发送邮件到support@aicoin.com,本平台相关工作人员将会进行核查。


