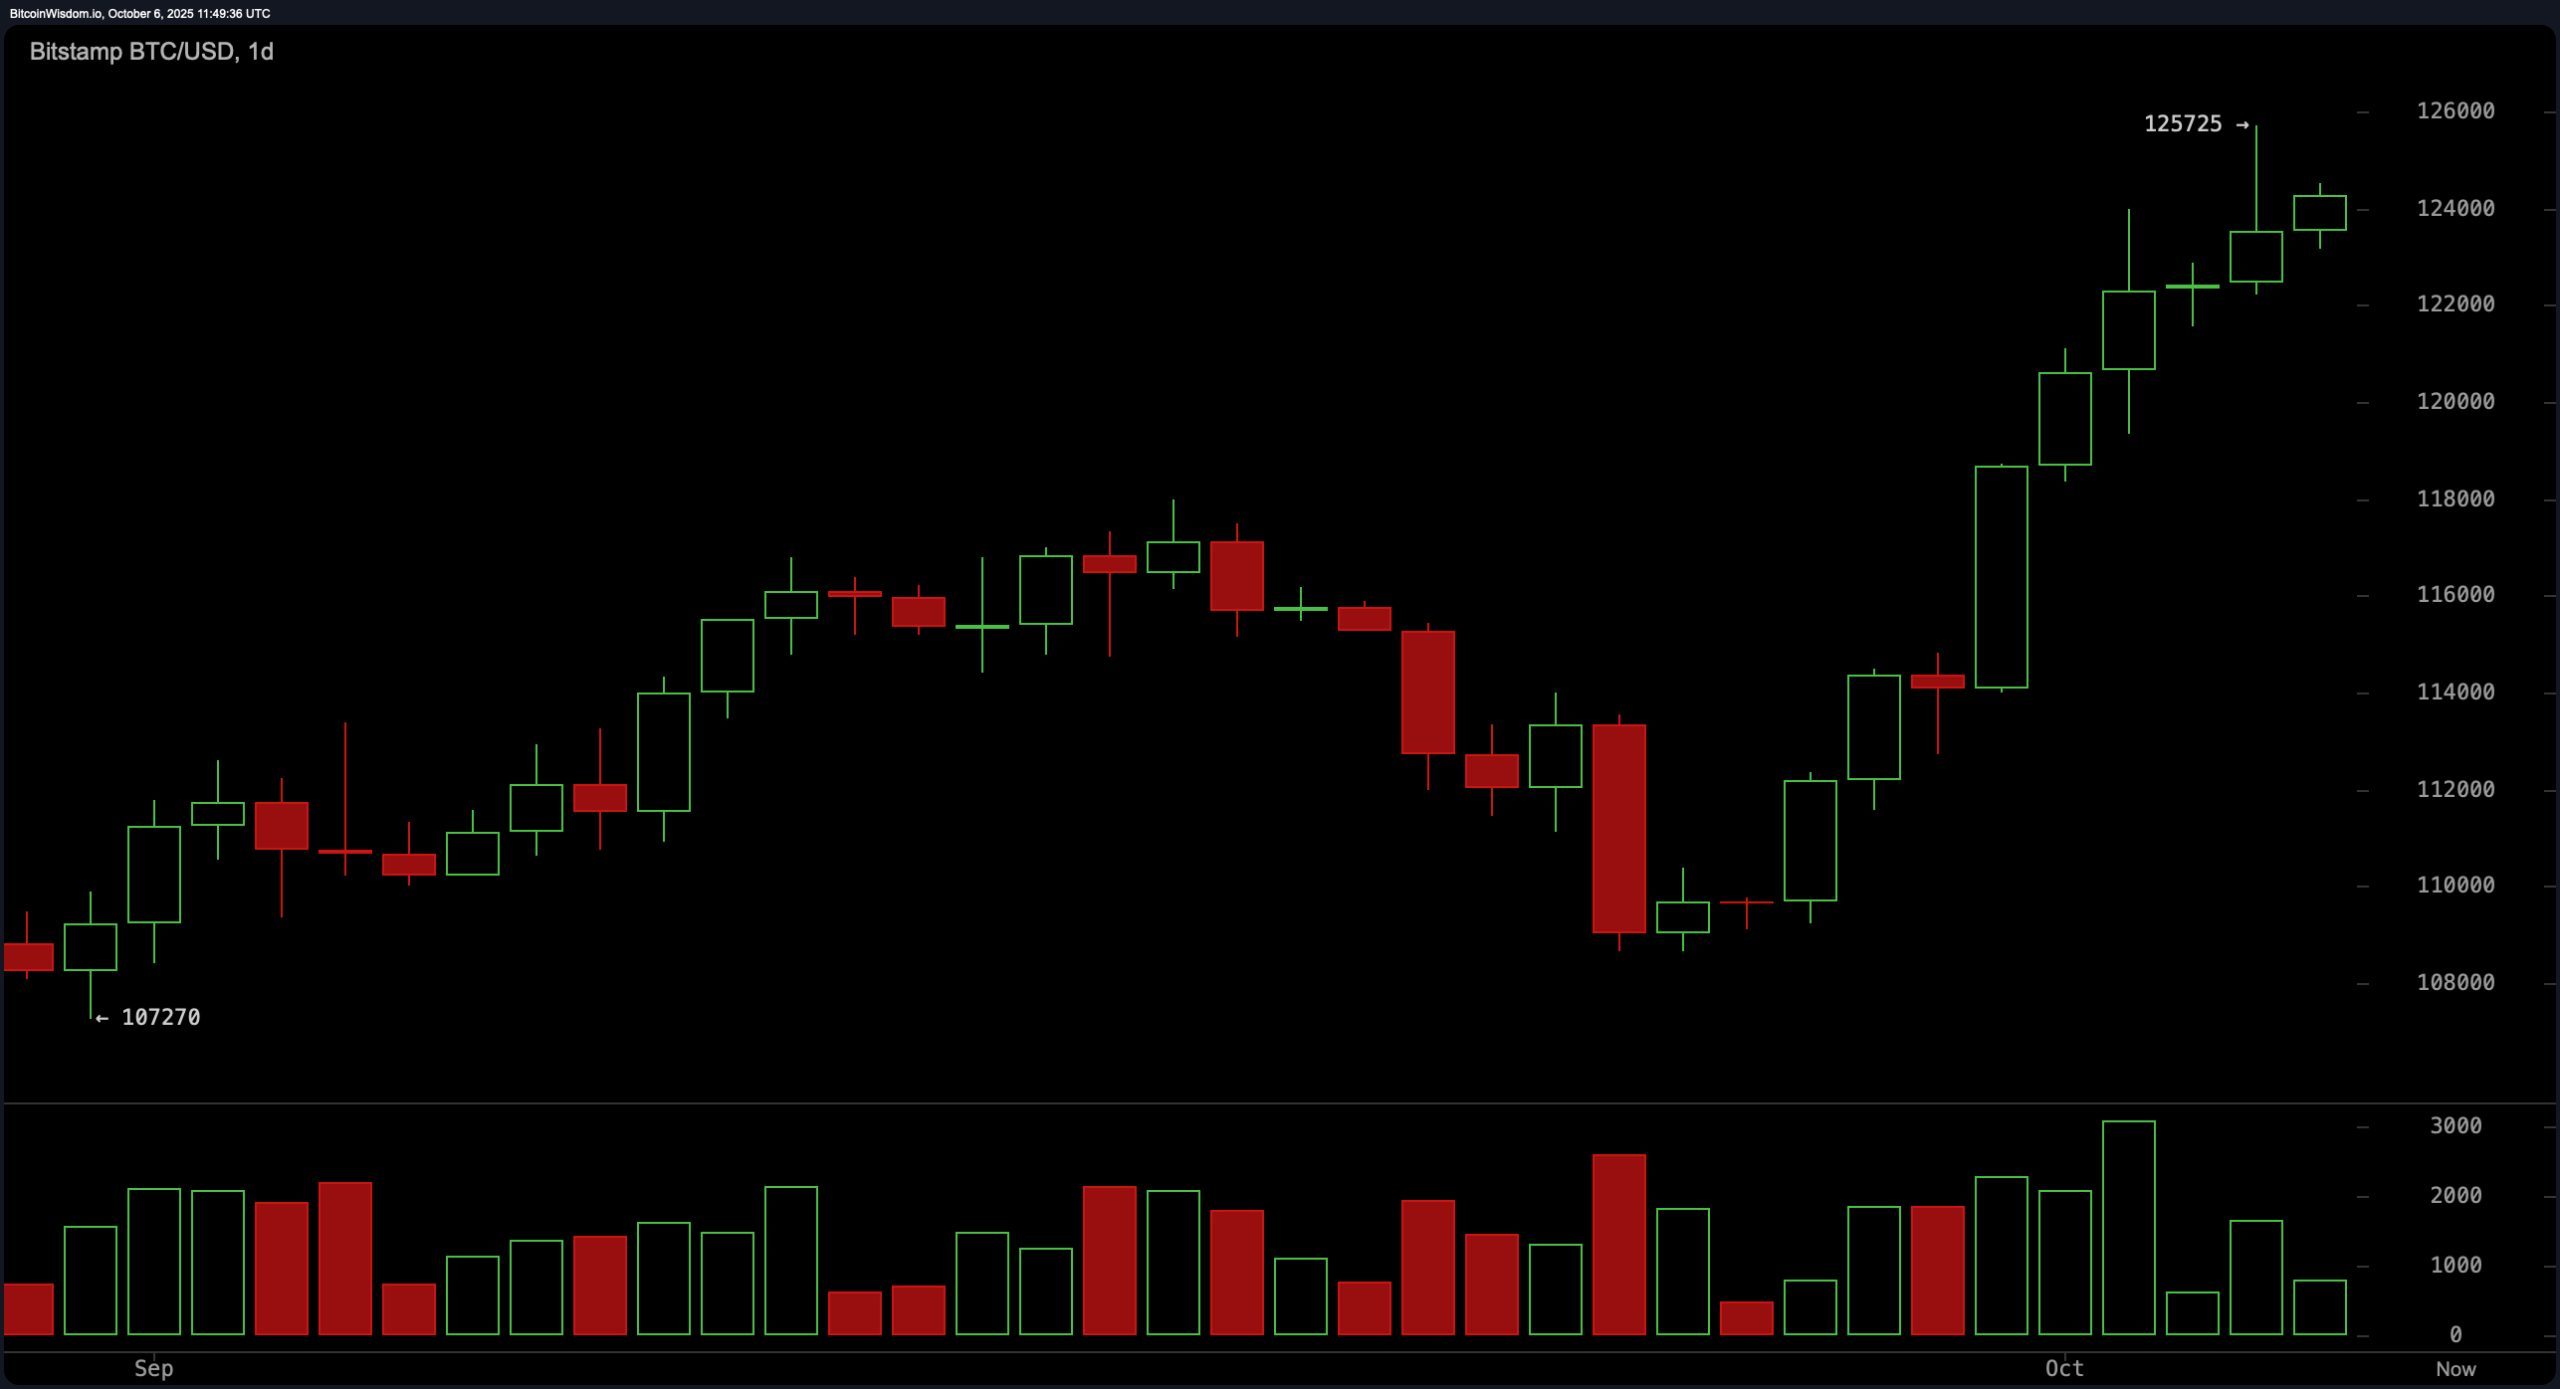
Let’s not sugarcoat it—this daily chart is straight-up flexing. After blasting through resistance near $110,000, bitcoin rampaged to $125,725 on increasing volume, flashing textbook breakout behavior. But just when the bulls thought it was safe to celebrate, we’re seeing smaller candles—tiny indecision signals—creeping into the picture like unwanted party guests.
With support at $120,000 and $116,000, a buy-the-dip opportunity may bloom between $120,000 and $122,000. But let’s be clear: if bitcoin fumbles at $125,725 again, it could cue the bears off the bench.

BTC/USD 1-day chart via Bitstamp on Oct. 6, 2025.
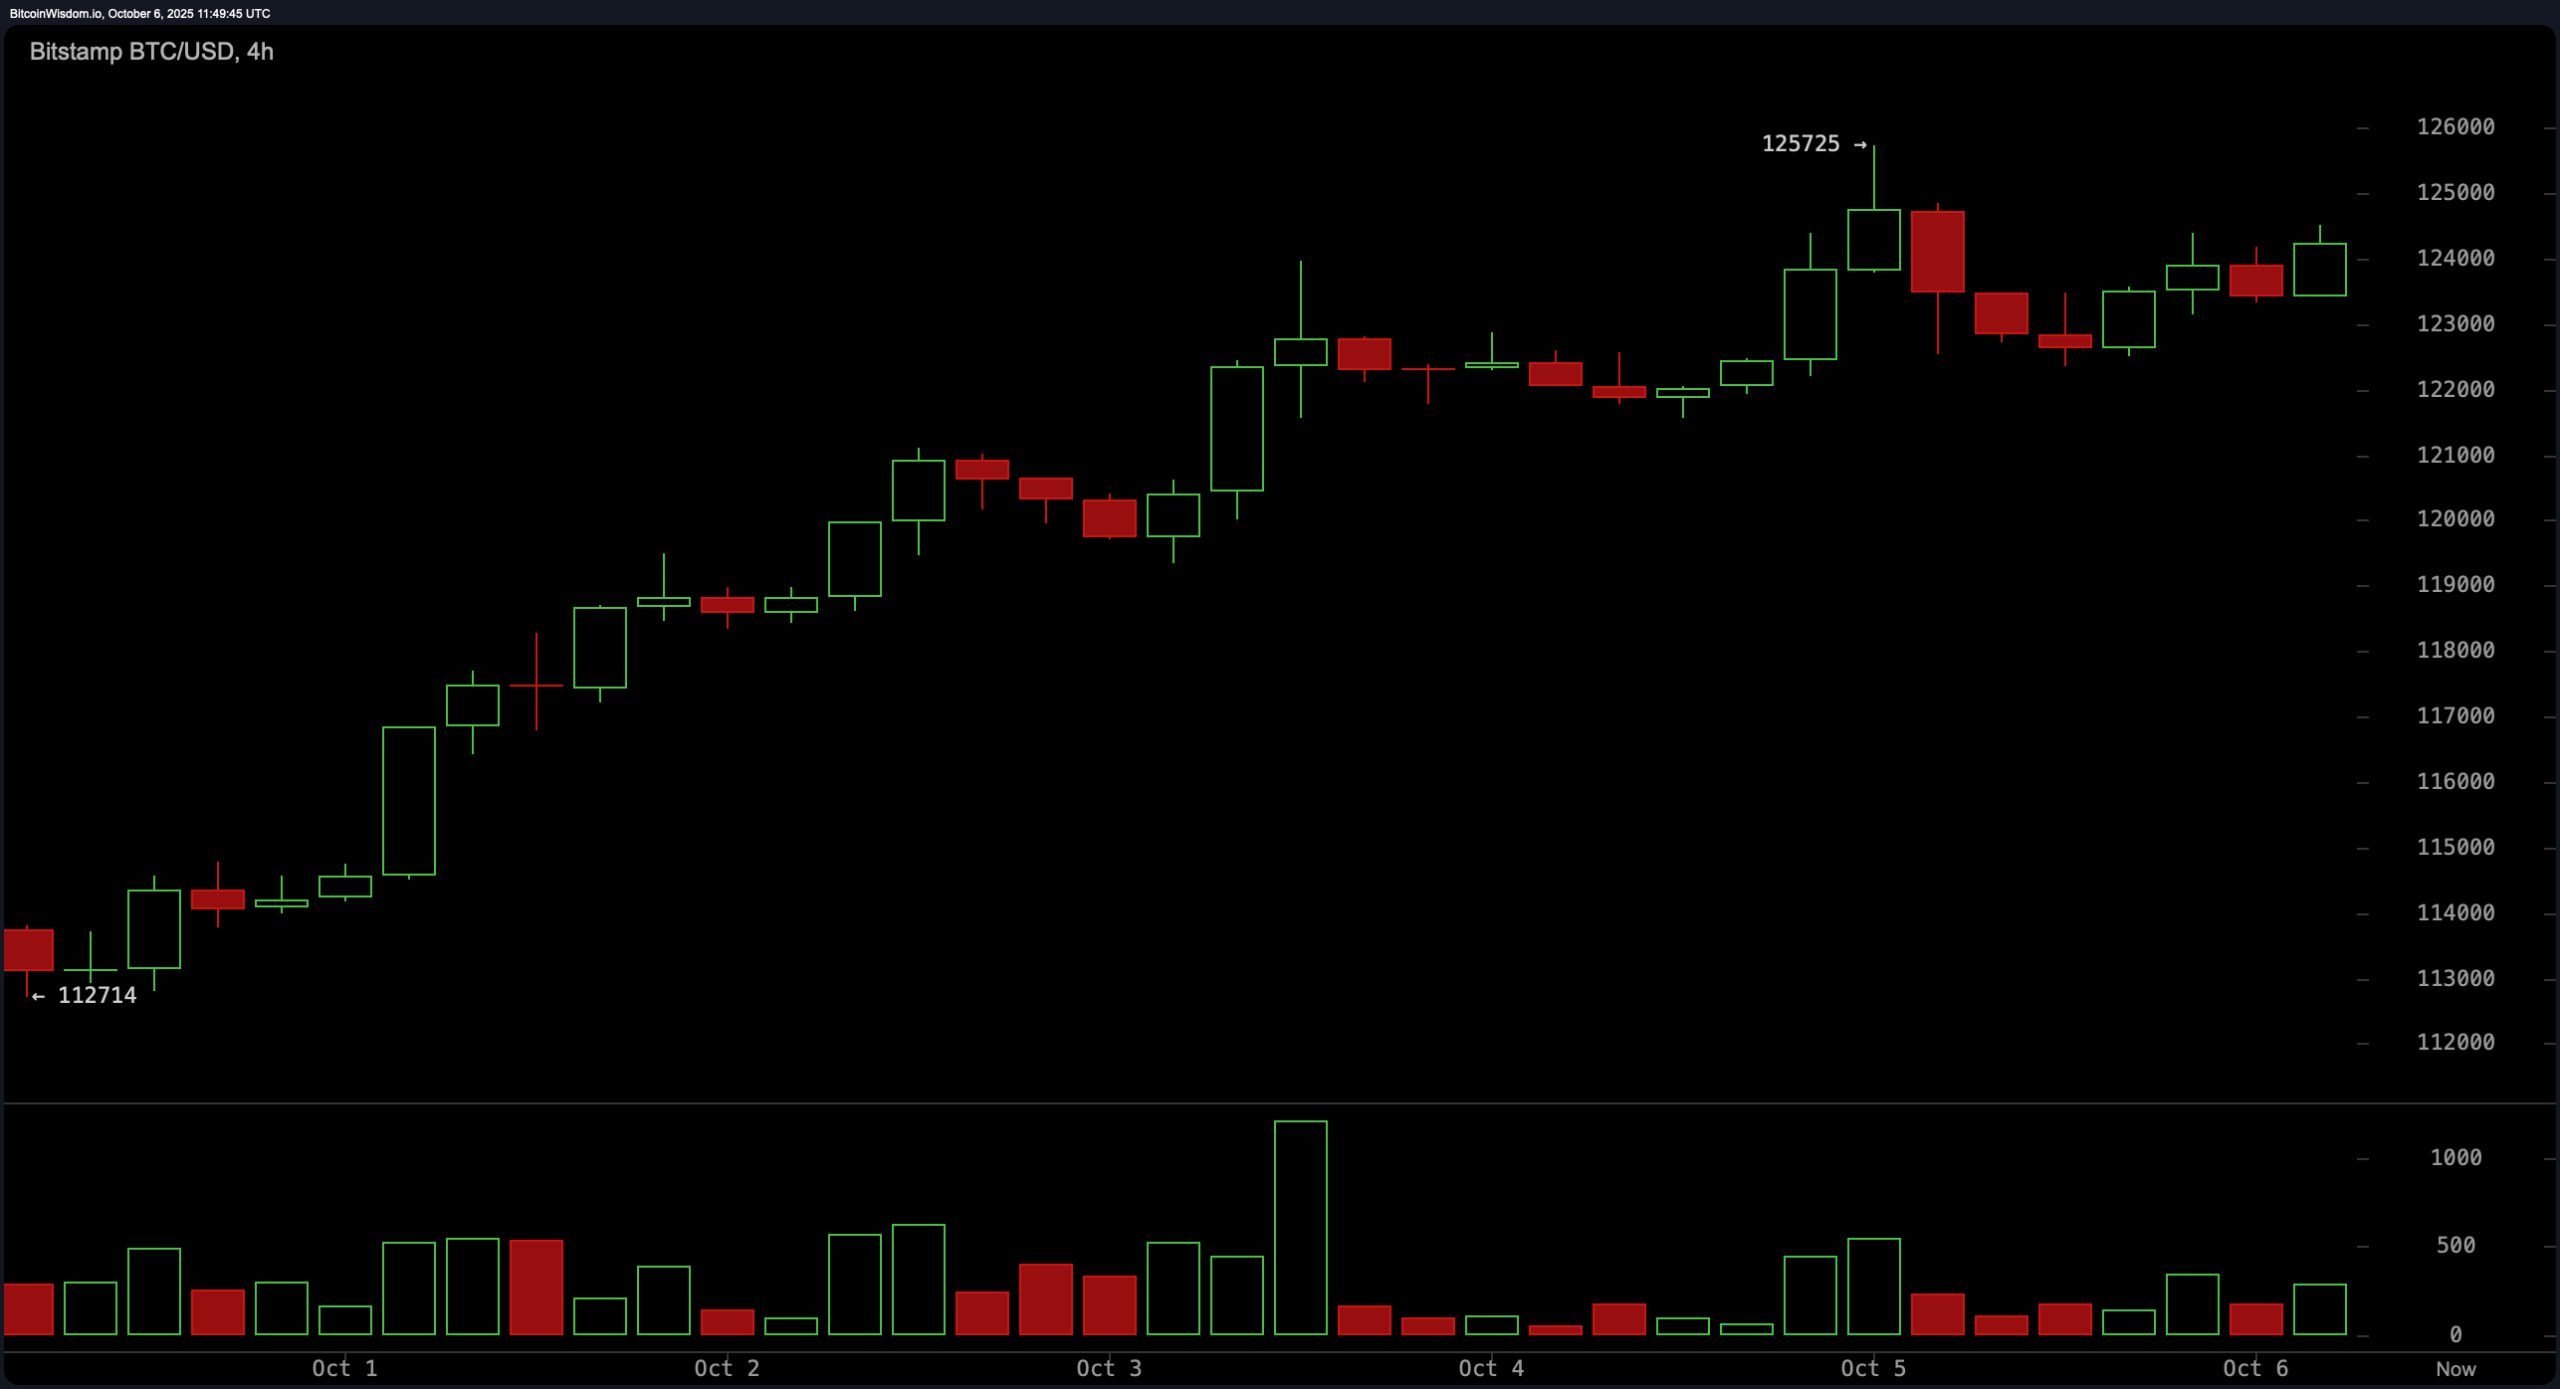
Zoom into the 4-hour chart and we’re entering drama queen territory. bitcoin topped out, pulled back, and is now grinding sideways with the energy of a phone battery at 3%. This consolidation phase could go either way—especially with volume drying up like altcoin hype after a rug pull. Key support stands at $122,500 and $121,000, while resistance keeps teasing just above $125,000. If bitcoin can punch through with conviction, we’re talking a ride to the moon; fail again, and it’s déjà vu of a double top.

BTC/USD 4-hour chart via Bitstamp on Oct. 6, 2025.
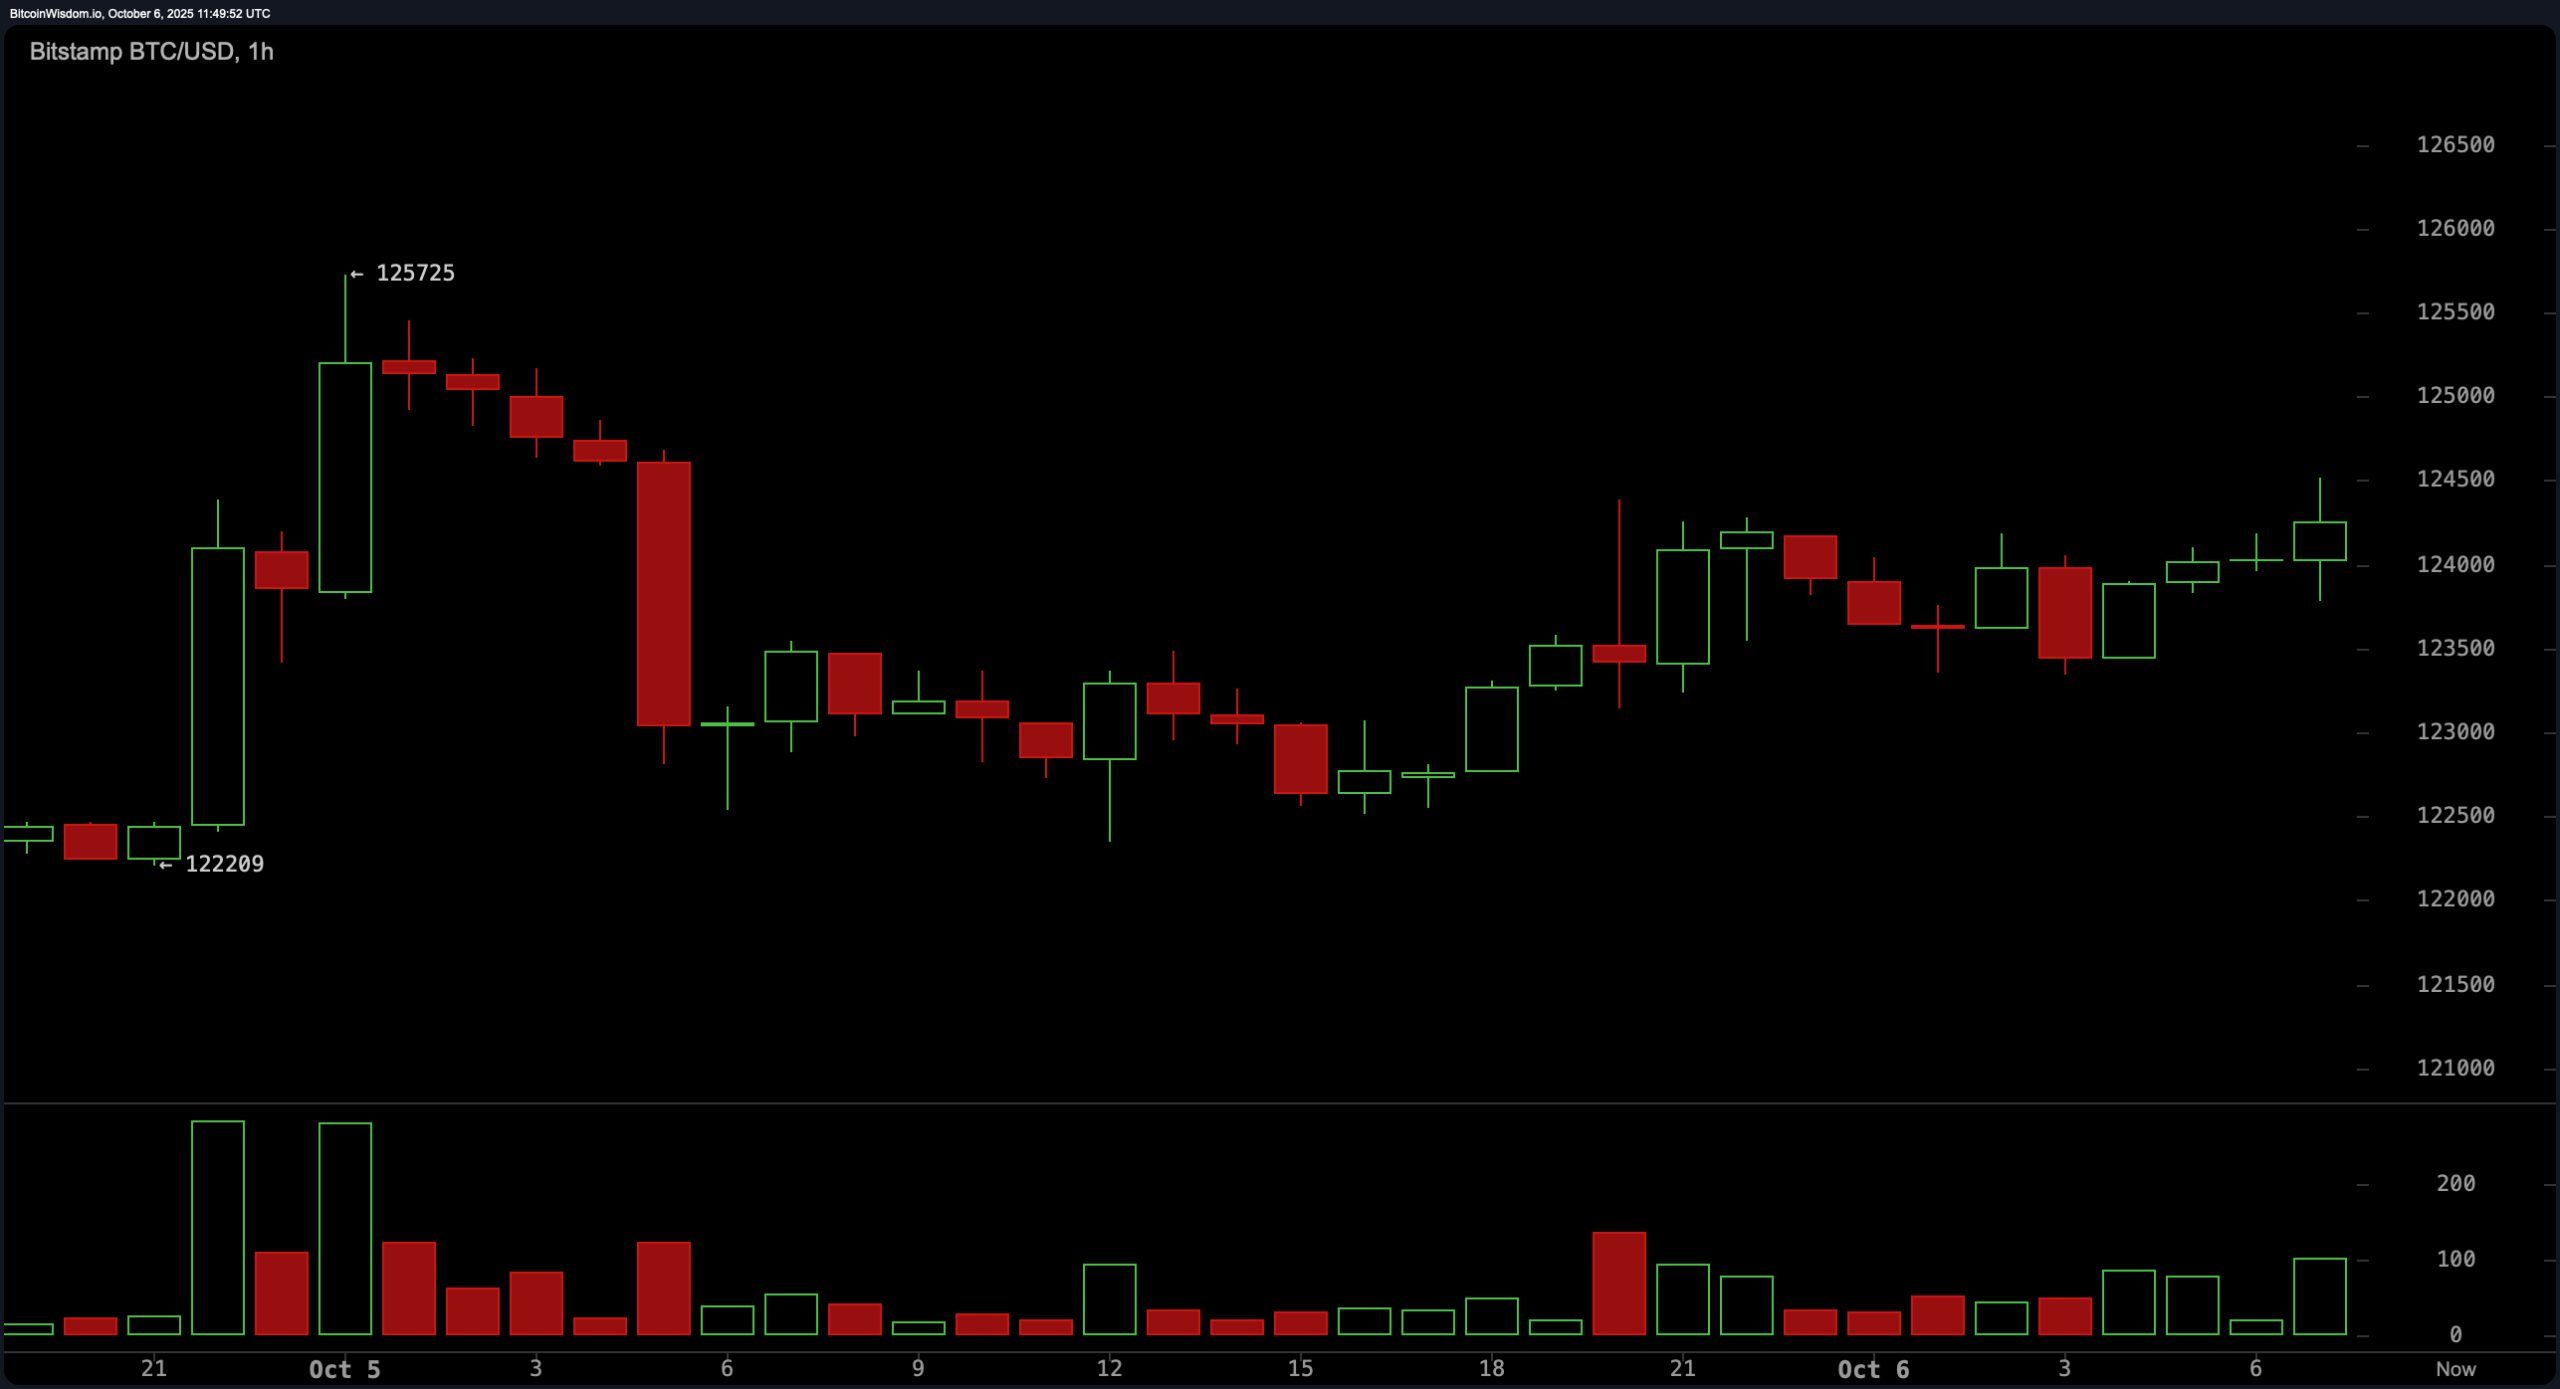
The 1-hour chart is basically the tea leaves of price action right now. We’ve got a triangle formation—lower highs, higher lows, and a squeeze tighter than crypto Twitter on a red day. Support at $123,000 is hanging on, resistance at $124,500 is looming, and volatility is simmering like it’s prepping for a blowout. A breakout above $124,500 with volume could fuel another shot at $125,700. Drop below $123,000? Strap in for a potential dip to $121,500.

BTC/USD 1-hour chart via Bitstamp on Oct. 6, 2025.
Oscillators are serving mixed signals like a brunch buffet. The relative strength index (RSI) sits at 72—technically neutral, but let’s be honest, it’s flirting with overbought. The Stochastic is at 90 and equally neutral, while the commodity channel index (CCI) says things are bearish at 151. Meanwhile, momentum is screaming “bullish” at 14,591 and the moving average convergence divergence (MACD) confirms with a positive signal at 2,400. Translation? The market’s loaded with heat, but some indicators are starting to sweat.
Moving averages are downright euphoric. Every single short, medium, and long-term indicator—from the exponential moving average (EMA) to the simple moving average (SMA)—is in full-blown bullish mode. The 10-day EMA is holding at $119,633, the 50-day SMA at $114,001, and the 200-day EMA at a comfy $107,347. The technical trend is bullish across the board, but the real action will come down to volume—because as every seasoned trader knows, breakouts without volume are just noise dressed as news.
Bull Verdict:
If volume kicks in and bitcoin breaks $125,725, bulls could have front-row seats to price discovery with $130,000 in sight. All technical roads point north, and any dip near $120,000 might just be the market’s way of saying “last call” before liftoff.
Bear Verdict:
Failure to clear $125,000 and a breakdown below $123,000 could flip this party into a hangover. With momentum peaking and some oscillators flashing warning signs, the bears could find their opening if support at $120,000 crumbles.
免责声明:本文章仅代表作者个人观点,不代表本平台的立场和观点。本文章仅供信息分享,不构成对任何人的任何投资建议。用户与作者之间的任何争议,与本平台无关。如网页中刊载的文章或图片涉及侵权,请提供相关的权利证明和身份证明发送邮件到support@aicoin.com,本平台相关工作人员将会进行核查。


