The daily chart is painting a recovery masterpiece. After an early stumble that dragged prices from nearly $4,768 to a sobering low of $3,820, ethereum bounced back like a caffeinated kangaroo. Multiple green daily candlesticks have strutted in, setting higher highs and higher lows, while increased volume on the up days implies this isn’t just hopium—it’s bullish conviction.
This bullish reversal pattern is textbook technical analysis, and ethereum seems to be taking notes. The $4,400–$4,450 zone is shaping up as a healthy pullback entry point, while resistance in the $4,750–$4,800 range lurks like a bouncer at a velvet-rope club.
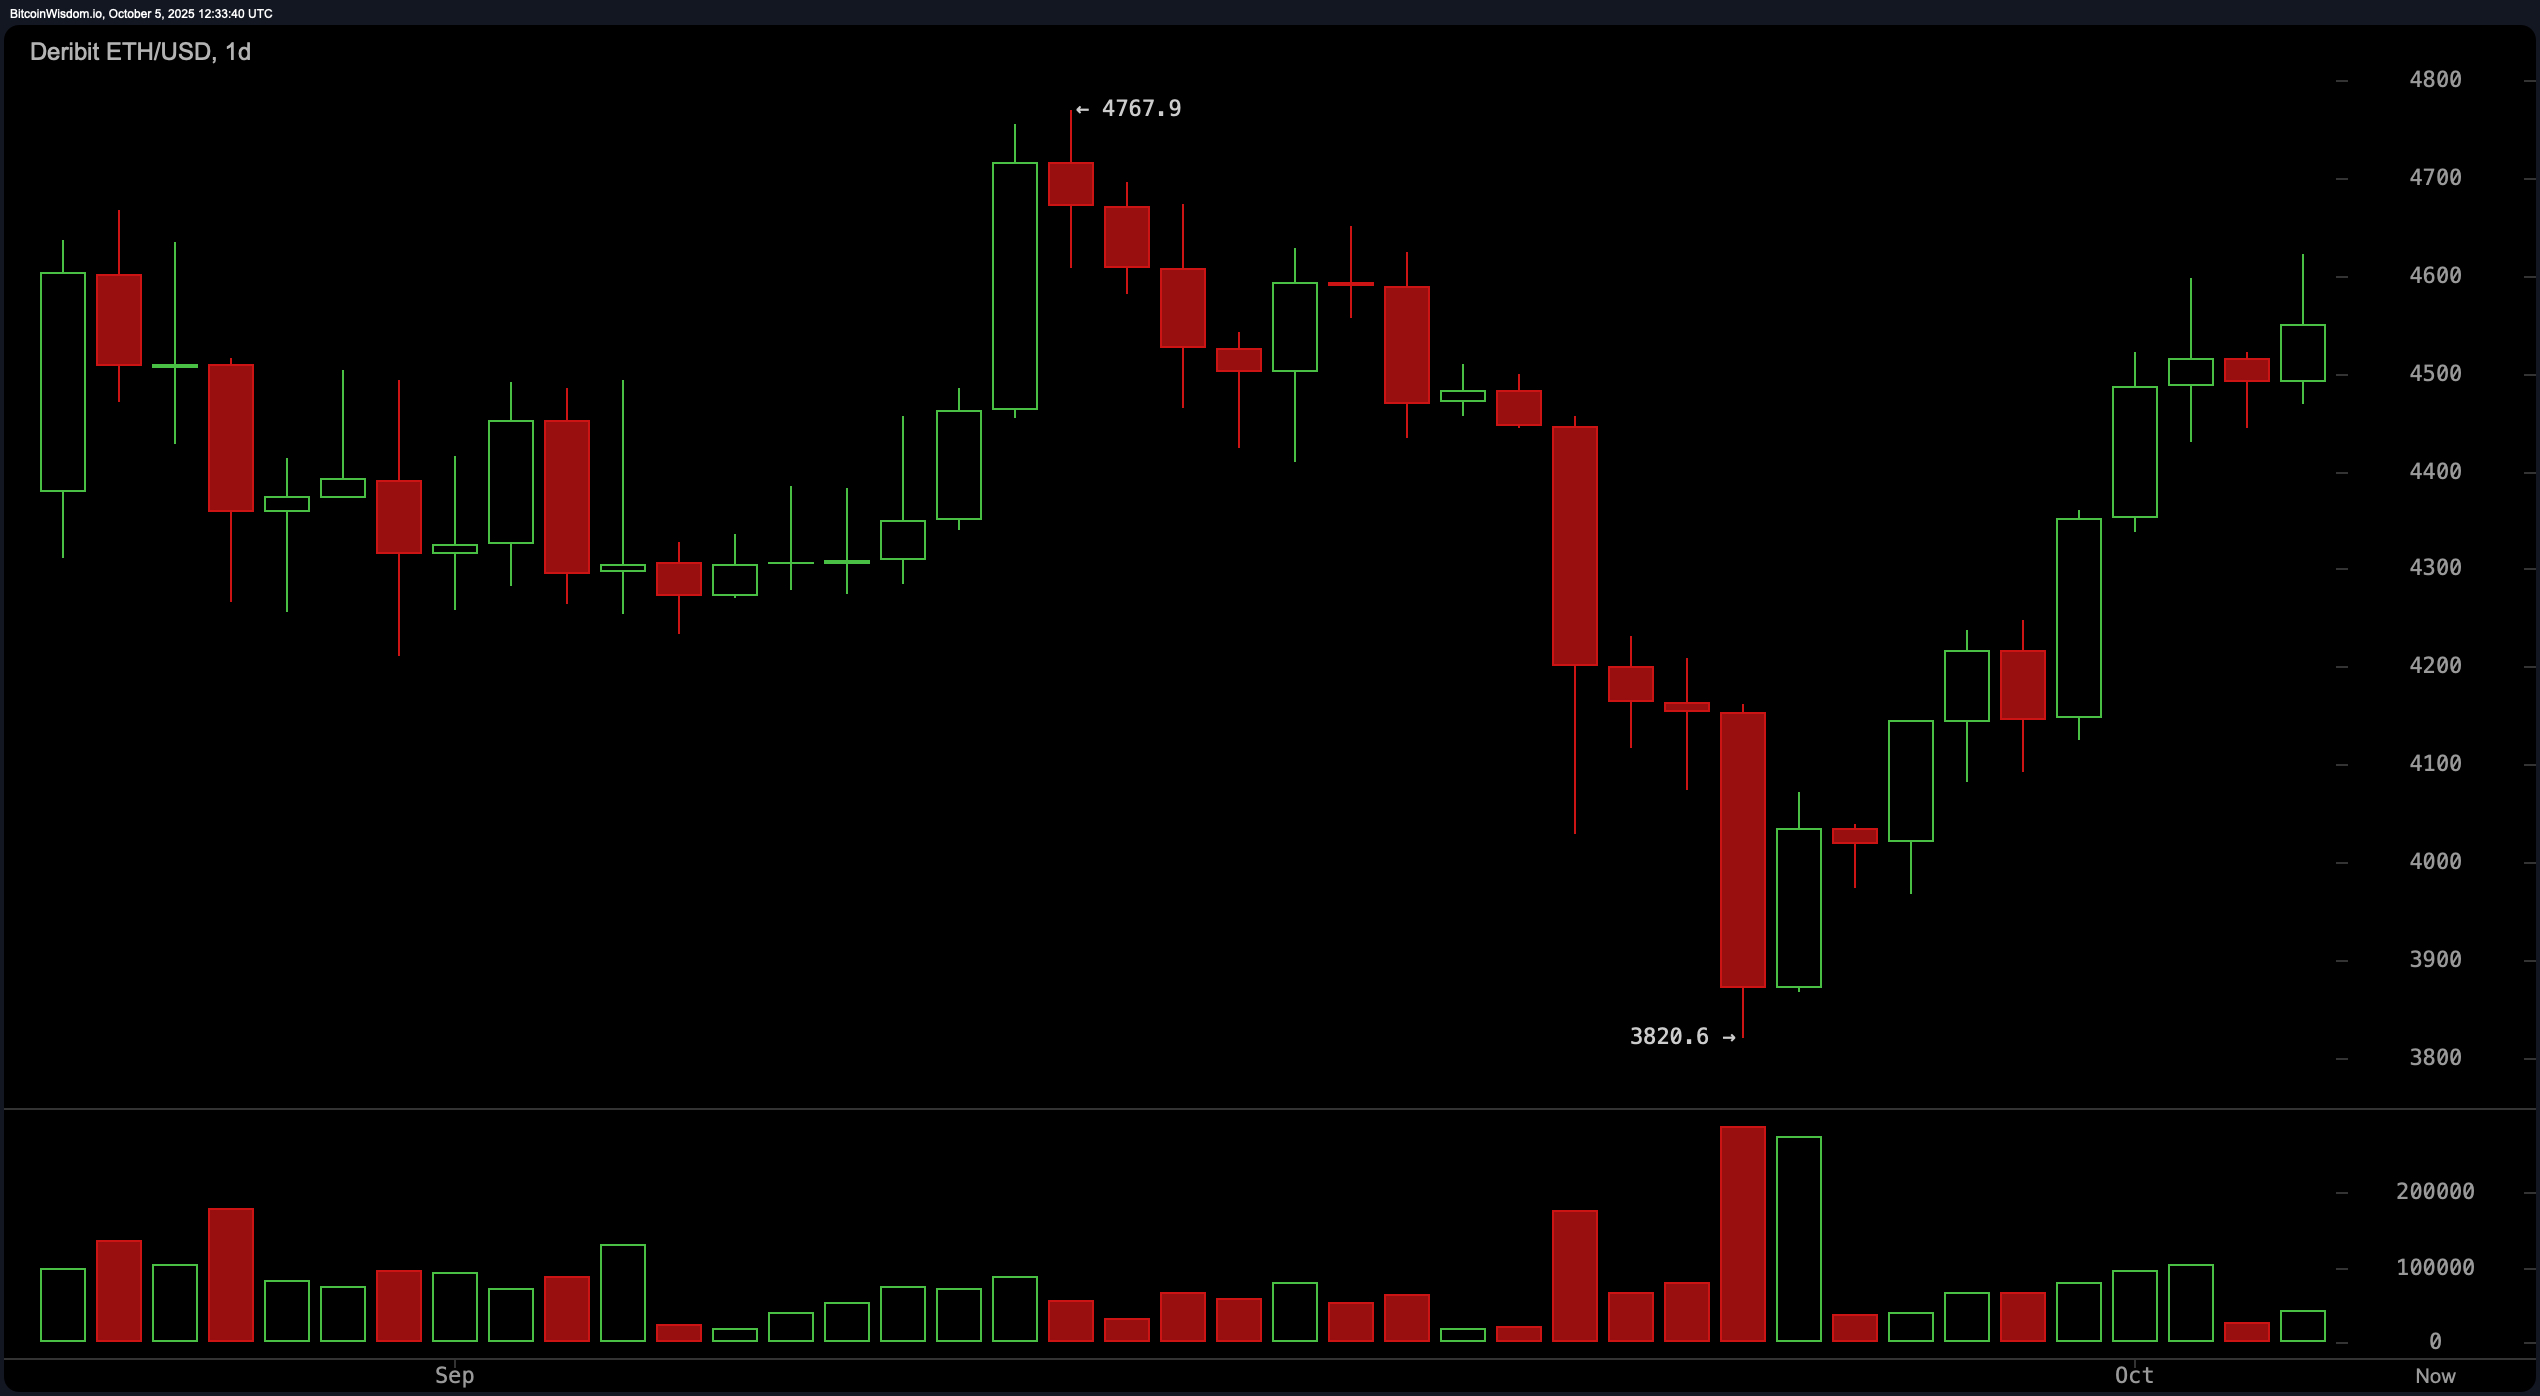
ETH/USD 1-day chart via Deribit on Oct. 5, 2025.
Zooming into the four-hour chart, we find ethereum still flexing its bullish muscles, with a recent low at $4,038.6 and a high around $4,621.9. It’s strutting up the trend runway with a clean stair-step pattern—each dip getting eaten faster than snacks at a trader’s desk. However, it’s now pausing just under $4,620, flirting with the idea of a bullish flag or a mini-distribution phase. Traders should keep eyes peeled: a breakout above $4,620 with solid volume could rocket this asset toward its next rendezvous with resistance at $4,750+. That said, a dip to the $4,450–$4,500 zone still presents a solid long setup.
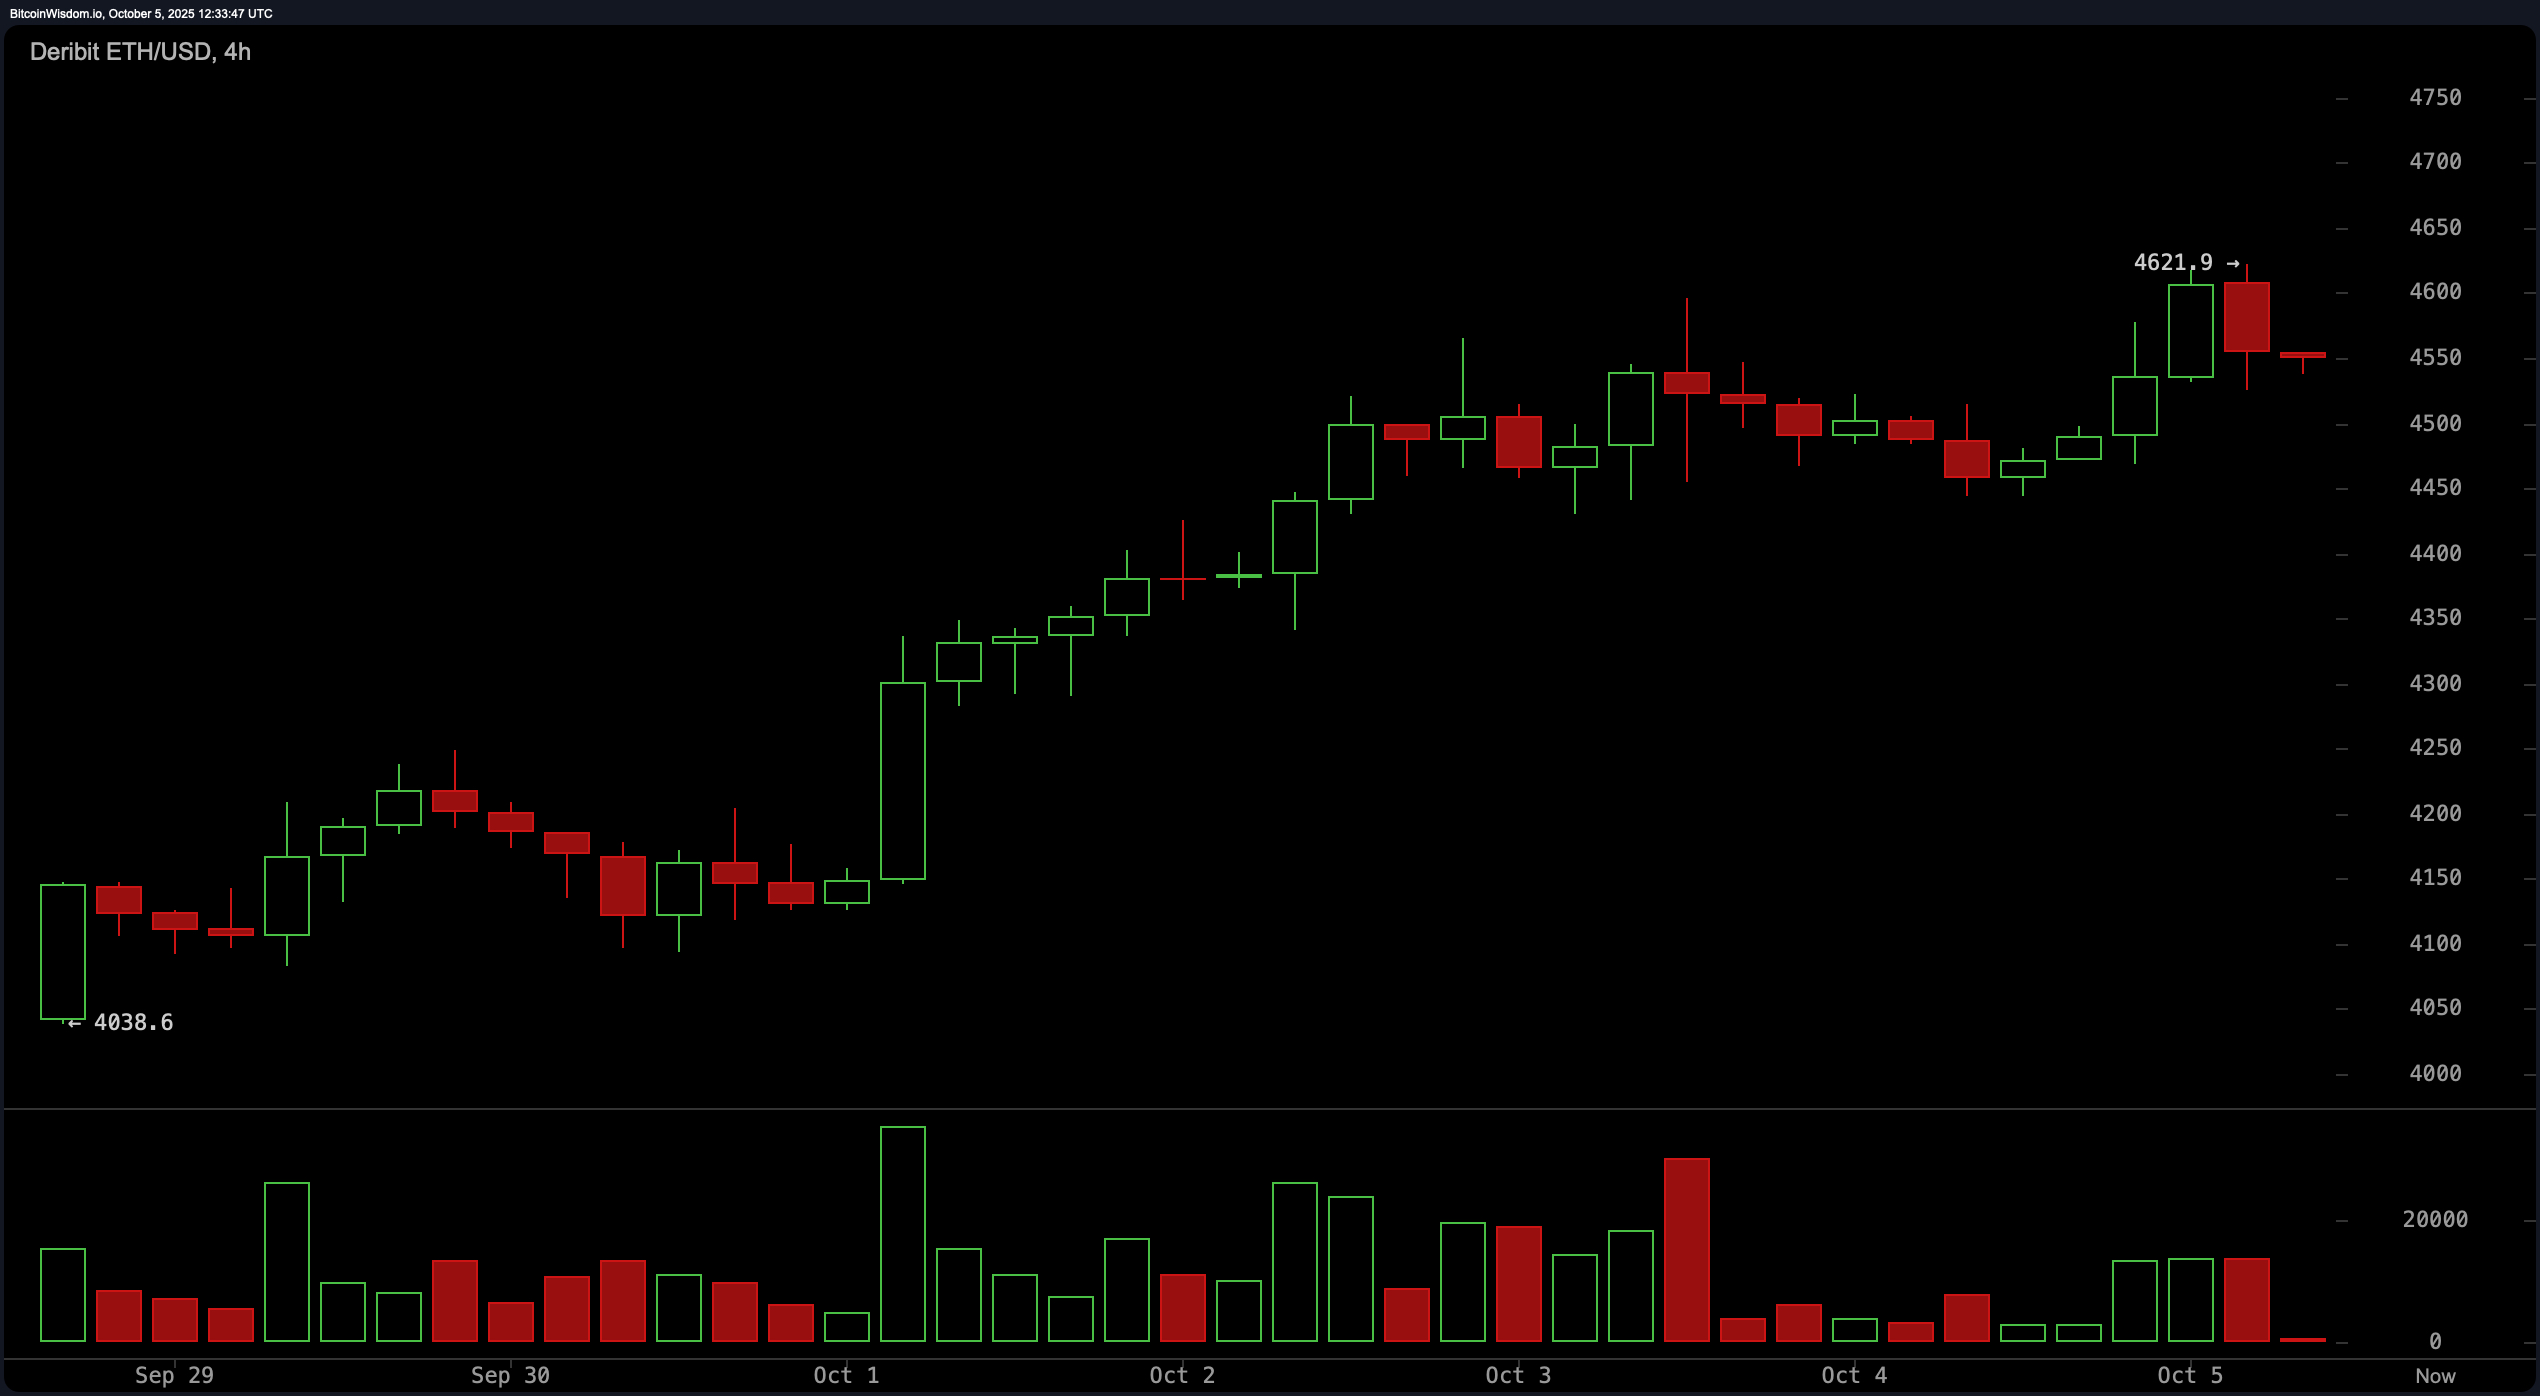
ETH/USD 4-hour chart via Deribit on Oct. 5, 2025.
Now let’s talk hourly—because the 1-hour chart is the mood ring of short-term sentiment. ethereum is consolidating with a coy series of lower highs but hasn’t fully surrendered to bearish pressure. Local support around $4,443 is holding, and unless that level breaks, the bulls are still in the ring. This timeframe does suggest waning momentum, so while the overall trend is your friend, caution is your co-pilot. Scalpers may look to long near $4,480–$4,500 with tight stops, but if $4,440 gives way, expect a trip down to $4,350 faster than you can say “stop-loss.”
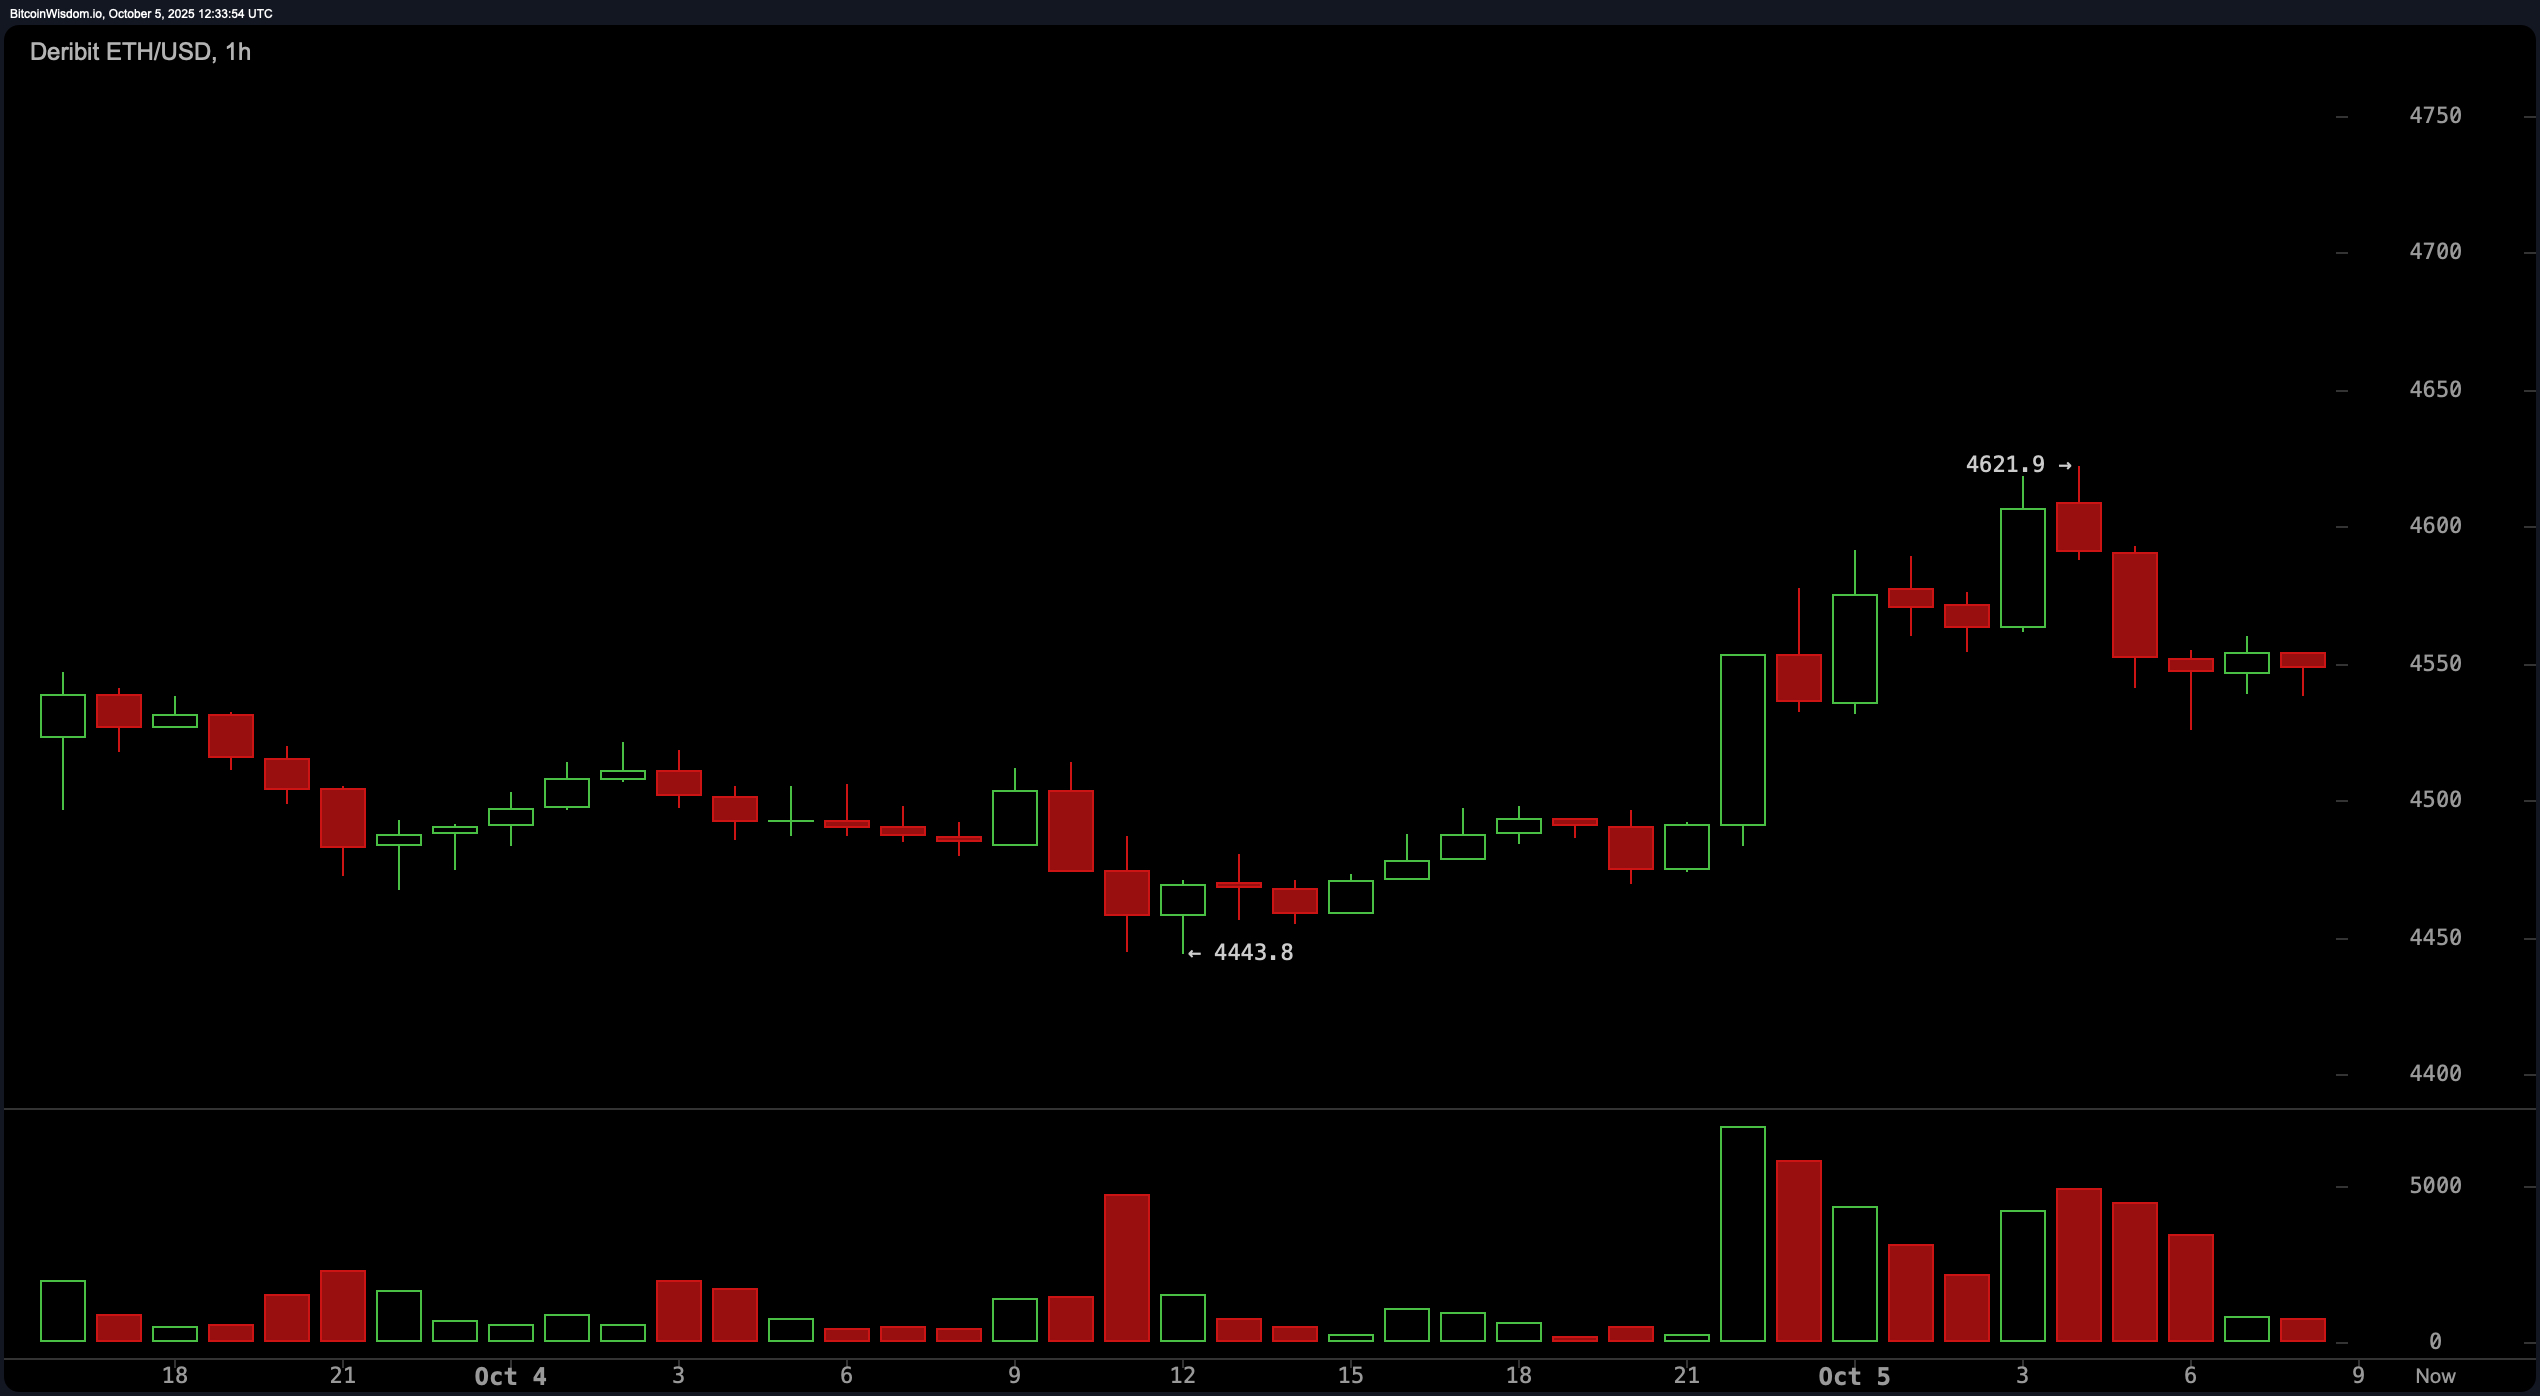
ETH/USD 1-hour chart via Deribit on Oct. 5, 2025.
The oscillators are giving us the crypto equivalent of a poker face. The relative strength index (RSI) is perched at 58.8, firmly neutral, while the Stochastic oscillator at 88.9 is also in no-man’s land. The commodity channel index (CCI) at 80.1 and the average directional index (ADX) at 19.5 both confirm a lack of extreme conditions. The awesome oscillator, reading 86.0, remains indecisive, though the momentum indicator at 671.1 and the moving average convergence divergence (MACD) level at 21.0 are both giving a bullish signal. Translation: the trend might be chill, but momentum is whispering sweet nothings in the bulls’ ears.
And don’t even get me started on the moving averages—because they’re basically throwing a green party. Every major exponential moving average (EMA) and simple moving average (SMA)—from the 10-period to the 200-period—is flashing bullish signals like a neon sign outside a Vegas casino. Whether it’s the EMA (10) at $4,376.9 or the SMA (200) down at $3,038.8, the alignment screams trend continuation. If you’re bearish here, you’re basically betting against gravity while wearing flip-flops at the top of a water slide.
Bottom line: ethereum is in a bullish trend, buoyed by momentum and supported by technically solid zones. Short-term consolidation may keep things interesting, but as long as $4,450 holds and volume remains loyal, ethereum could be lining up for another leg up. Just keep one eye on resistance—and the other on your stop-loss.
Bull Verdict:
The technical landscape for ethereum currently favors a bullish continuation. Supported by strong momentum indicators, consistently higher lows, and universal buy signals from all major moving averages, the asset is well-positioned to test overhead resistance near $4,750. A confirmed breakout above this level could lead to further gains, provided volume and broader market sentiment remain aligned.
Bear Verdict:
Despite ethereum’s recent recovery, signs of slowing momentum and near-term consolidation suggest caution. Failure to hold support near $4,450, coupled with weakening oscillator strength, could result in a retracement toward $4,350 or lower. Without a clear breakout above resistance, upside potential may remain capped in the short term.
免责声明:本文章仅代表作者个人观点,不代表本平台的立场和观点。本文章仅供信息分享,不构成对任何人的任何投资建议。用户与作者之间的任何争议,与本平台无关。如网页中刊载的文章或图片涉及侵权,请提供相关的权利证明和身份证明发送邮件到support@aicoin.com,本平台相关工作人员将会进行核查。


