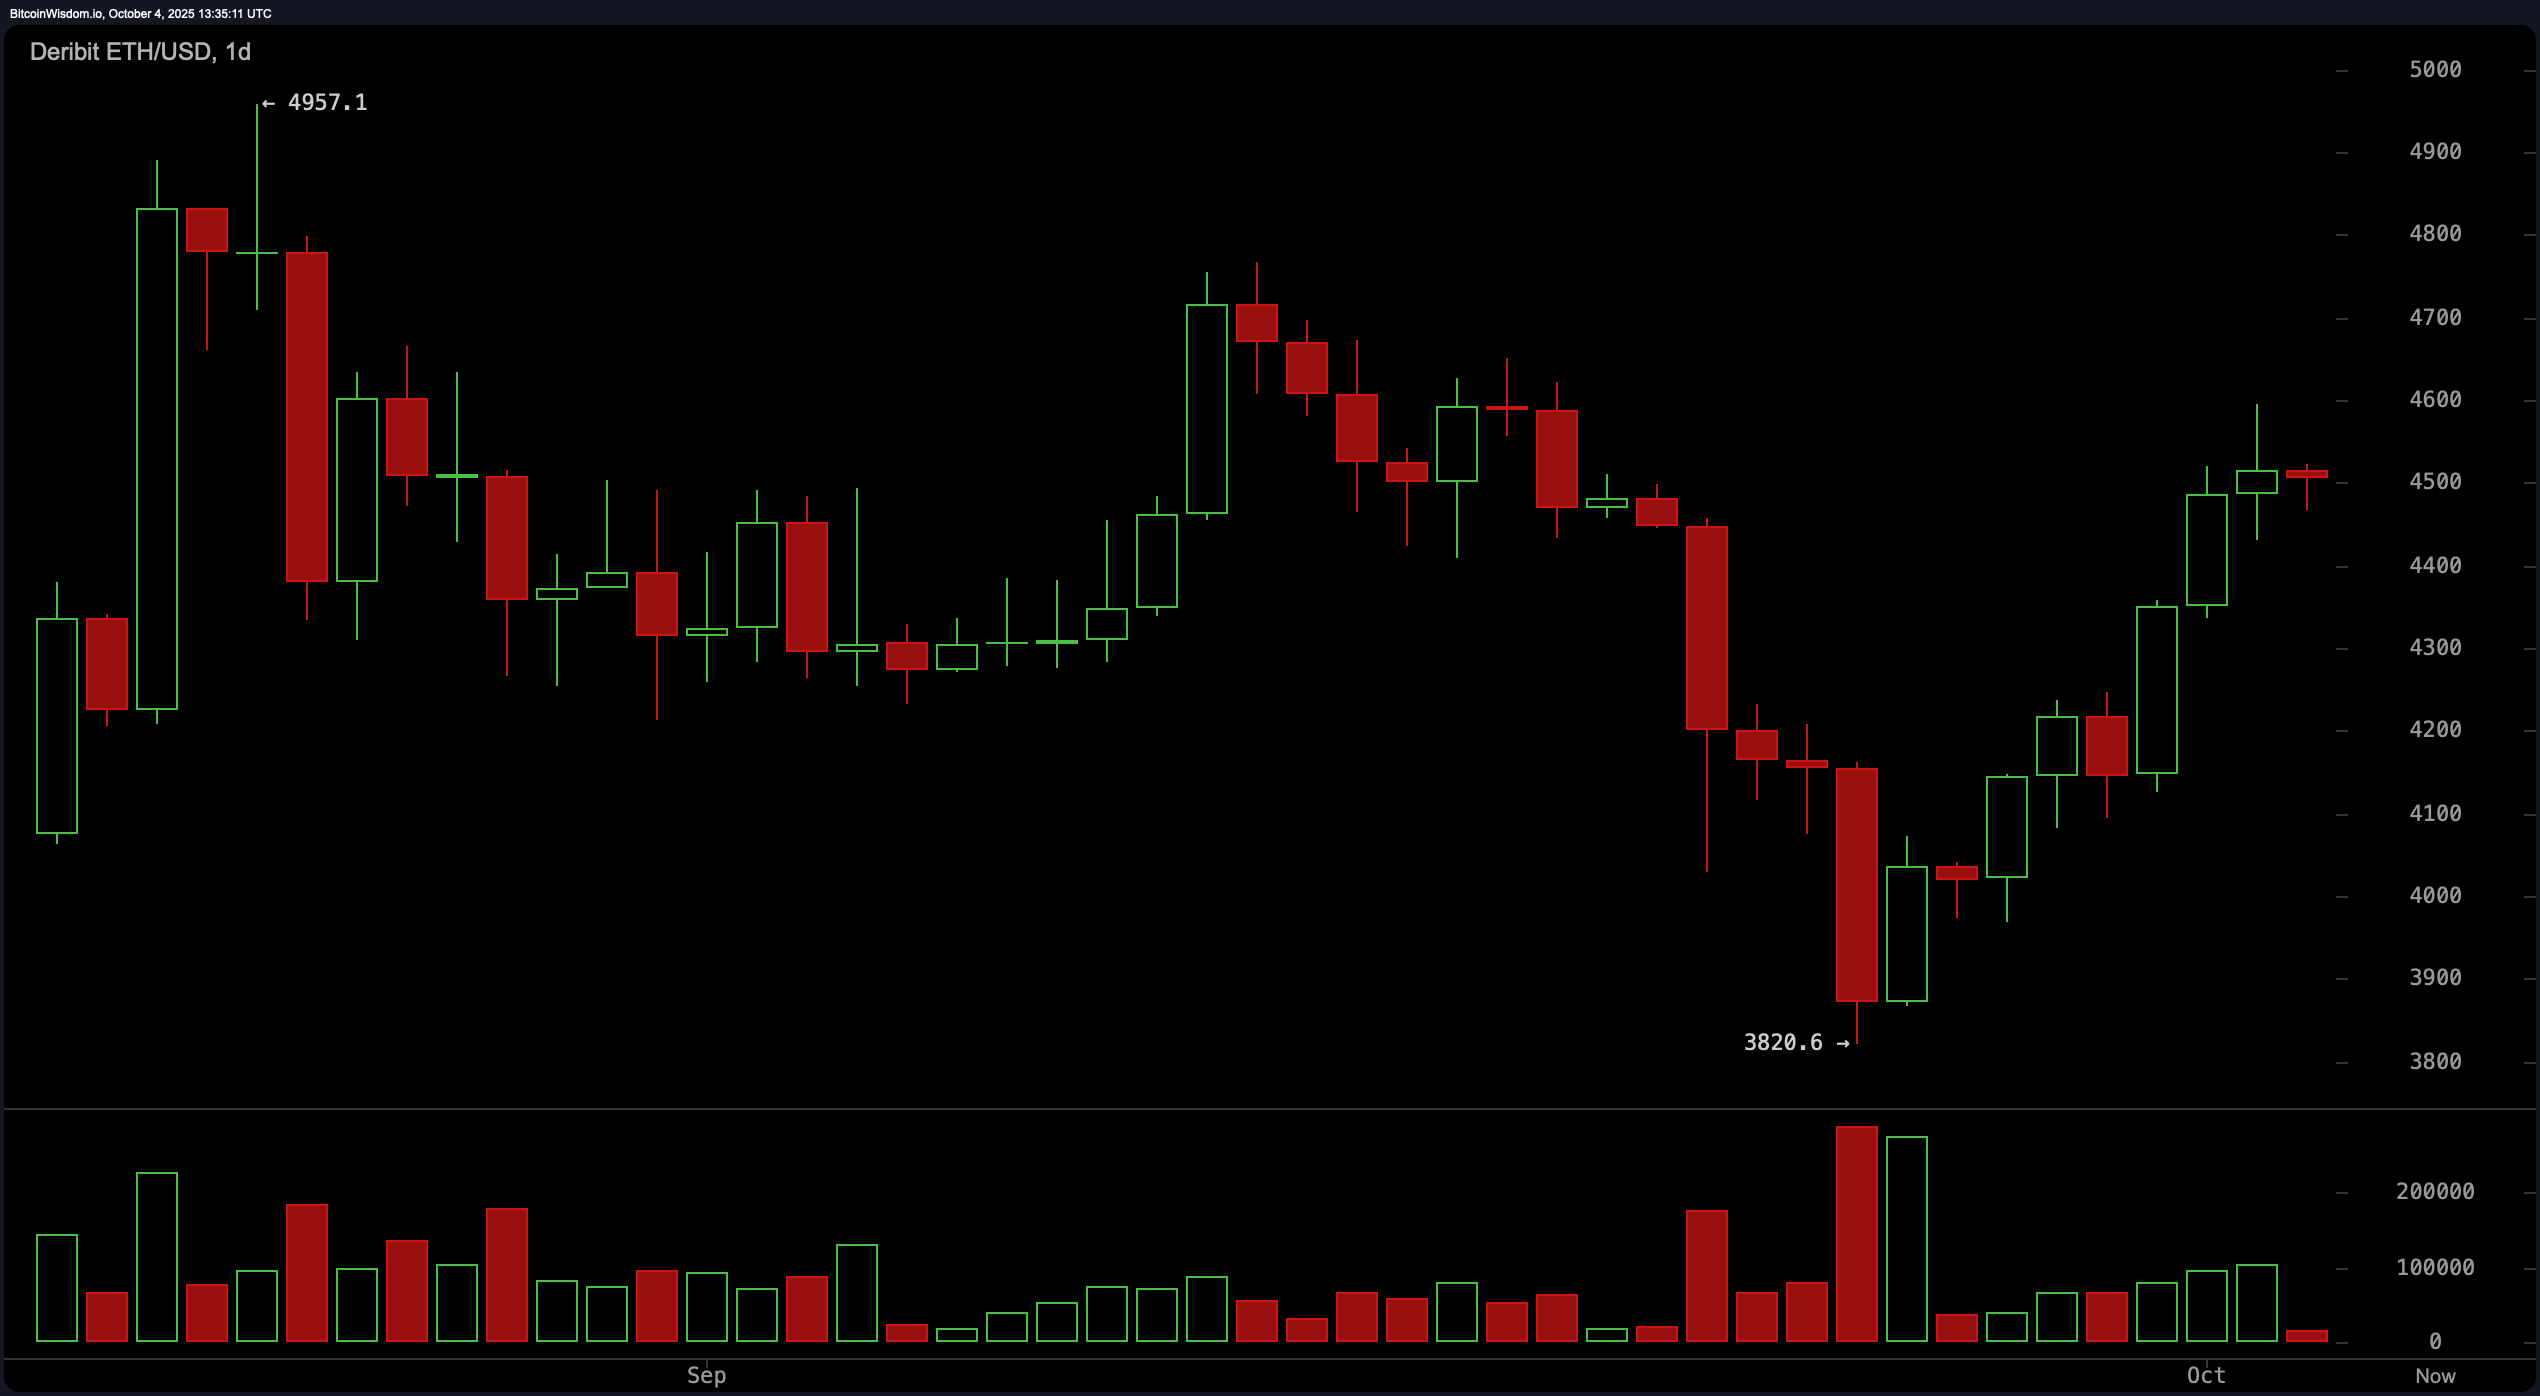
If you thought ethereum was going to cruise through the week on autopilot, think again. The daily chart is sending mixed signals dressed up as opportunity. We’re witnessing a recovering uptrend with a classic V-shaped rebound from its capitulation zone near $3,820. High volume at that level? You can probably bet institutional wallets were circling like sharks.
With resistance now tightening at $4,550–$4,700, ethereum needs a decisive close above $4,600 to break through its consolidation ceiling. A bounce entry between $4,300–$4,350 could reward the bold—if you can stomach a stop loss under $4,200.

ETH/USD via Deribit on Oct. 4, 2025. 1-day chart.
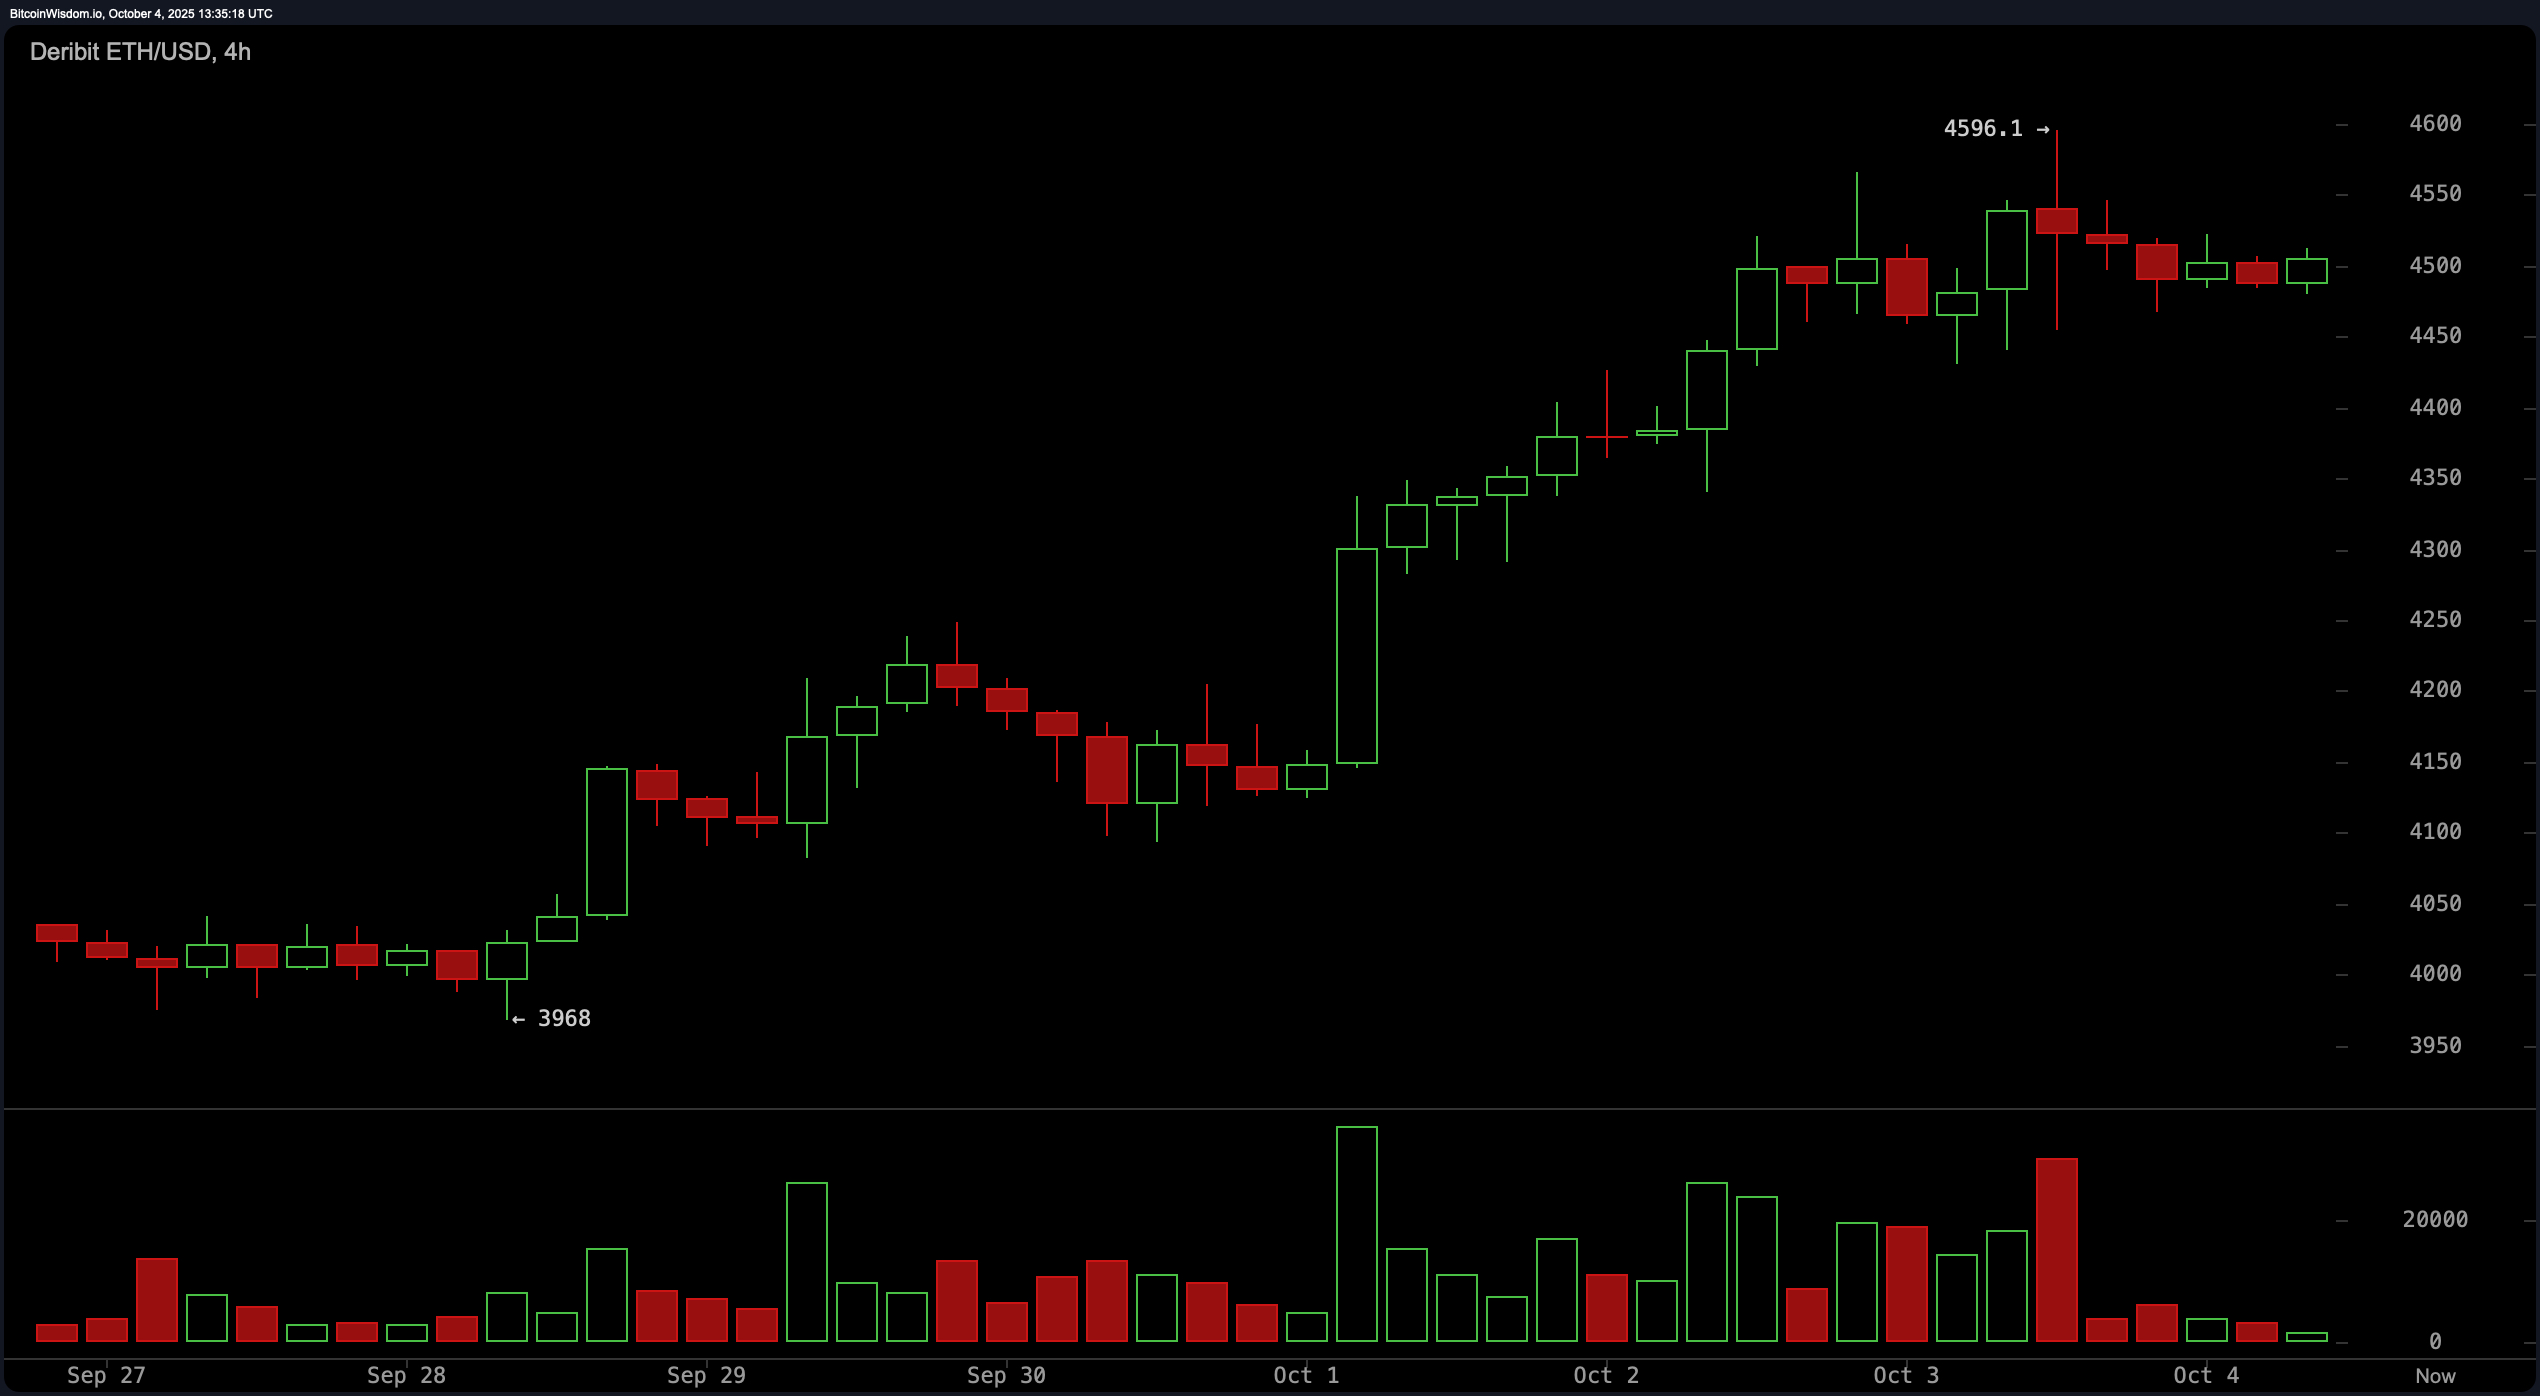
The 4-hour chart is giving off “I just rallied, now let me breathe” energy. ethereum’s recent thrust to ~$4,596 cooled into a sideways shuffle between $4,550–$4,600. Yet the trend structure remains bullish, confirmed by large green volume near $4,100–$4,300—a level now turning into reliable support. Traders eyeing momentum would do well to camp around $4,350–$4,400 or wait for a breakout above $4,600. But beware: a false start at resistance could send it back into a snooze cycle.

ETH/USD via Deribit on Oct. 4, 2025. 4-hour chart.
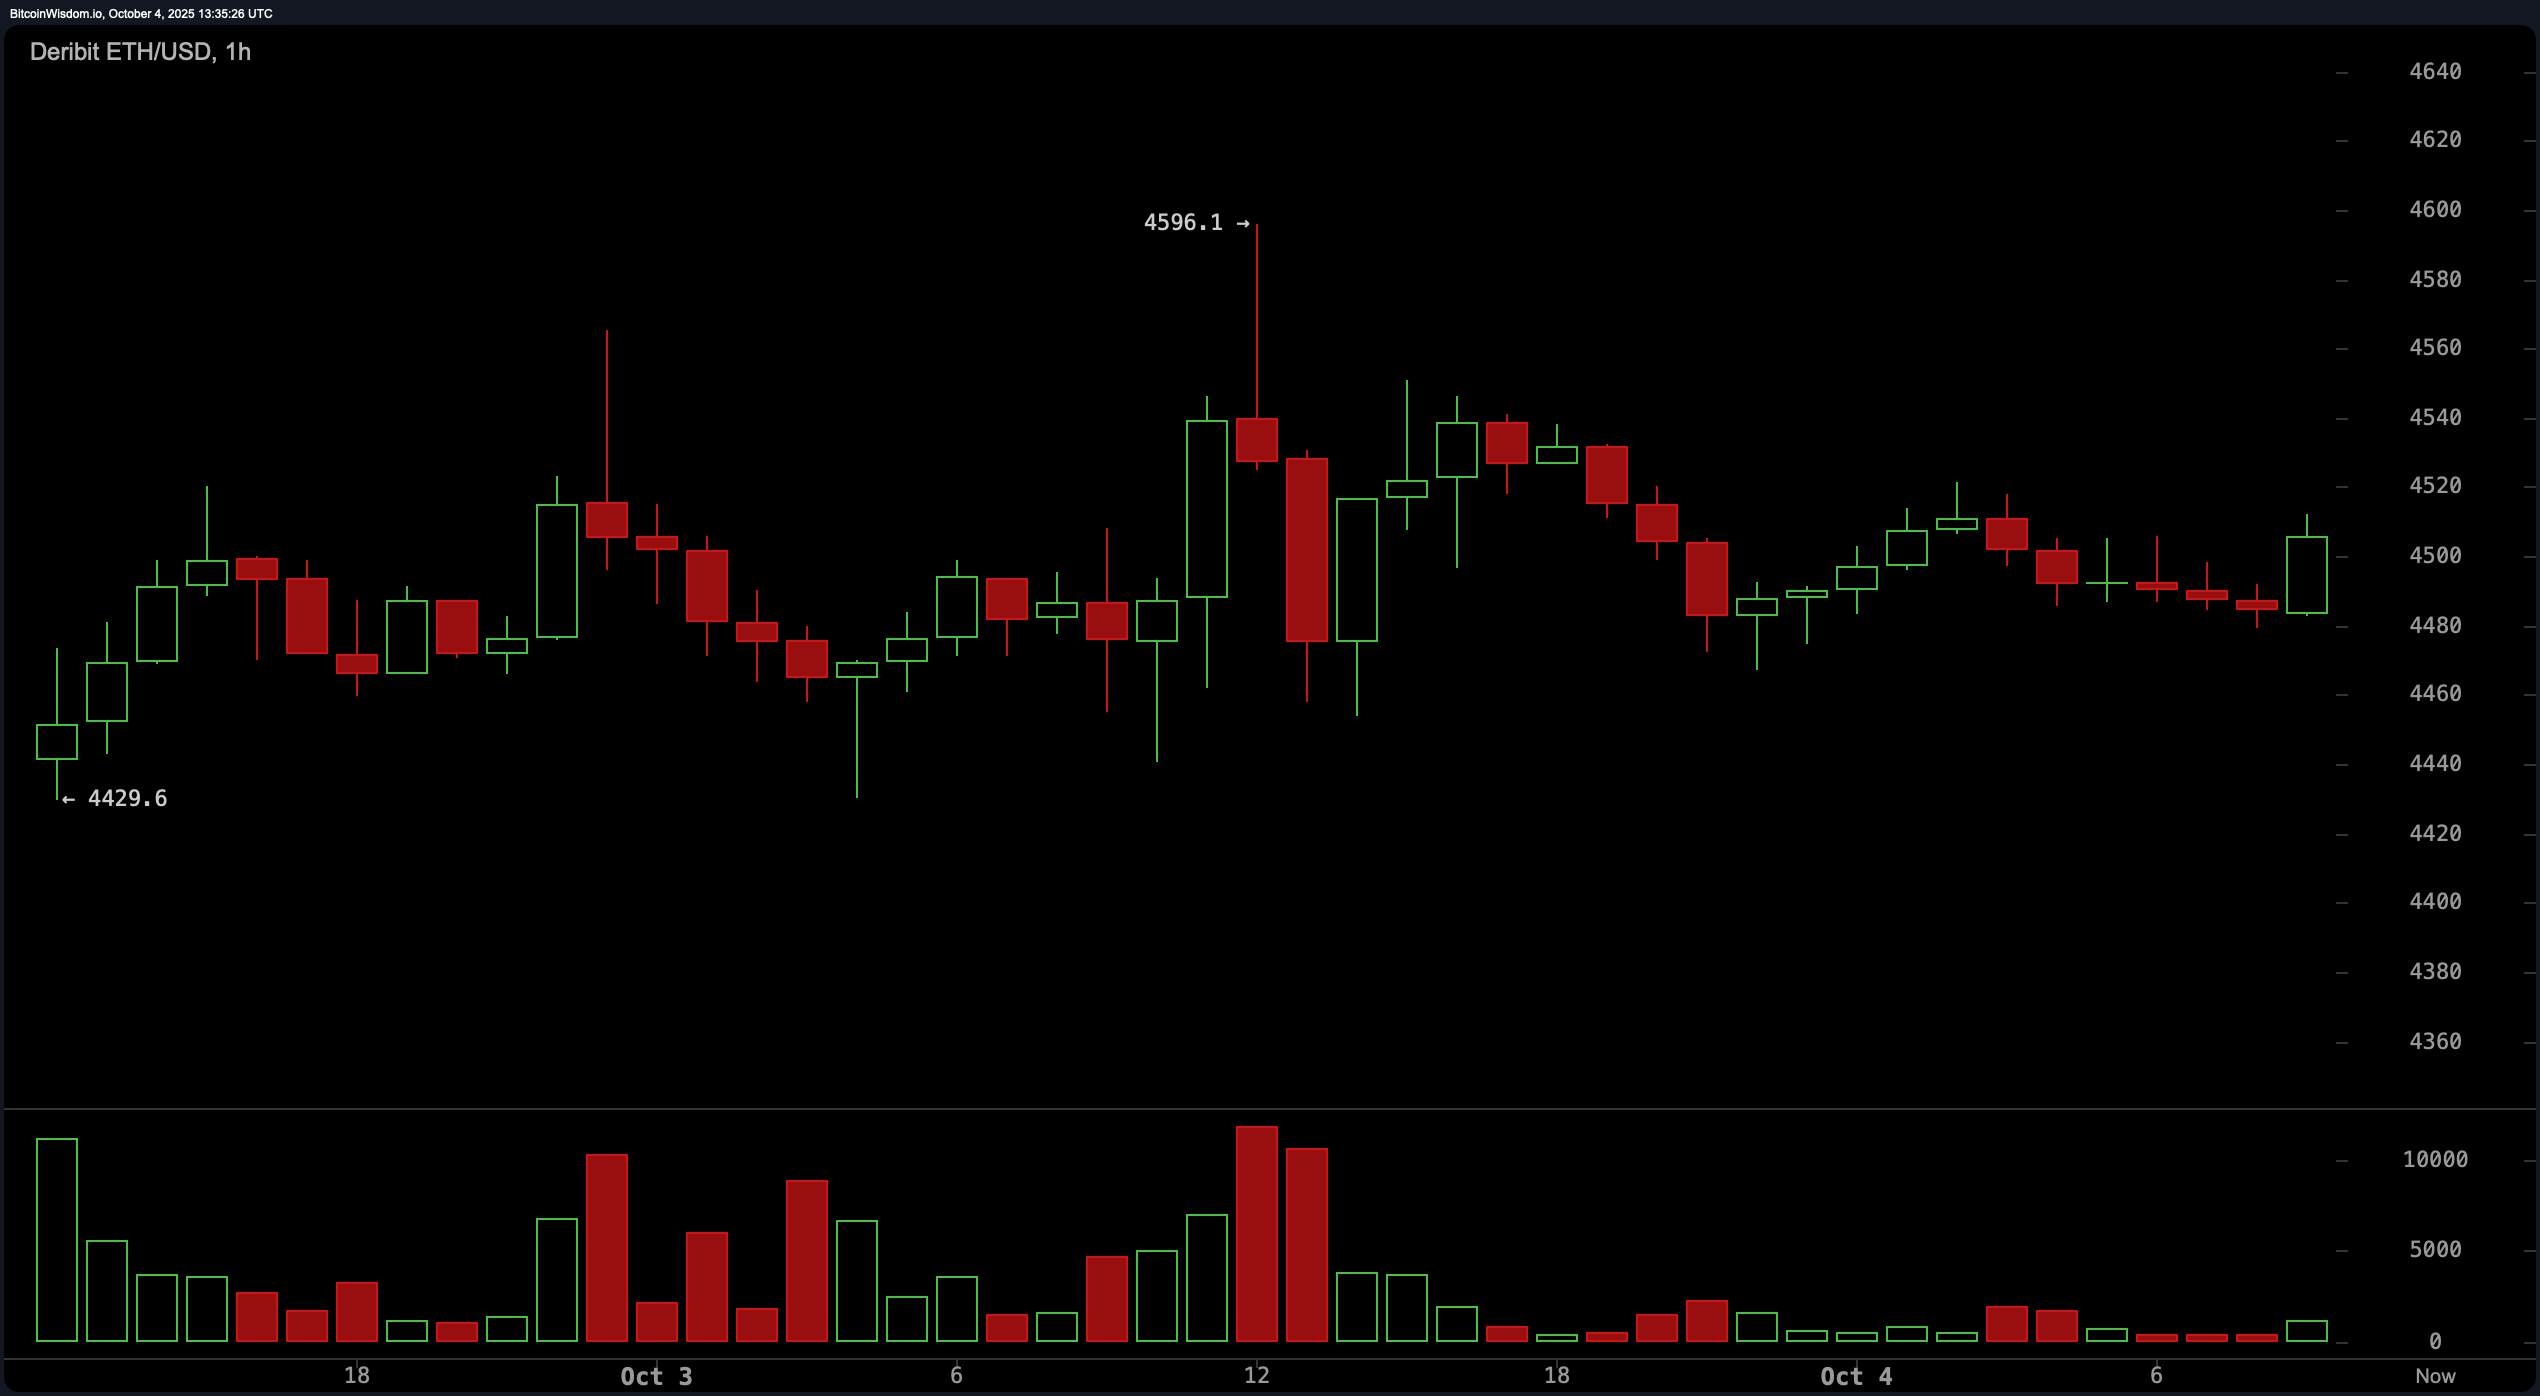
Now let’s zoom in on the 1-hour chart, where ethereum’s acting a little shy. Despite peaking near $4,596, price action has fallen into a cautious dance between $4,480–$4,550. Volume’s fizzling, and the lower highs are stacking up like missed gym days. Still, the $4,480 support level has been tested more times than a high school math teacher’s patience. A breakout above $4,550 with volume could be scalped for gains—tight stops only, please.

ETH/USD via Deribit on Oct. 4, 2025. 1-hour chart.
Oscillator readings are like the quiet kids in class—neutral, but still saying a lot. The relative strength index (RSI) sits at 57.4, stochastic at 87.0, and commodity channel index (CCI) at 63.0—all twiddling their thumbs in the “meh” zone. The average directional index (ADX) confirms there’s no strong trend to marry yet, posting a 19.5. But don’t overlook the awesome oscillator (AO) at 19.2 and the MACD (moving average convergence divergence) at 5.1—both leaning bullish. Momentum? A curmudgeonly 348.9, shouting “sell,” just to keep things spicy.
If moving averages were a fashion show, ethereum would be front-row fabulous. Every key simple moving average (SMA) and exponential moving average (EMA)—from the 10-day to the 200-day—is flaunting a “buy” signal like it’s going out of style. The exponential moving average (10) at $4,341.7 and simple moving average (10) at $4,228.8 show immediate strength, while the exponential moving average (200) at $3,466.6 and simple moving average (200) at $3,026.4 serve as the safety net for those planning long-term love affairs with this asset.
Bottom line? ethereum’s playing a game of calculated flirtation. It’s holding strong above key supports, teasing resistance levels, and daring traders to make the next move. Whether you’re swing trading the 1D optimism or scalping the 1H jitters, one thing’s clear—this digital diva isn’t going anywhere quietly.
Bull Verdict:
Ethereum is coiling with intent, stacking bullish moving averages like poker chips at a high-stakes table. With strong support zones holding firm and the MACD and awesome oscillator flashing green, a clean break above $4,600 could ignite a sharp rally toward $4,800—and maybe beyond. If this trend keeps building momentum, the bulls will be dancing in the moonlight.
Bear Verdict:
Beneath the glitter of a $4,500 price tag, ethereum’s fading momentum and sideways chop whisper caution. Oscillators are indecisive, and the hourly chart hints at exhaustion with lower highs and bearish divergence on the horizon. If $4,480 cracks, this could turn from consolidation into a slide—leaving late bulls holding the bag.
免责声明:本文章仅代表作者个人观点,不代表本平台的立场和观点。本文章仅供信息分享,不构成对任何人的任何投资建议。用户与作者之间的任何争议,与本平台无关。如网页中刊载的文章或图片涉及侵权,请提供相关的权利证明和身份证明发送邮件到support@aicoin.com,本平台相关工作人员将会进行核查。


