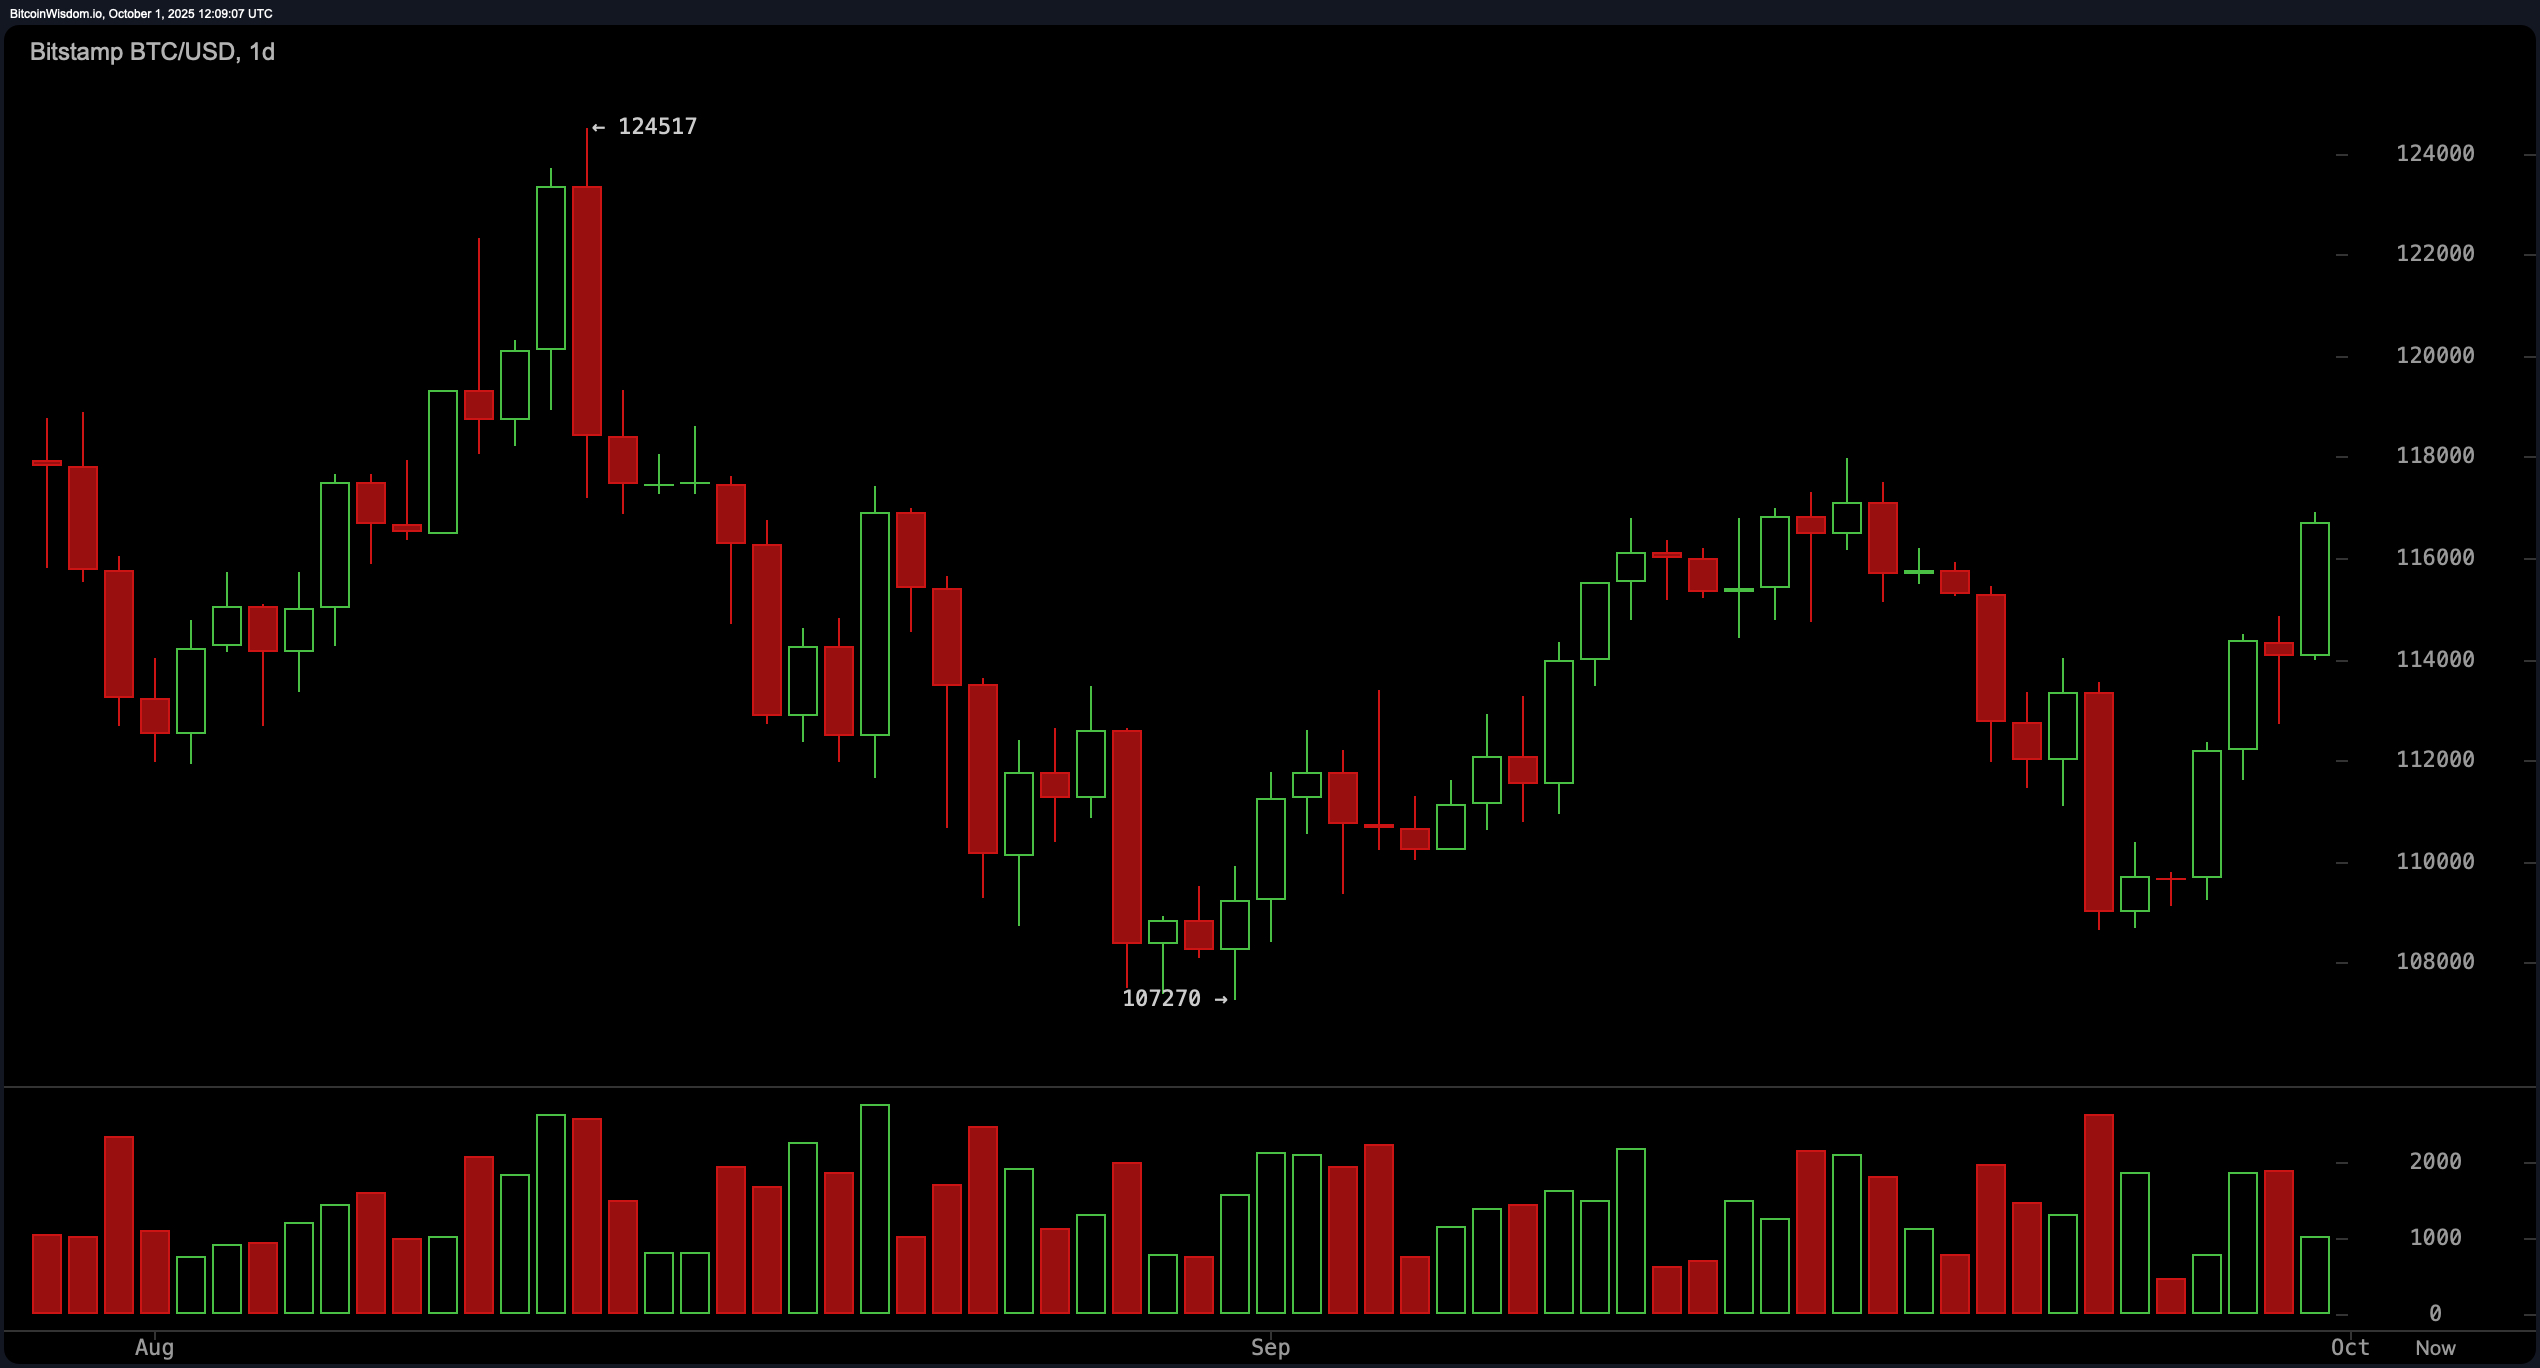
The daily chart reveals bitcoin is toeing the line just beneath a stubborn resistance level in the $117,000–$118,000 zone, a ceiling it last flirted with in early September. A series of higher lows since the recent $107,270 bottom hints that momentum is building for a potential breakout.
Bullish candles and rising volume bolster the case, and that recovery structure implies confidence is returning to the market. Still, caution hangs in the air—this level isn’t just a speed bump, it’s the velvet rope guarding the $124,517 high from August.

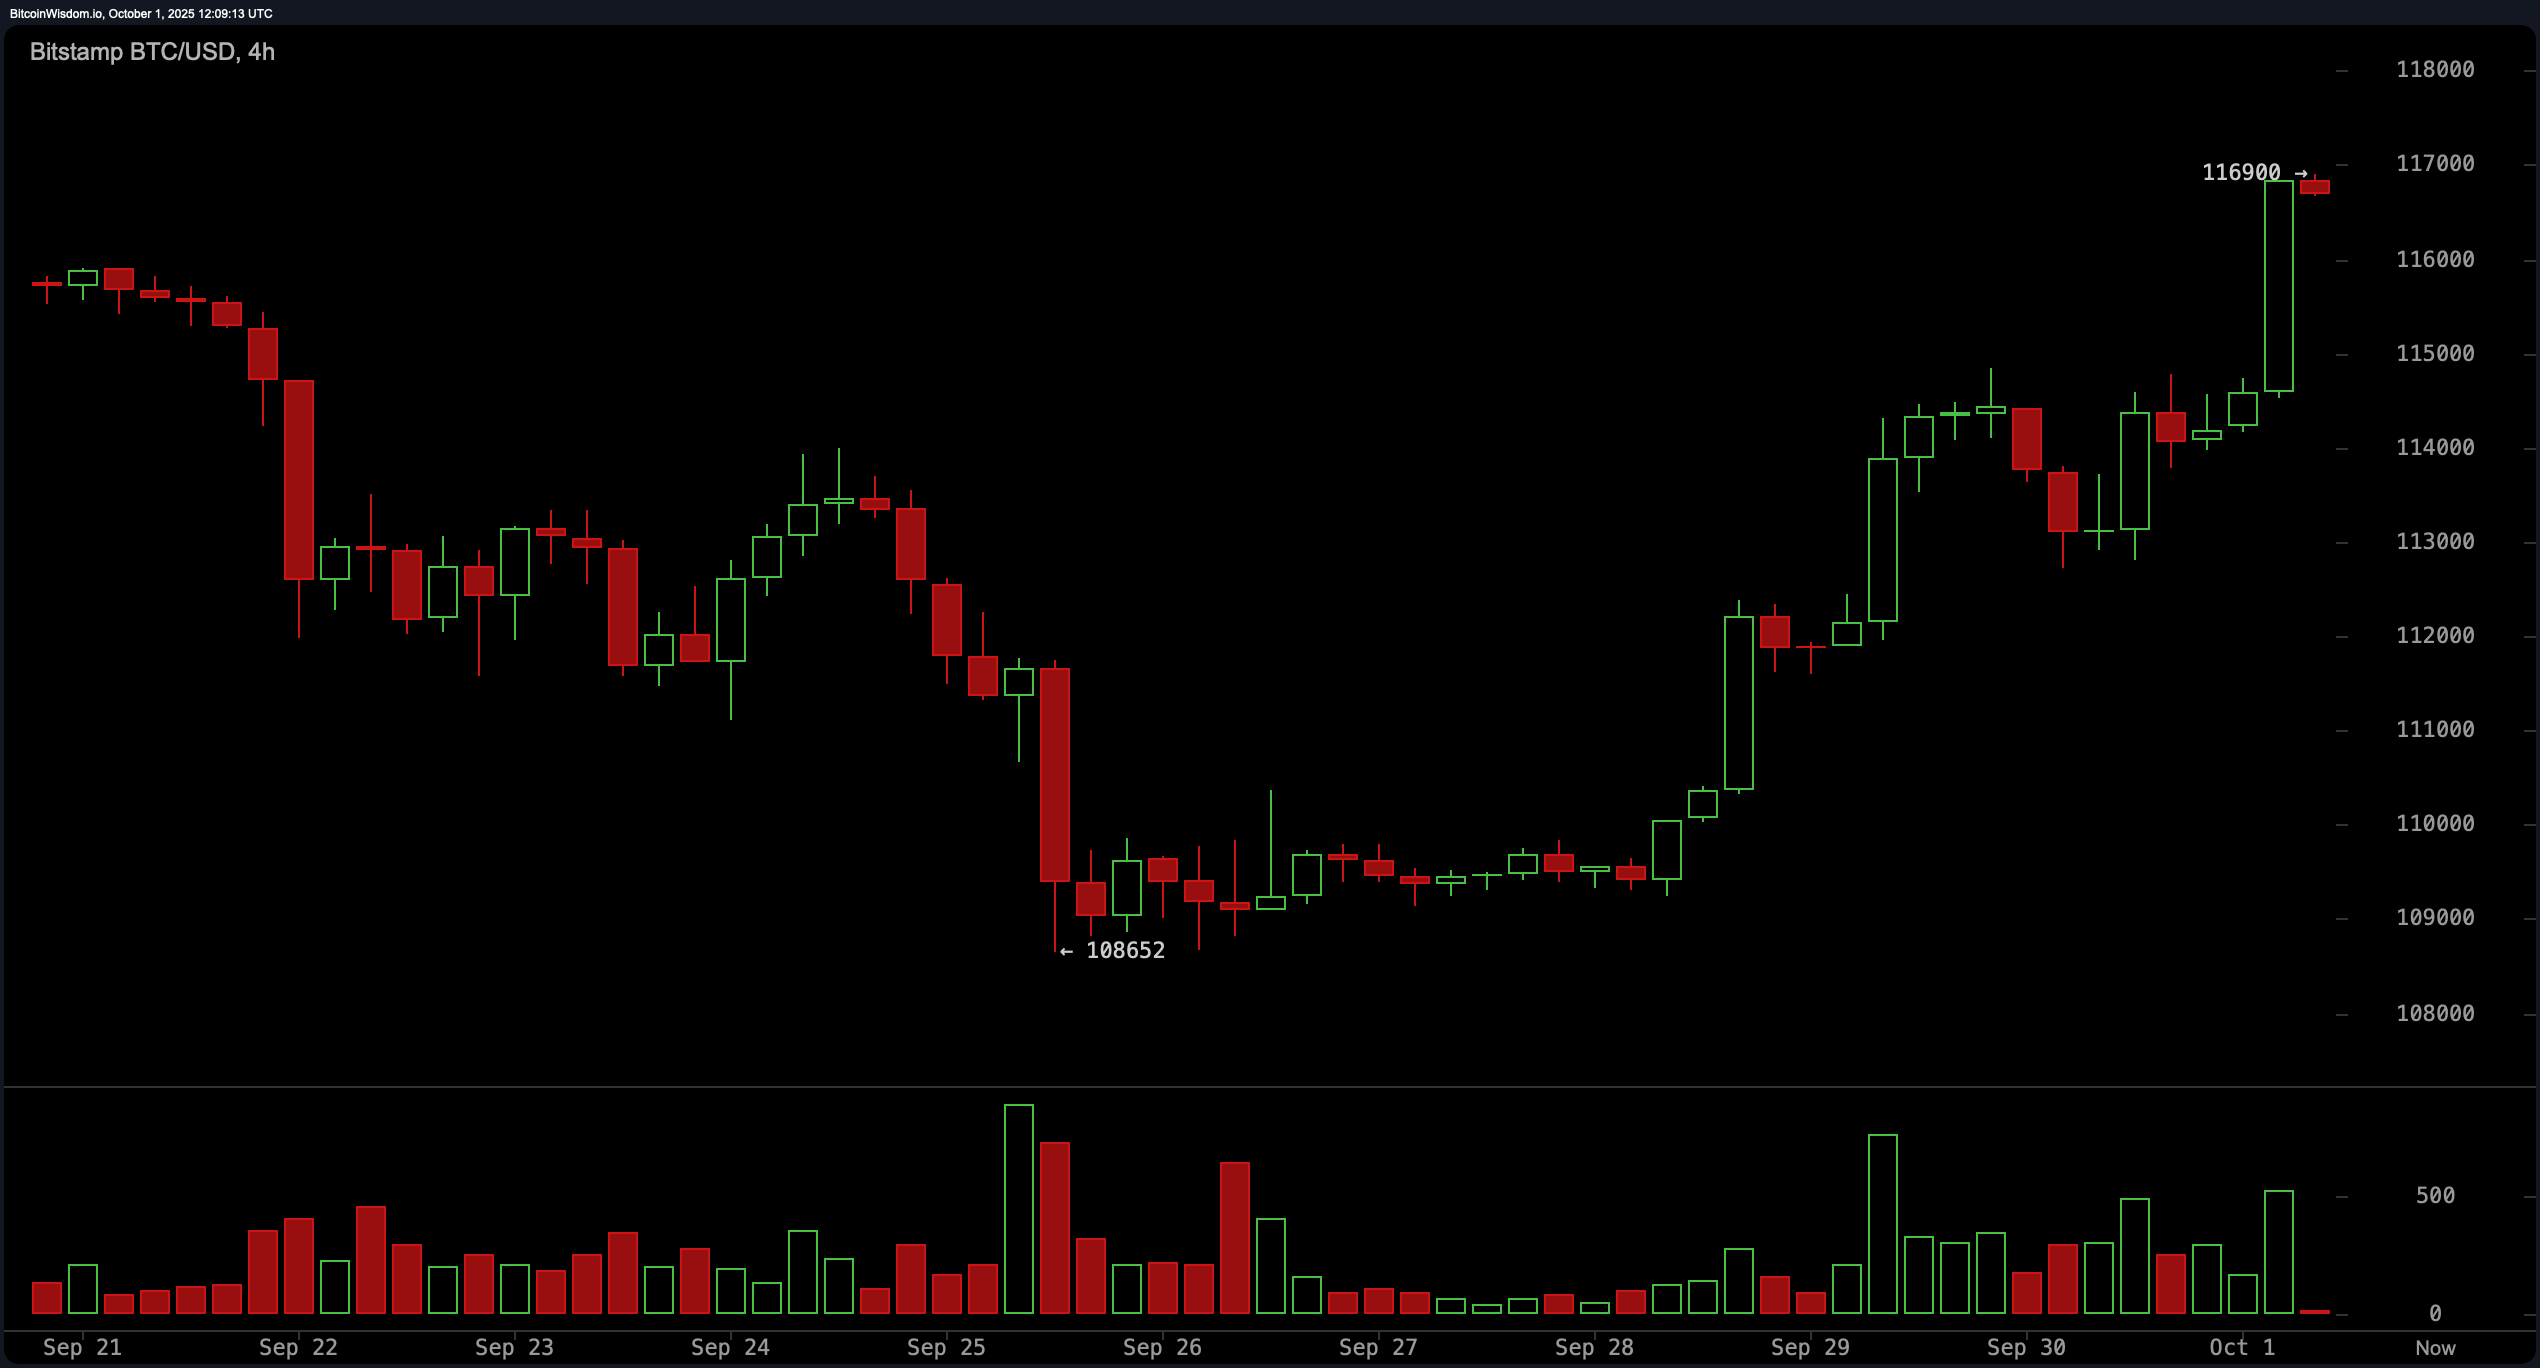
Zoom into the 4-hour chart, and bitcoin’s been flexing harder. A rounded bottom formed between September 25 and 28 has morphed into a sharp impulse breakout, marked by a strong candle punching up to $116,839. This isn’t your average drift upward—it’s a clean structure of higher lows and higher highs, suggesting the smart money’s been accumulating. If this pace holds, short-term watchers will have their eyes fixed on the $117,500–$118,000 window, which now doubles as both battleground and gateway.

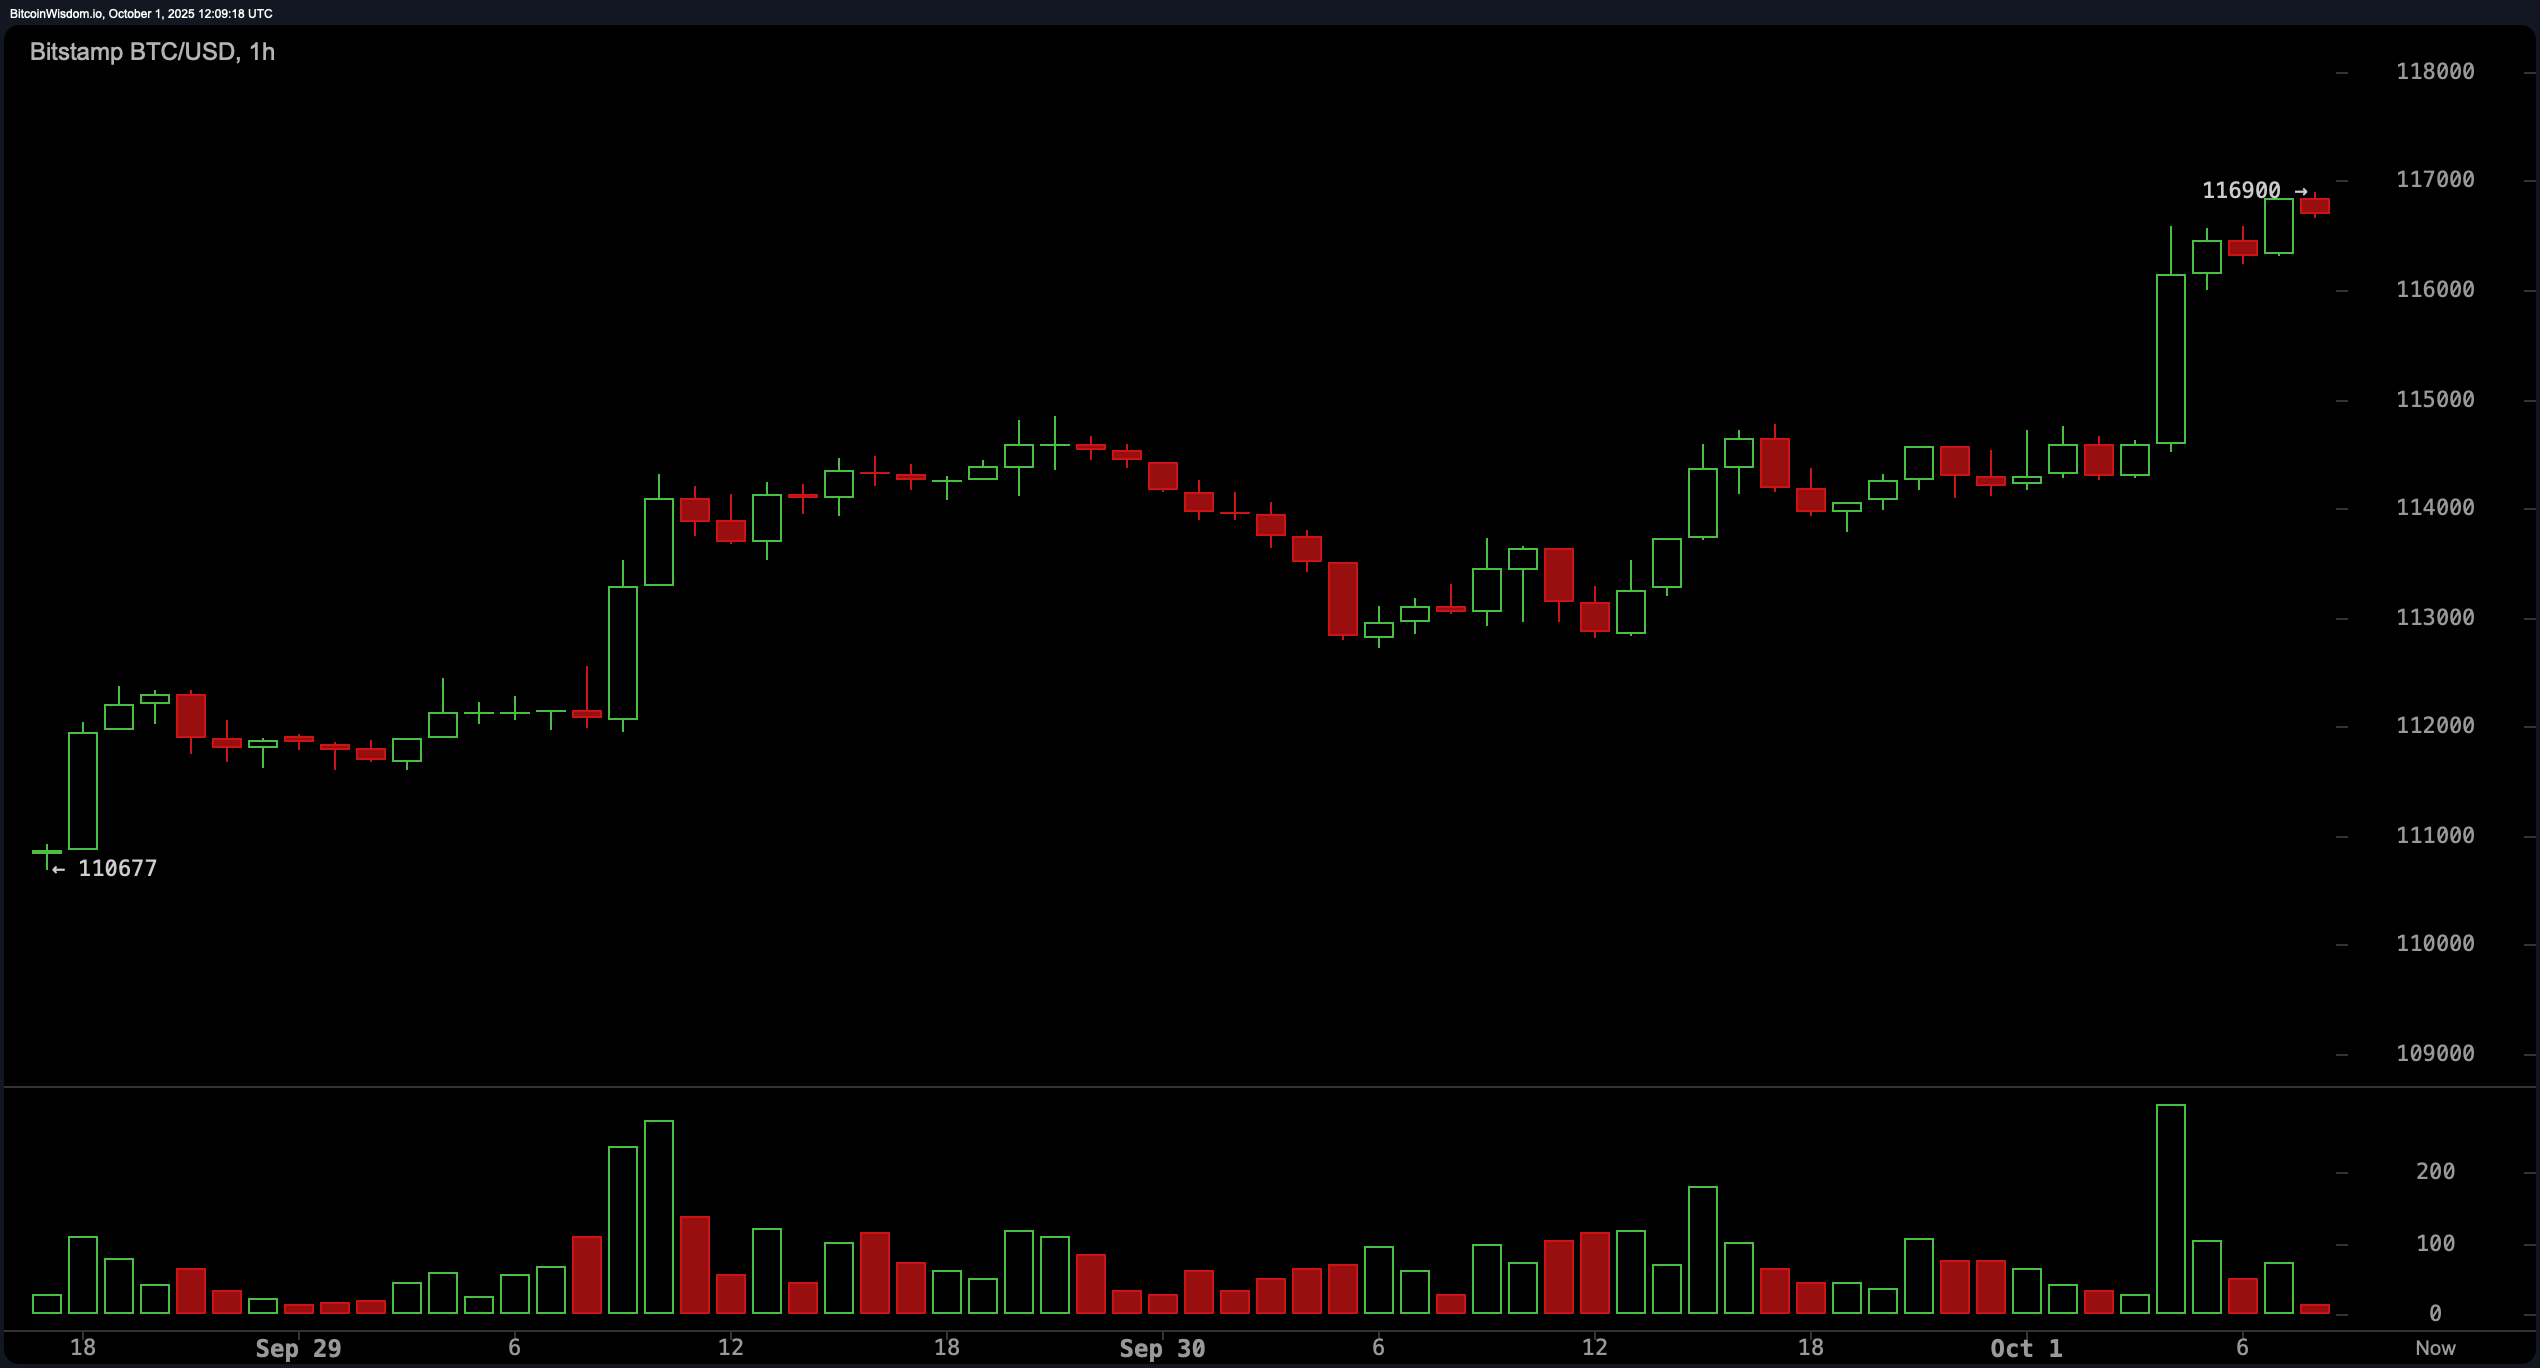
On the 1-hour chart, bitcoin is all about that short-term sizzle. A sharp breakout candle confirmed with volume spiked to $116,839, carving a textbook bullish flag. Scalpers eyeing a pullback to the $115,800–$116,000 area might find opportunities, but tight stops near $115,000 are a must. The setup’s clean, the energy is palpable, but any exhaustion in momentum could clip the wings of this flight.

Now, let’s talk technical indicators. Oscillators are playing it coy—neutral signals from the relative strength index (RSI) at 59, Stochastic at 69, and commodity channel index (CCI) at 58 suggest the asset isn’t overcooked yet. The average directional index (ADX) at 18 confirms trend strength remains modest, while the Awesome oscillator lounges below zero at −260. But then momentum pulls a surprise with a strong 1,505 reading, and the moving average convergence divergence (MACD) crosses into bullish territory at −8. Together, these indicators whisper optimism with a wink.
Supporting the bullish thesis, every single major moving average is locked into upward alignment. The 10-period exponential moving average (EMA) and simple moving average (SMA) hover around $113,500 and $112,395, respectively, giving short-term thrust. Mid-range and long-range trends are just as flattering: the 20-, 30-, 50-, 100-, and even 200-period EMAs and SMAs are uniformly positioned below price action, signaling broad market strength. With the 200-period simple moving average all the way down at $104,932, it’s clear this rocket has left the launchpad.
Bull Verdict:
Bitcoin’s chart is dressed to impress. With all major moving averages stacked beneath the current price, bullish momentum building on short-term timeframes, and momentum indicators pointing north, the setup looks like it’s warming up for a breakout dance above $118,000. If volume shows up to the party, we might just see bitcoin eyeing that $124,000 zone like it’s déjà vu.
Bear Verdict:
While bitcoin’s price action is turning heads, the $118,000 resistance is no pushover—it’s the velvet rope of this rally. Oscillators are whispering caution, momentum could stall, and a failure to crack this ceiling might see the market retreat to the $112,000s. Without stronger volume, this bullish flirtation risks turning into a classic bull trap in disguise.
免责声明:本文章仅代表作者个人观点,不代表本平台的立场和观点。本文章仅供信息分享,不构成对任何人的任何投资建议。用户与作者之间的任何争议,与本平台无关。如网页中刊载的文章或图片涉及侵权,请提供相关的权利证明和身份证明发送邮件到support@aicoin.com,本平台相关工作人员将会进行核查。


