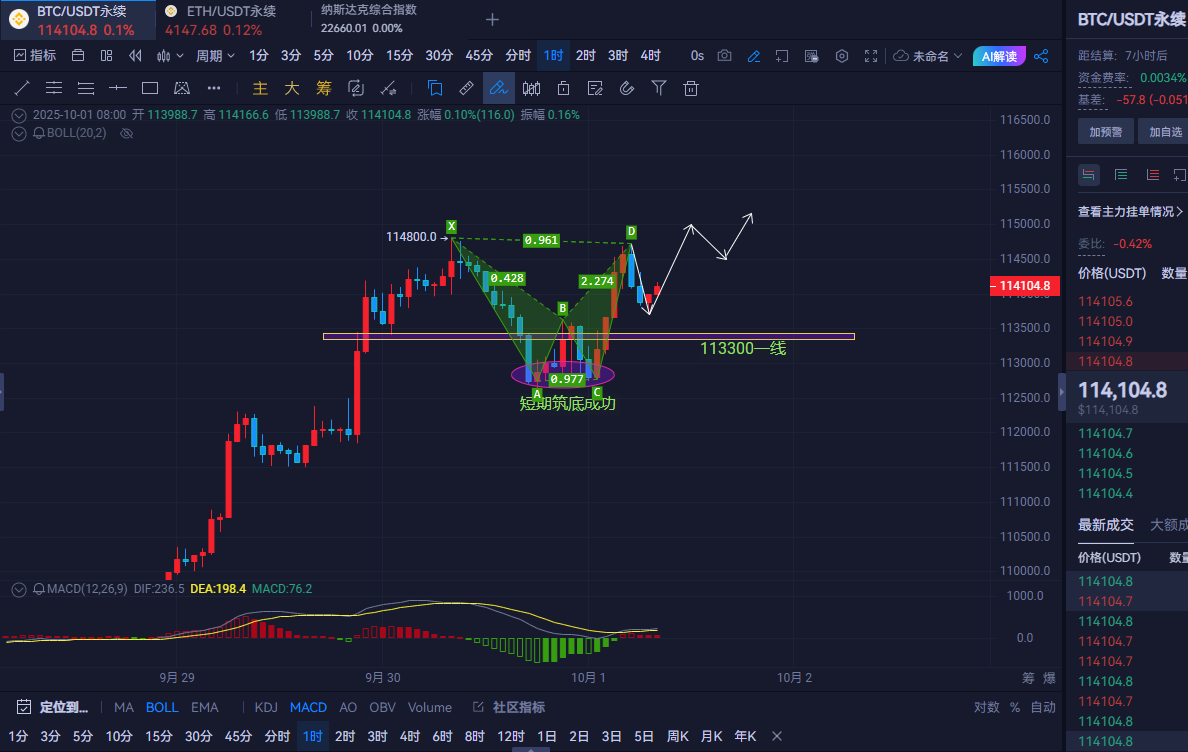
Morning Analysis: From the weekly chart, the price of Bitcoin has once again retreated to around 108,000 after forming a doji continuation pattern, but it has not broken through the previous high before the doji period. The larger cycle has tested the 108,000 level three times without breaking it, indicating a shift in the bearish trend. From the 1-hour chart, although the price of Bitcoin has returned above 113,500, it is facing resistance at the 114,600 pressure level. For intraday operations, we will first look at the breakout situation between 114,600 and 115,000, with the main resistance level above around 115,800 to 116,300. Support below is focused on the areas around 112,300, 112,800, and 113,300.
From the 4-hour chart of Ethereum, the recent price has formed a fluctuating upward trend, with gradually higher lows and some breakthroughs in highs, but overall it has not escaped the pressure around 4,220. On September 29 and last night, it touched the lower support around 4,080 twice, then rebounded continuously to the 4,200 area before encountering resistance and retreating. It did not drop further but instead formed a short-term double bottom. As long as it does not break the support area of 4,080 to 4,060 during the day, we continue to look for a rebound.
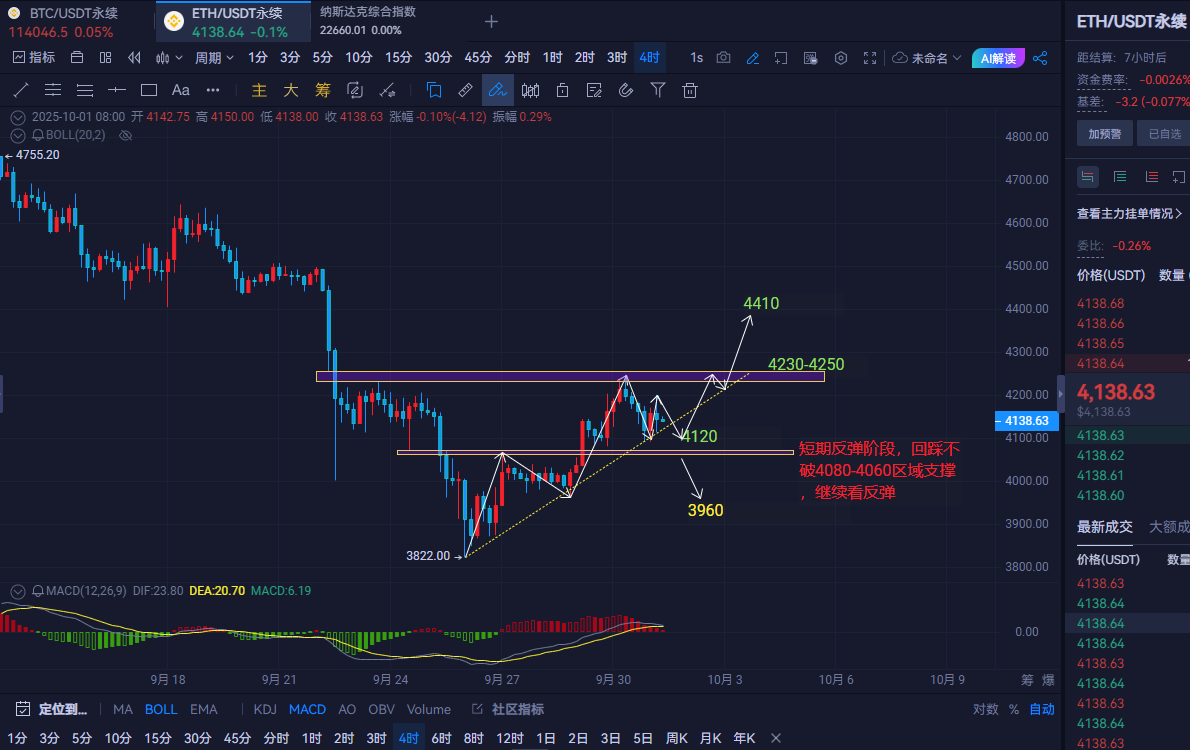
However, since September 26, the trading volume has gradually shrunk, indicating that market sentiment is becoming cautious, and the divergence between bulls and bears is increasing. After a surge in volume on September 29, it has been gradually decreasing, indicating insufficient upward momentum and the need for more confirmation signals.
This strategy is for reference only; please invest cautiously and secure profits. (Follow the public account: Ethereum Kai)
免责声明:本文章仅代表作者个人观点,不代表本平台的立场和观点。本文章仅供信息分享,不构成对任何人的任何投资建议。用户与作者之间的任何争议,与本平台无关。如网页中刊载的文章或图片涉及侵权,请提供相关的权利证明和身份证明发送邮件到support@aicoin.com,本平台相关工作人员将会进行核查。


