Yesterday we mentioned that Sunday was mainly a consolidation phase, and we were just waiting for a trend change. As soon as we finished speaking, the market maker began to rally. The market maker chose to start the upward movement at the last moment on Sunday, which already indicated to us how the subsequent trend would unfold.
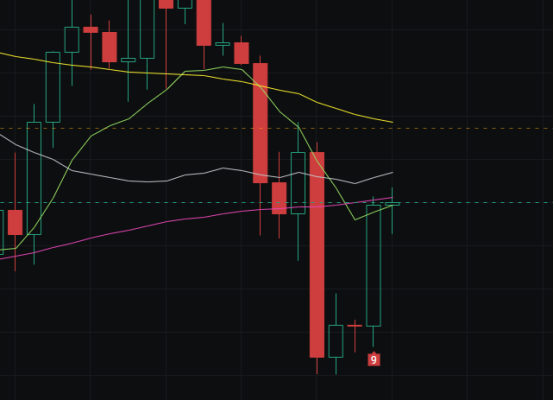
Weekly Level
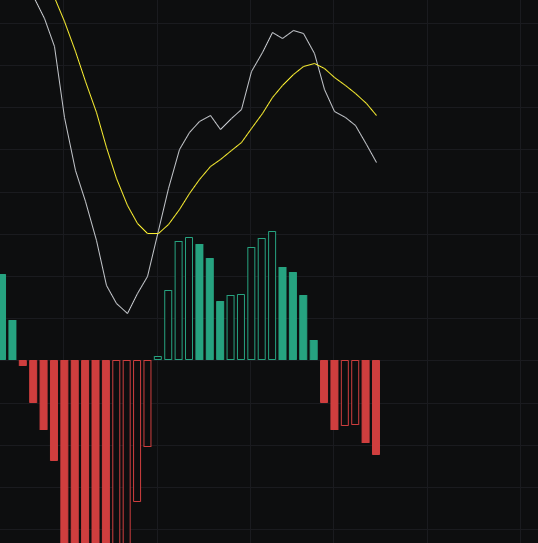
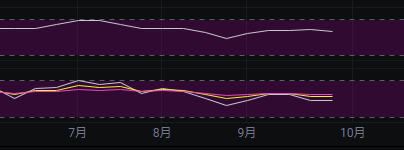
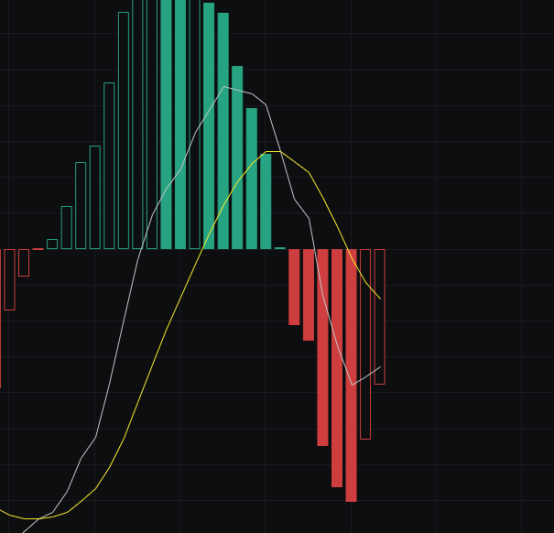
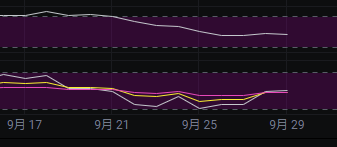
From the MACD perspective, the energy bars are currently moving downwards, and both the fast and slow lines are also trending down, which is unfavorable for the bulls and requires continued observation.
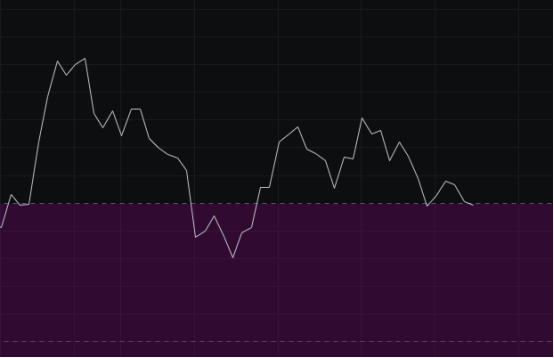
From the CCI perspective, the CCI is currently above 100, so we continue to look bullish. At this critical point, it could also directly reverse like the previous wave.
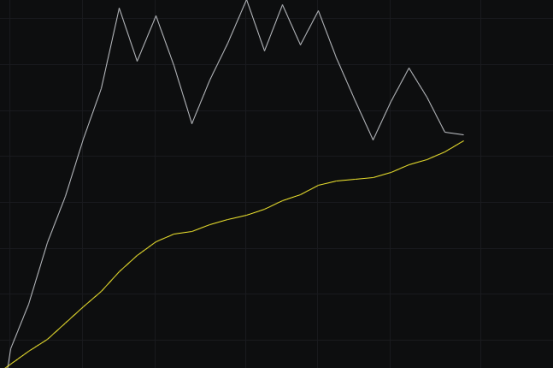
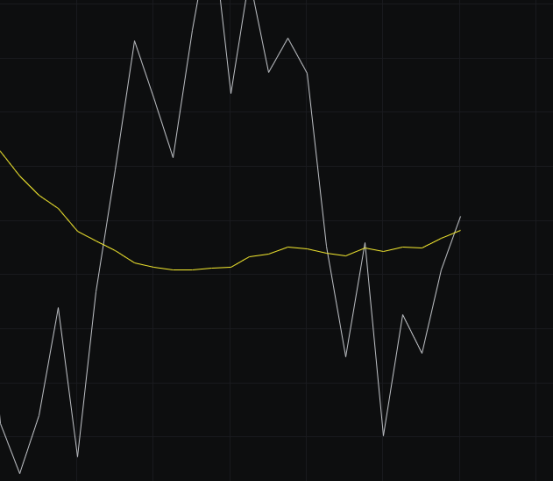
From the OBV perspective, the fast line is still above the slow line, and the slow line is also trending upwards, with no signs of flattening yet, so the OBV looks bullish.
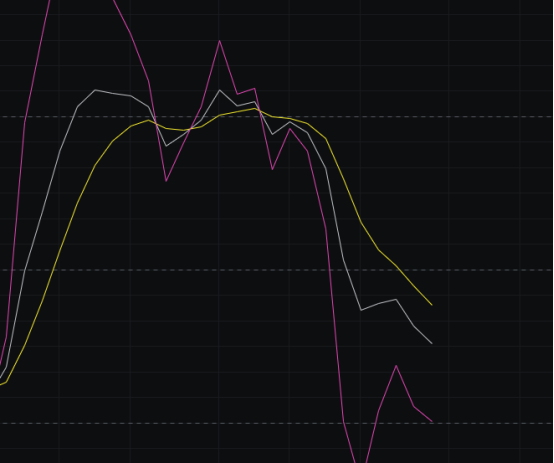
From the KDJ perspective, it is still in a downtrend, but it has reached a relatively low point, and it is estimated that it will soon stop falling.
From the MFI and RSI perspectives, both indicators are in the neutral zone, which means they can go either up or down, and we will see how the market chooses to move.
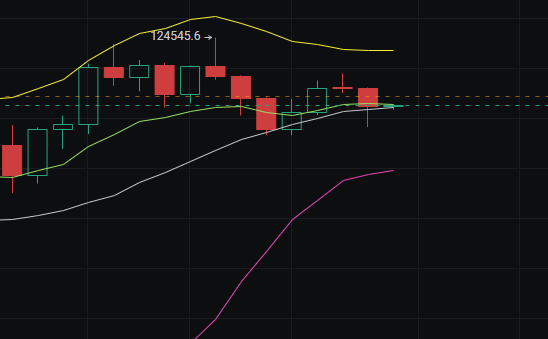
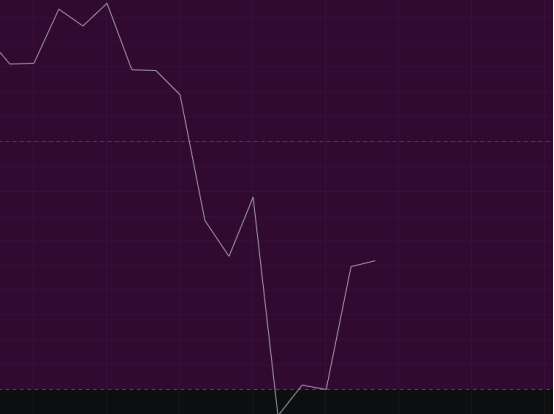
From the moving average perspective, last week there was a rebound at the last moment, pulling the price back to near the BBI. Here we believe the BBI has held, so the bullish pattern has not been broken.
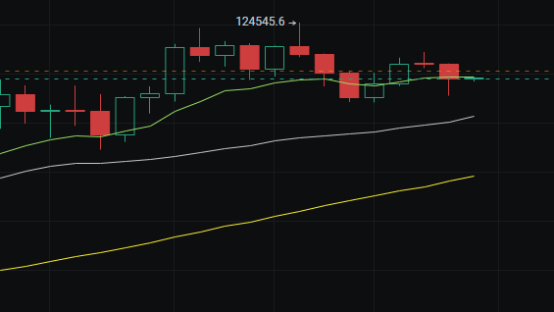
From the Bollinger Bands perspective, the bands have entered a narrow range, and the price has closed above the middle band. If the middle band holds, the price will likely attack the upper band.
Daily Level
From the MACD perspective, with yesterday's rally, the energy bars have started to rise, and the fast line has also begun to turn upwards. It is important to watch for the sustainability of this rally; if it does not hold, there will be a pullback.
From the CCI perspective, the CCI is currently around -50, with some distance from the zero line. To see the CCI return to the zero line, we need to close with a bullish candle.
From the OBV perspective, the fast line has crossed above the slow line. We will see if the fast line can stabilize above the slow line, which is also trending upwards, so the OBV looks good.
From the KDJ perspective, with yesterday's rally, a golden cross has occurred, indicating the possibility of continued upward movement.
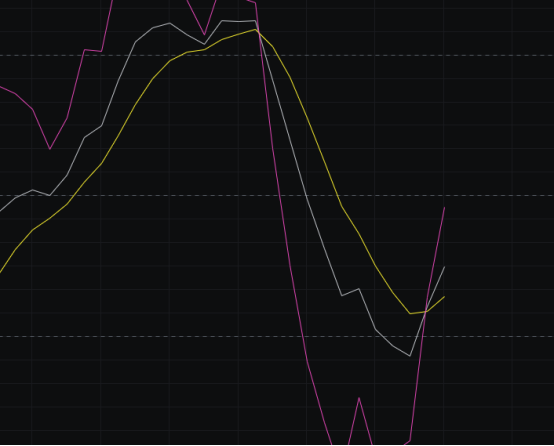
From the MFI and RSI perspectives, both indicators are in the neutral zone, also indicating the potential for upward movement.
From the moving average perspective, the price has reached above the BBI, but we need to wait for the closing to see if it can hold above. Meanwhile, the 30-line is also trending upwards, which is favorable for the bulls.
From the Bollinger Bands perspective, with yesterday's rally, the bands have shifted from a downward channel to a wide range of fluctuations. If the price moves upwards, we will first look at the middle band; if it can hold, we will then look at the upper band.
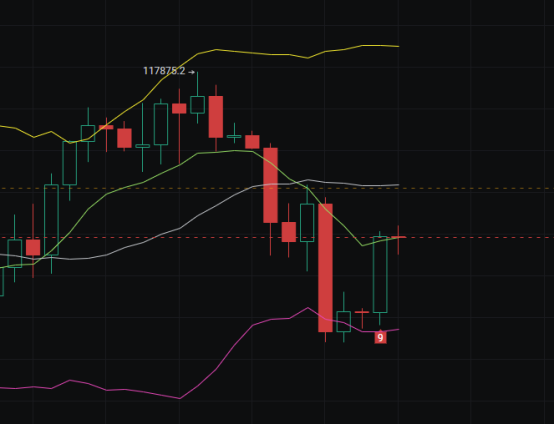
In summary: With last night's rally, the market maker has already indicated the direction for the future. Today's target for the bulls is to hold above 112,000, with support at 111,000-109,000 and resistance at 114,000-115,500.
免责声明:本文章仅代表作者个人观点,不代表本平台的立场和观点。本文章仅供信息分享,不构成对任何人的任何投资建议。用户与作者之间的任何争议,与本平台无关。如网页中刊载的文章或图片涉及侵权,请提供相关的权利证明和身份证明发送邮件到support@aicoin.com,本平台相关工作人员将会进行核查。


