Trading Philosophy: Look at the trend in the long term, find entry points in the short term;
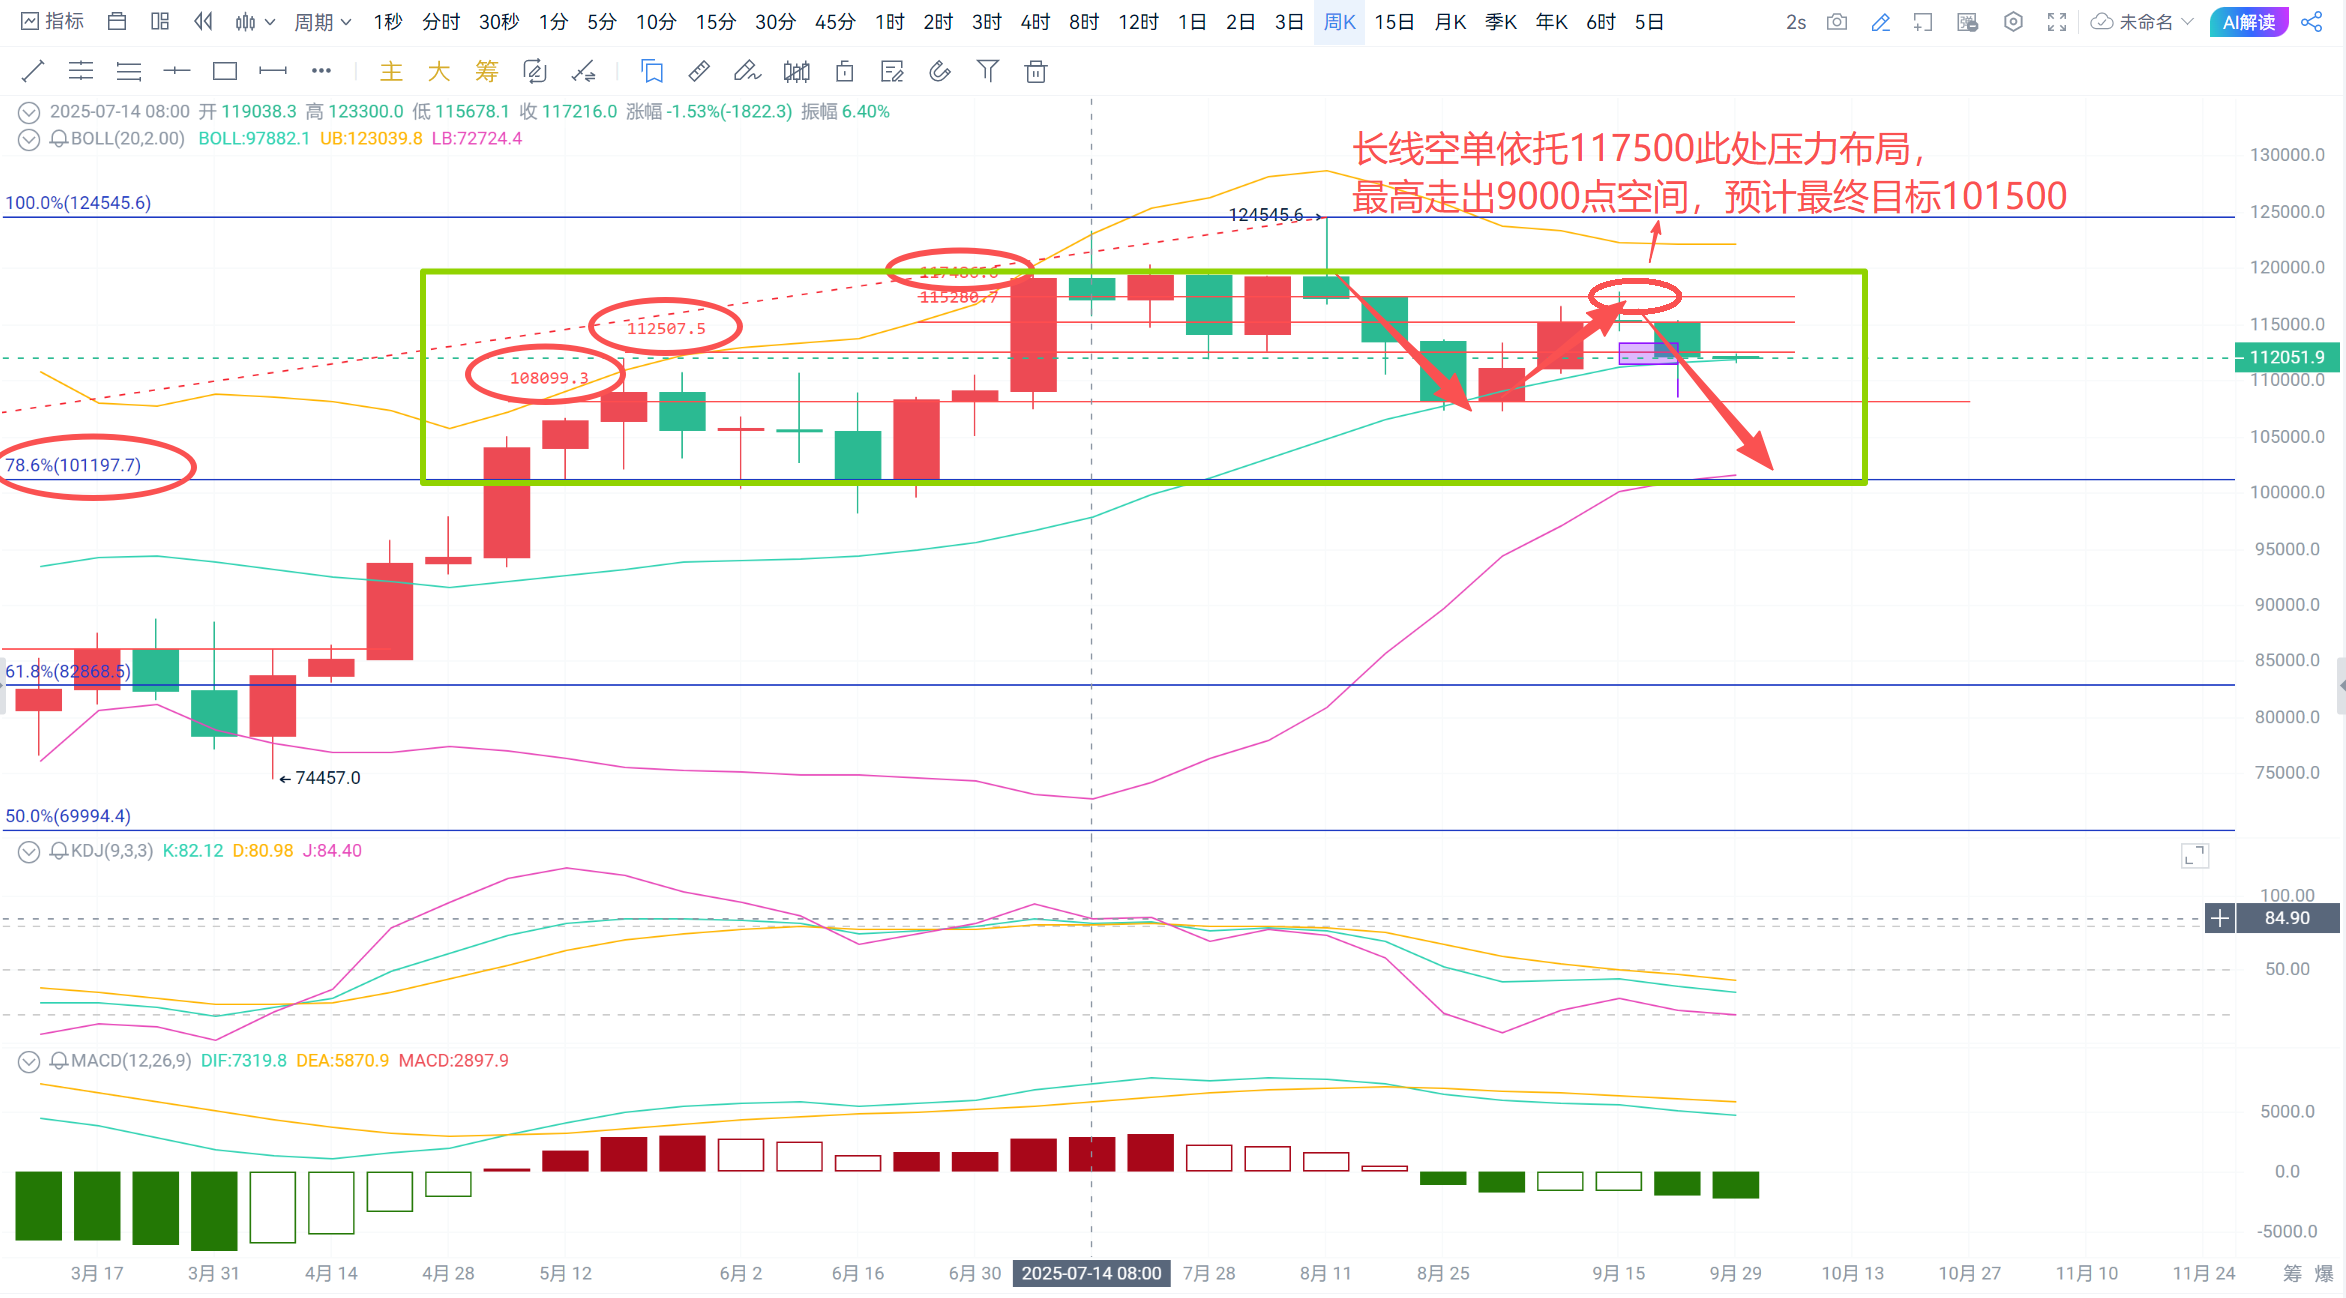
Technical Analysis: For Bitcoin, the weekly candlestick closed as a bearish candle near 112100, with the price running to the middle support of the Bollinger Bands. The Bollinger Bands are running flat, and the MACD moving average is trending downwards, with bearish volume continuing to increase. The KDJ is also trending downwards; on the daily level, a bullish candlestick closed near 112100, the Bollinger Bands are starting to converge, the MACD moving average continues to trend downwards, bearish volume is starting to decrease, and the KDJ is beginning to trend upwards. On the 4-hour level, the Bollinger Bands are starting to open upwards, the MACD moving average continues to trend upwards, bullish volume continues to increase, and the KDJ line is starting to flatten and trend upwards;
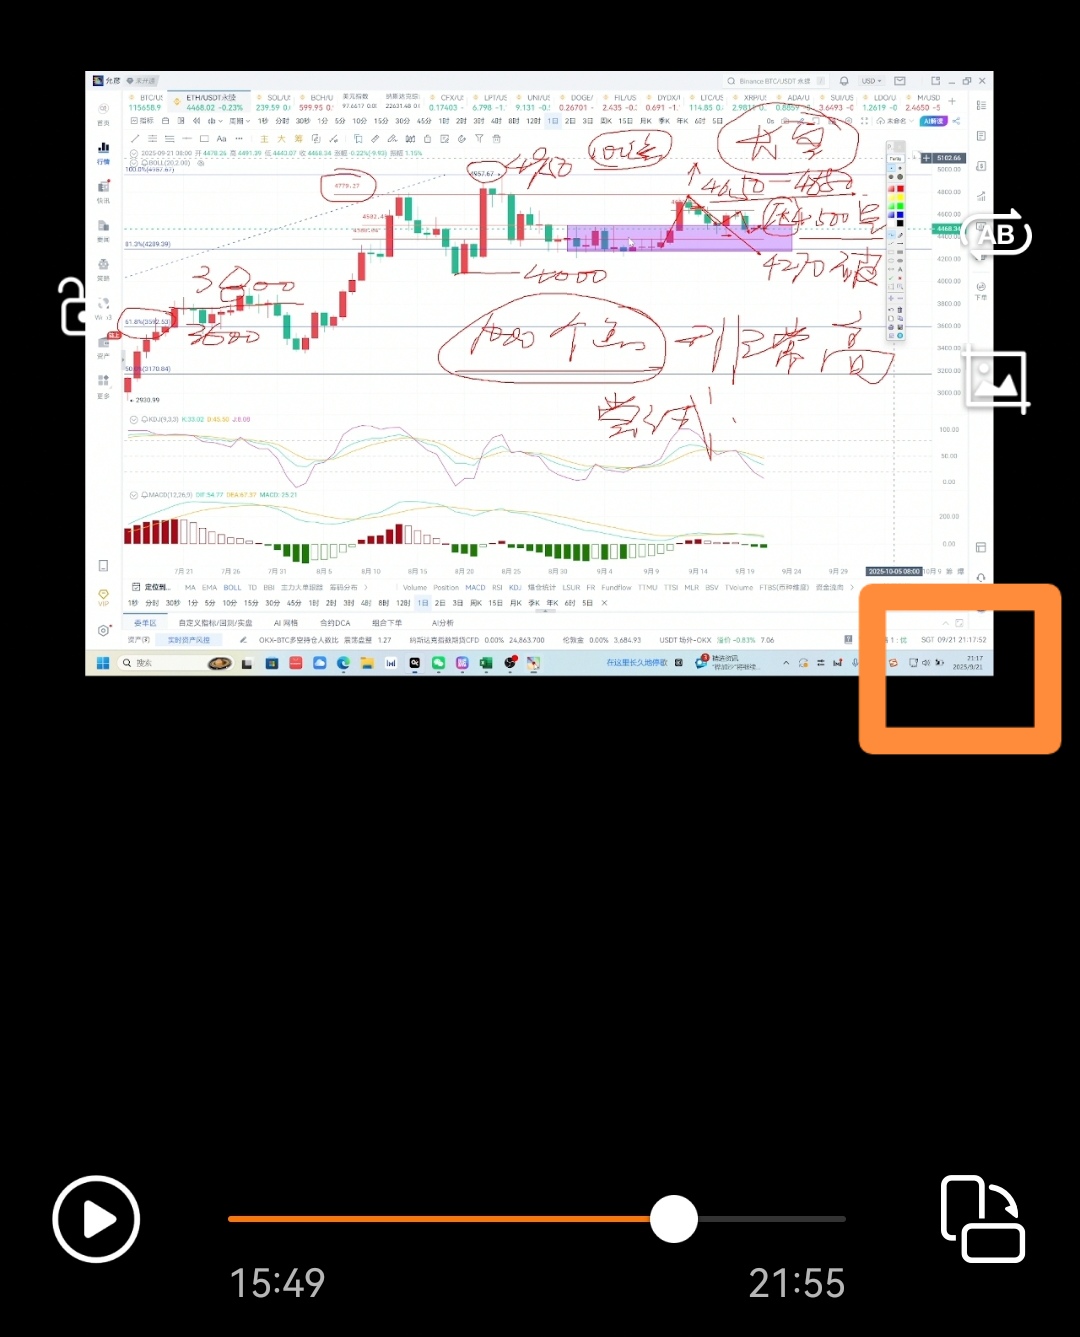
For Ethereum, the weekly candlestick closed as a bearish candle near 4140, with the Bollinger Bands converging upwards, the MACD moving average trending downwards, and bullish volume continuing to decrease, while the KDJ line is trending downwards; on the daily level, a bullish candlestick continues to close near 4140, the Bollinger Bands continue to open downwards, the MACD moving average continues to trend downwards, bearish volume is starting to decrease, and the KDJ line is beginning to flatten and trend upwards. On the 4-hour level, the Bollinger Bands are starting to run flat, the MACD moving average is starting to trend upwards, bullish volume continues to increase, and the KDJ line is starting to flatten and trend upwards;
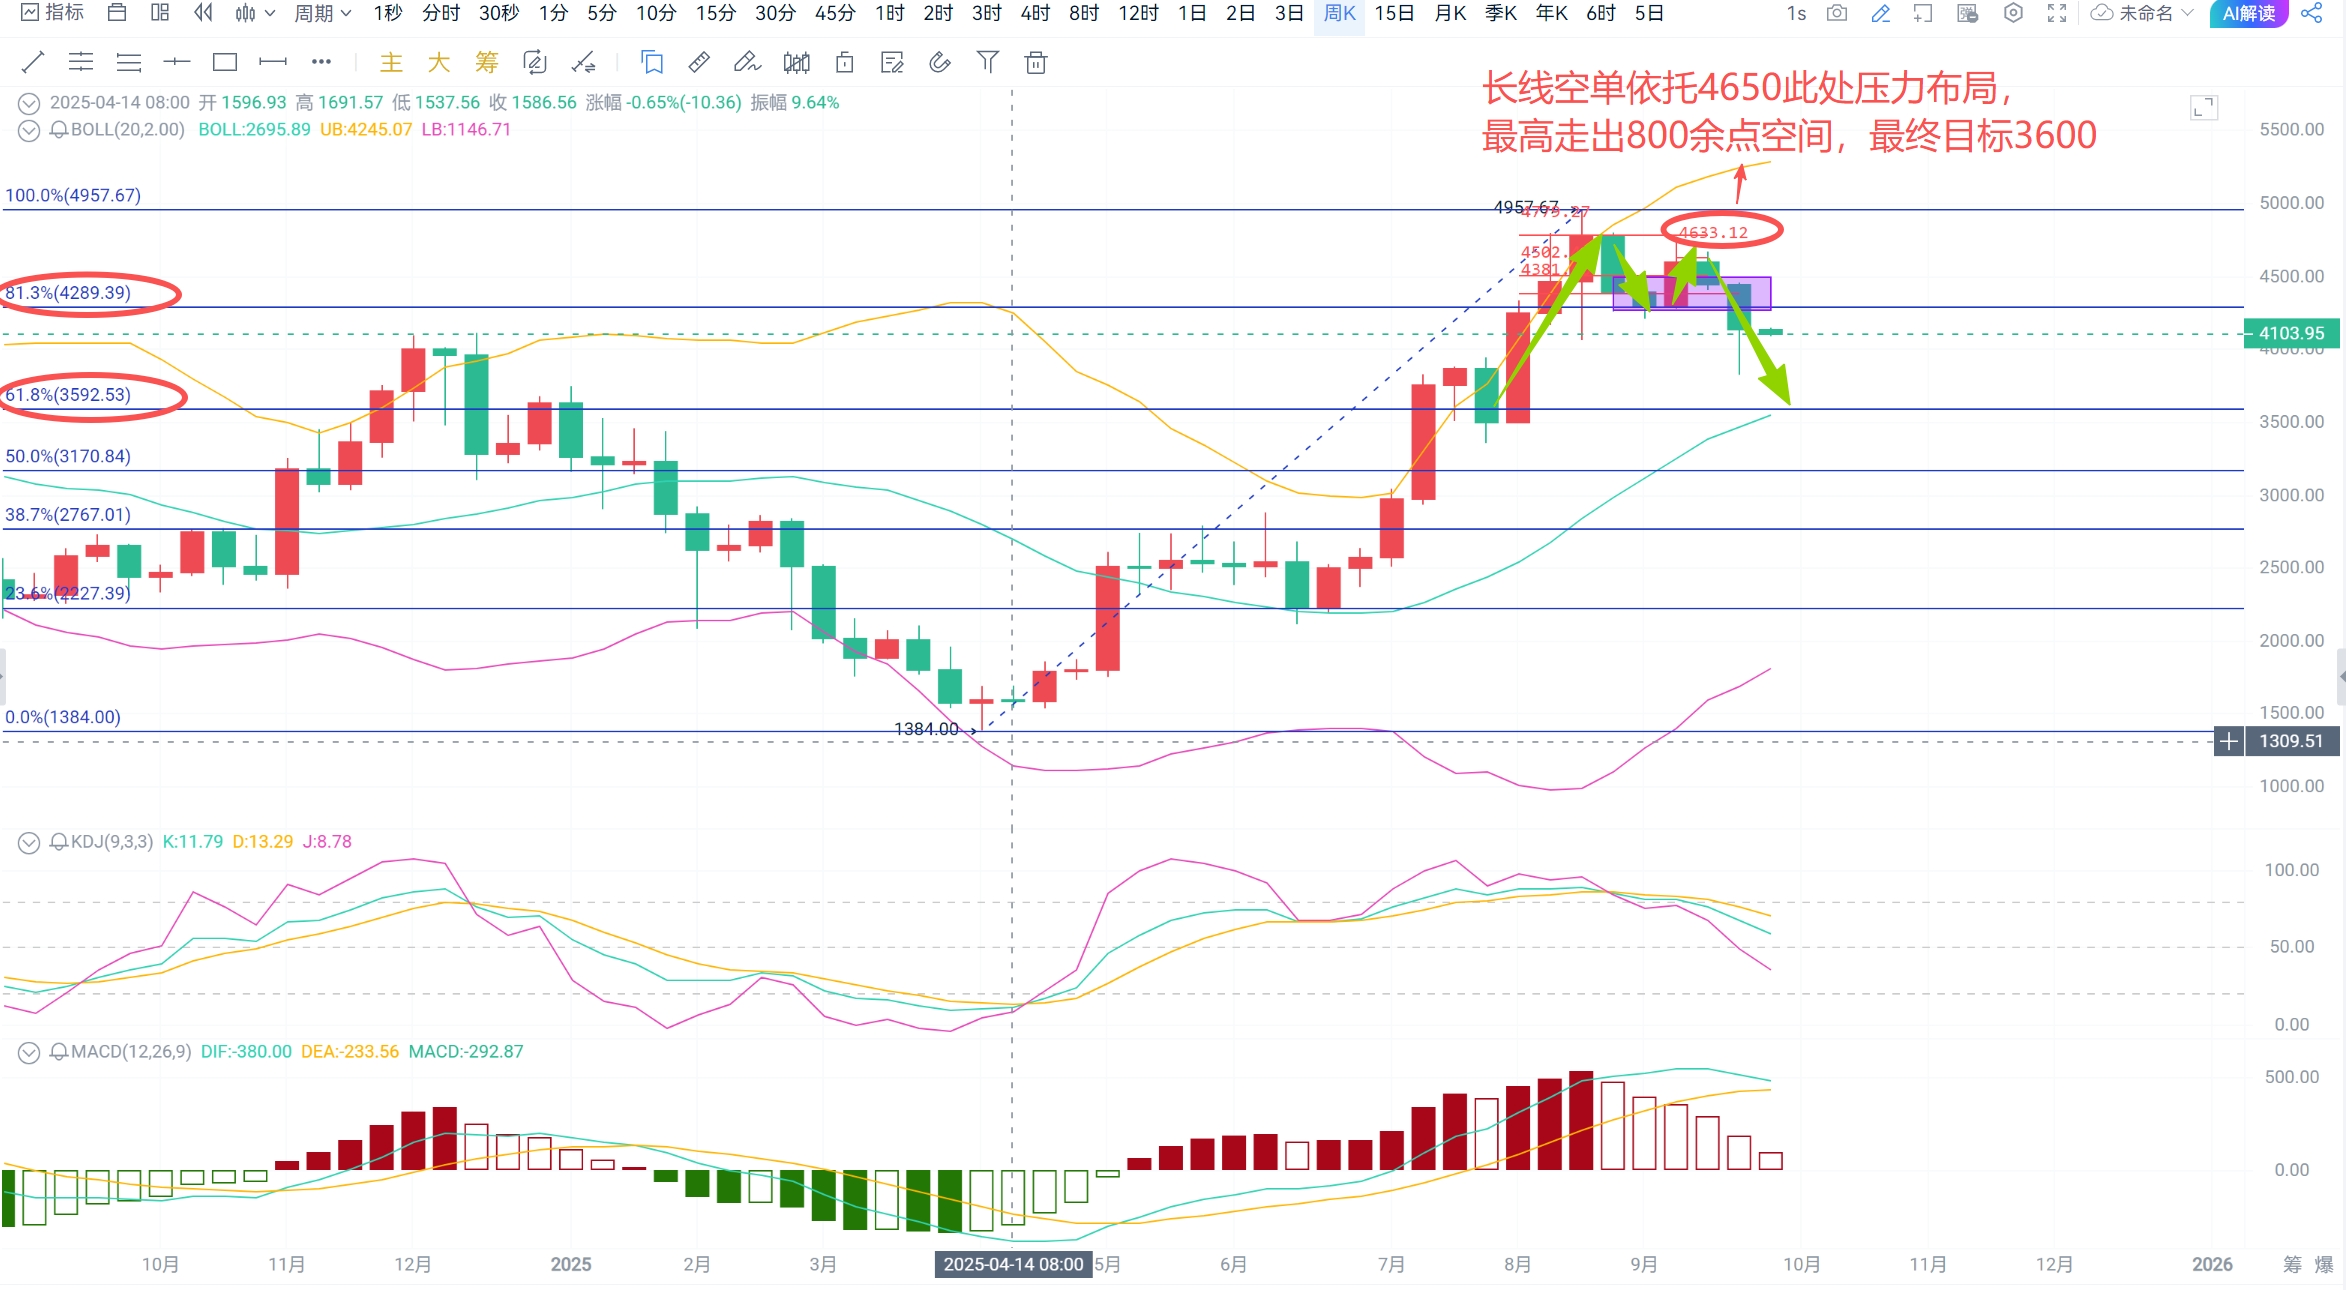
Currently, the market is experiencing a rebound from an oversold condition. Bitcoin is under pressure at the key resistance level of 112500, while Ethereum's previous box bottom at 4270 serves as a key resistance level, which can be seen as a dividing line between bulls and bears. As long as it does not break above this level before rebounding, the trend will not change. Therefore, it is advisable to continue to short based on the upper resistance levels!
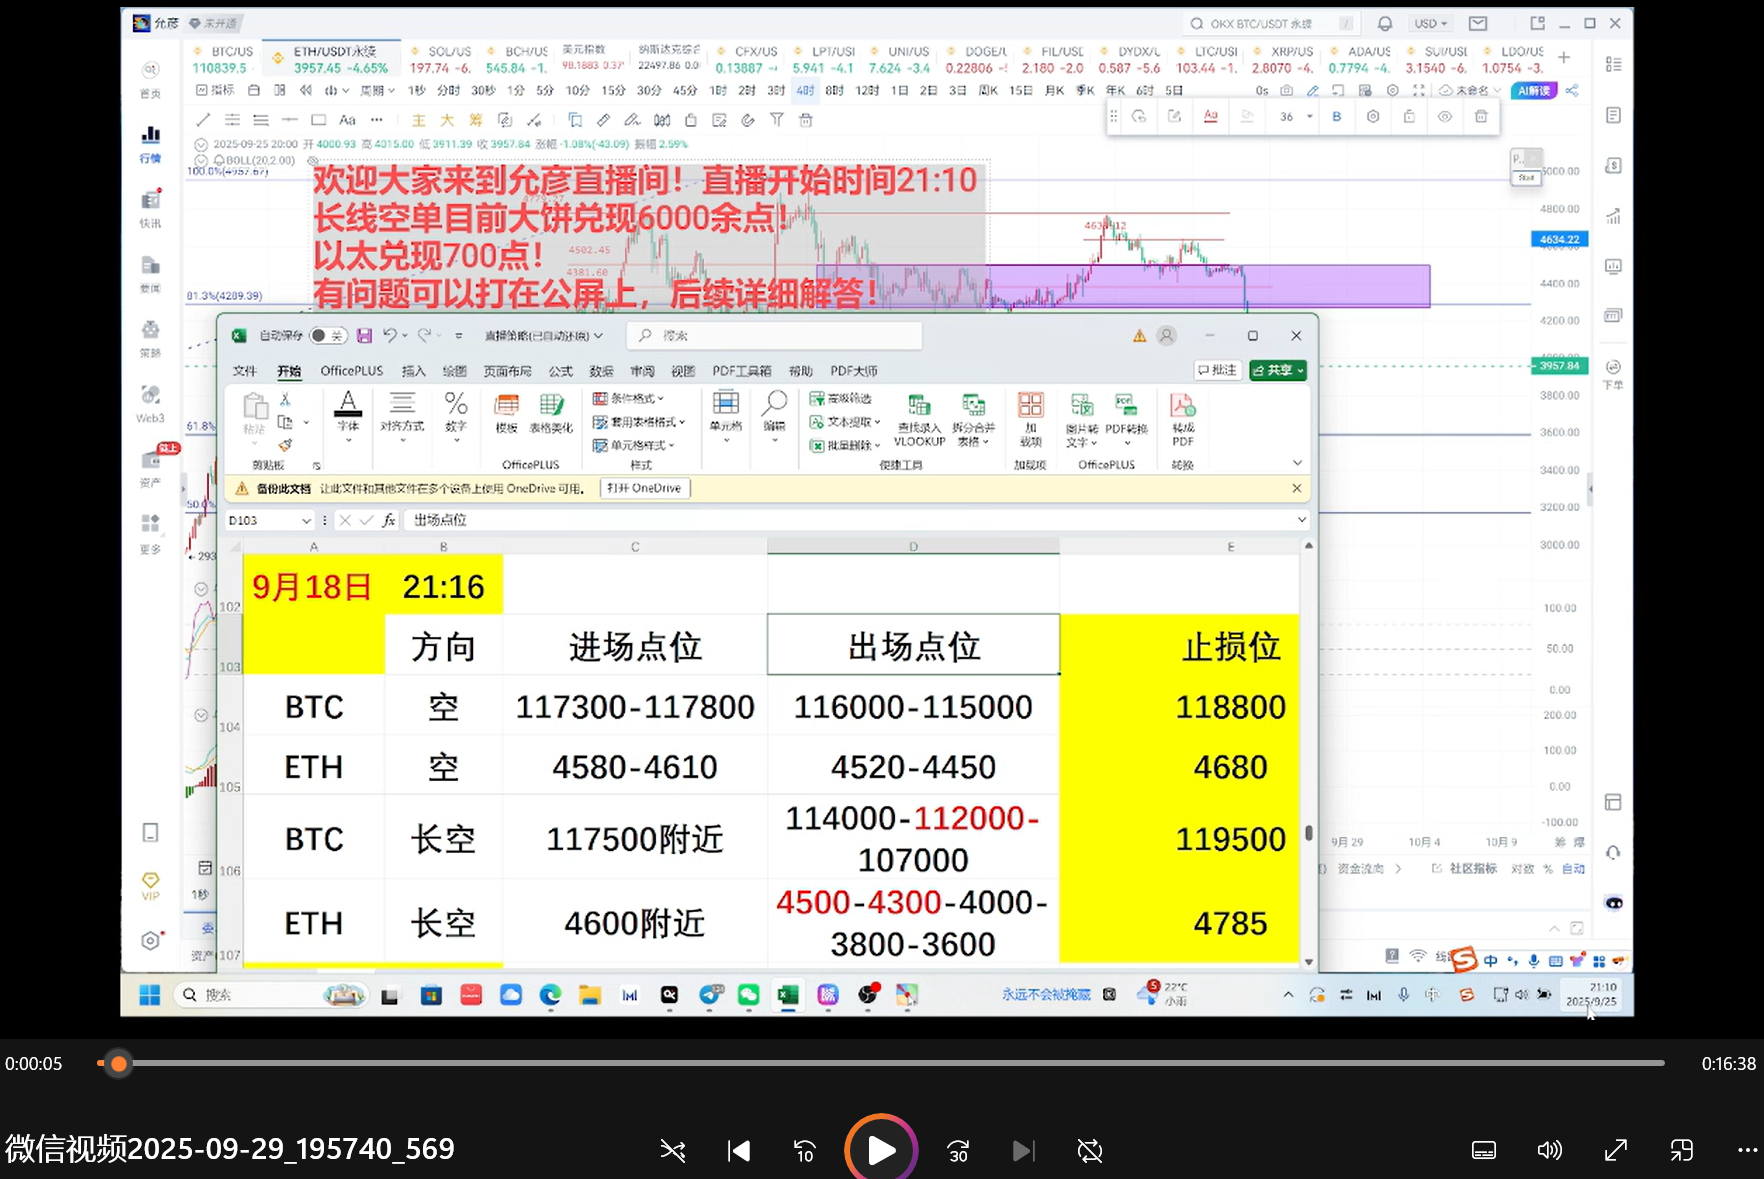
Trading Suggestions: Short near the resistance levels!
Short Bitcoin at 112300-112800, with a target of 111000-110000. If it breaks, continue to hold. The long-term target has been set; manage the space yourself, with a stop loss at 113500;
Short Ethereum at 4120-4150, with a target of 4050-4000. If it breaks, continue to hold. The long-term target has been set; manage the space yourself, with a stop loss at 4200;
The strategy is time-sensitive; please refer to private real-time guidance for specifics!
Scan the QR code below to follow our WeChat public account and learn more about real-time market dynamics!

免责声明:本文章仅代表作者个人观点,不代表本平台的立场和观点。本文章仅供信息分享,不构成对任何人的任何投资建议。用户与作者之间的任何争议,与本平台无关。如网页中刊载的文章或图片涉及侵权,请提供相关的权利证明和身份证明发送邮件到support@aicoin.com,本平台相关工作人员将会进行核查。


