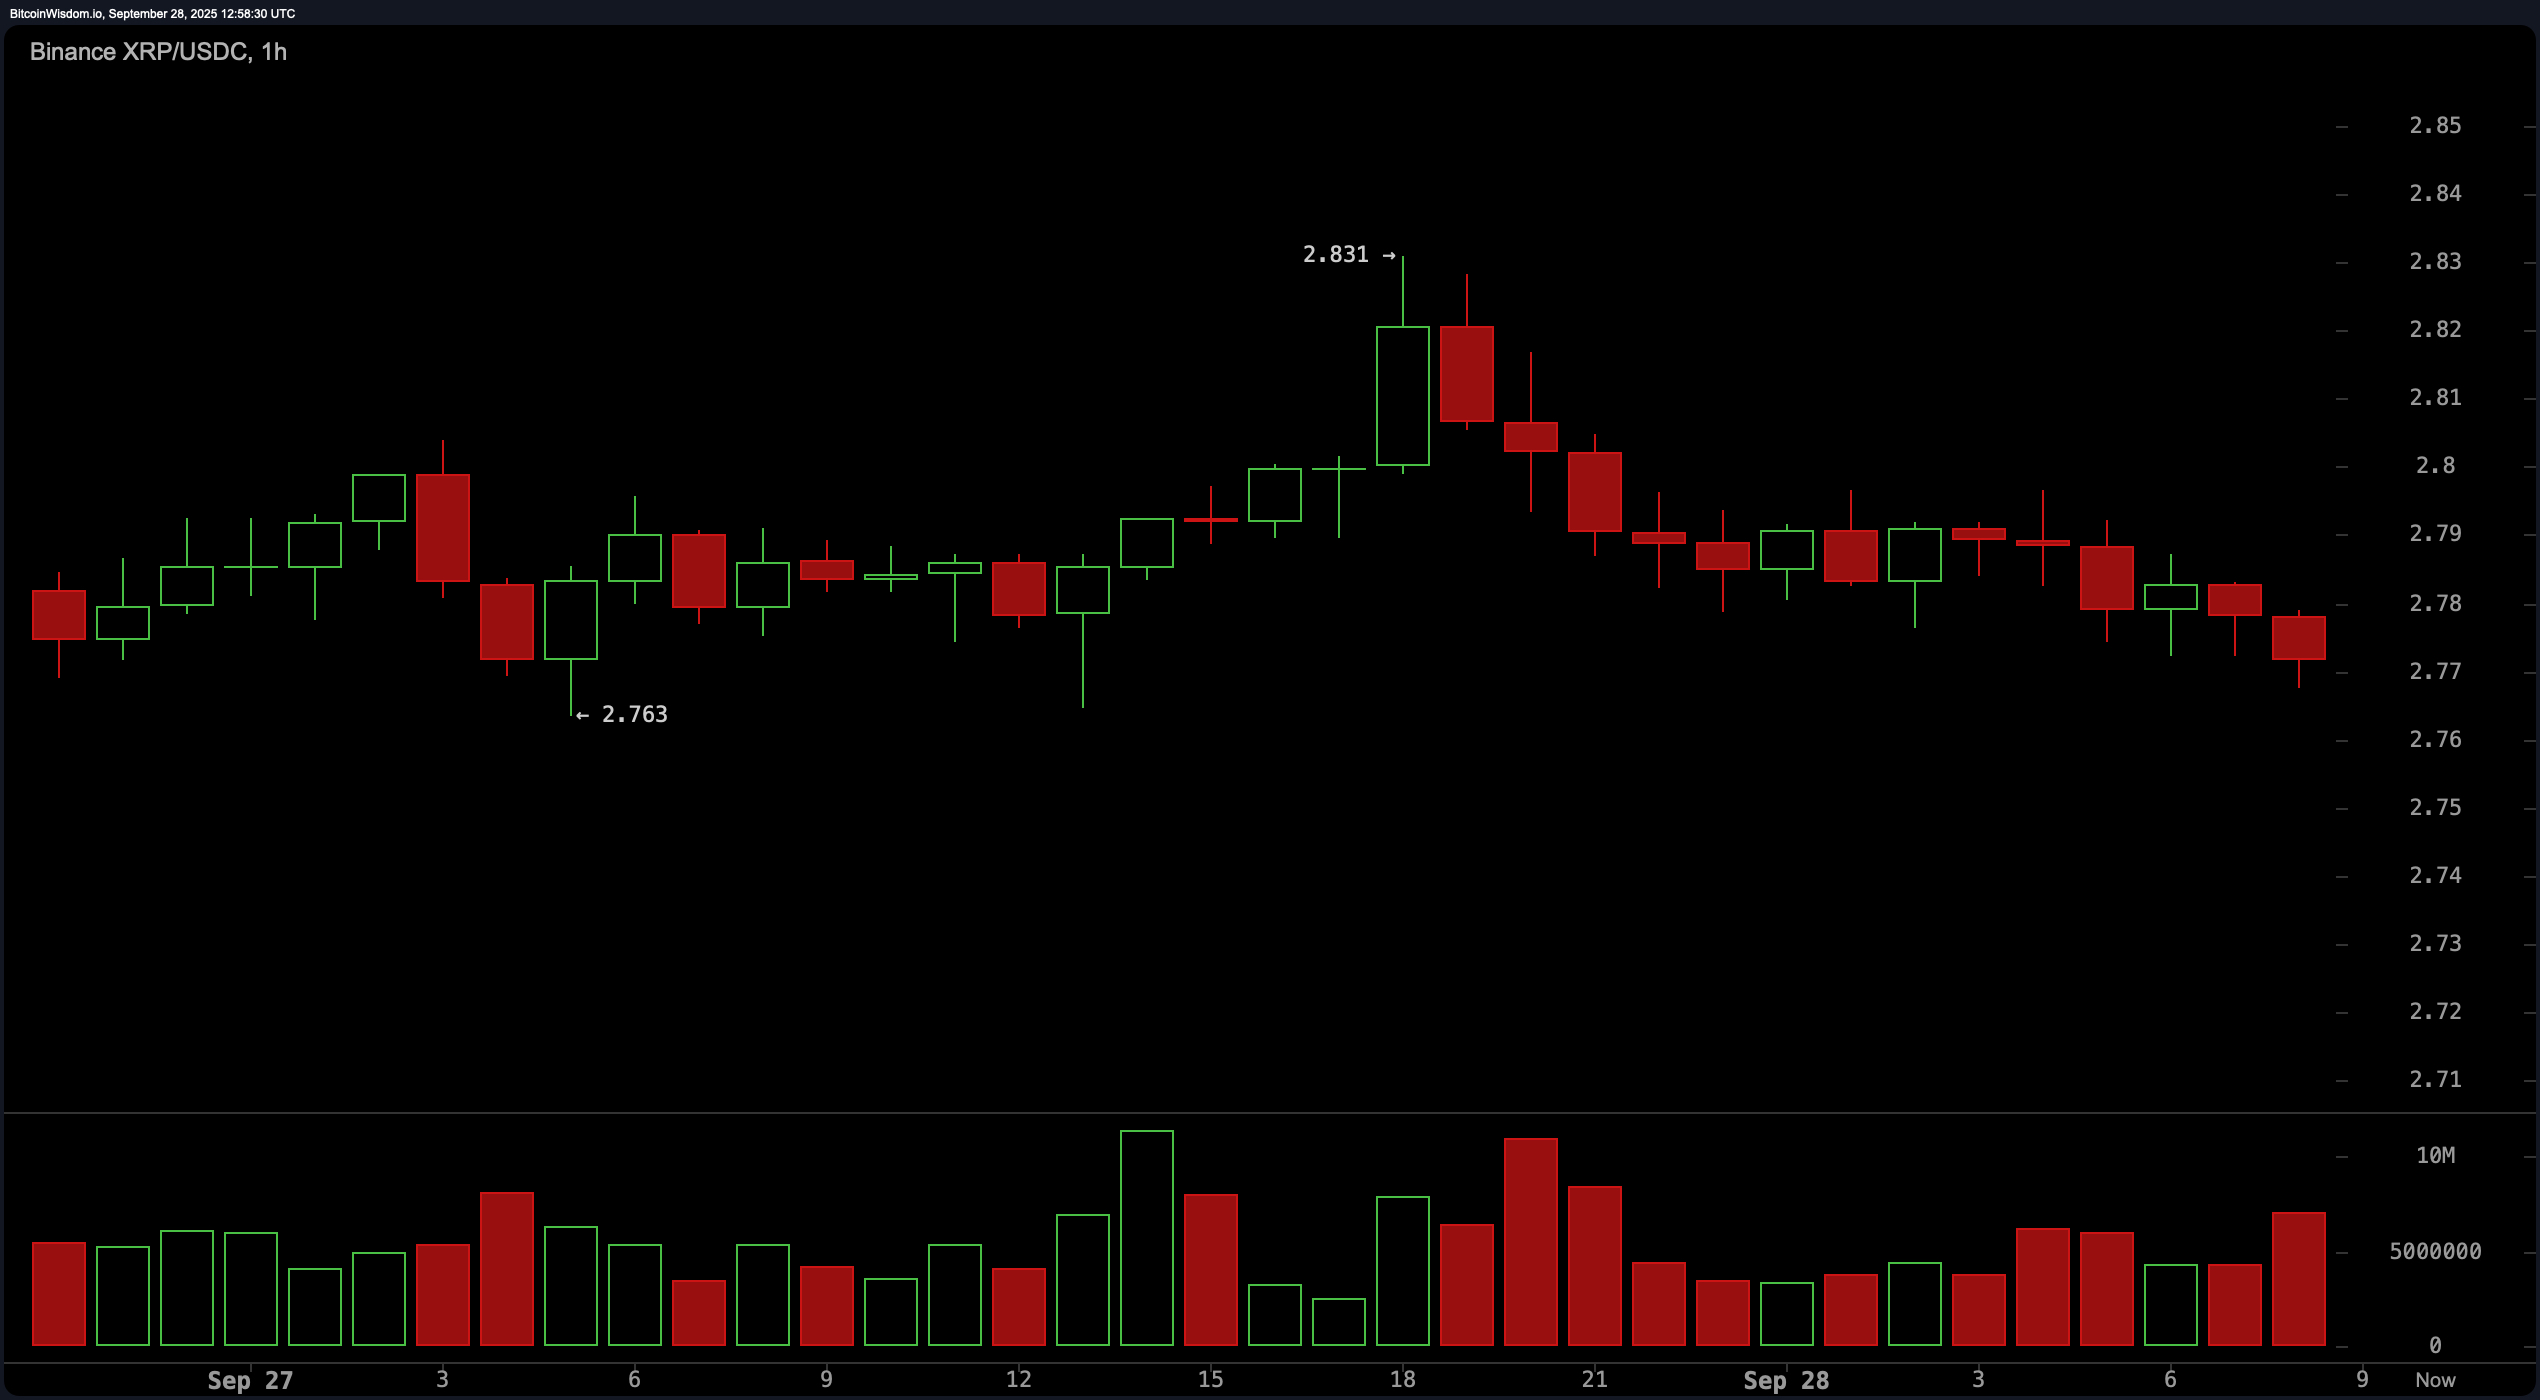
On the 1-hour chart, XRP is pacing nervously between $2.76 and $2.83, failing to commit to either a breakout or a breakdown. The attempt to push past $2.831 was quickly snuffed out, making the current micro-range look more like a trap than an opportunity.
The rise in red candles with expanding bodies spells growing intraday selling pressure, while the pitifully weak volume on bounces screams “no conviction.” Traders eyeing short-term gains might scalp between $2.76 and $2.81, but risk-to-reward here is thinner than a pancake at a Sunday brunch. Unless $2.83 is shattered with real volume, consider the bulls benched.

XRP/USDC via Binance on Sept. 28, 2025, 1-hour chart.
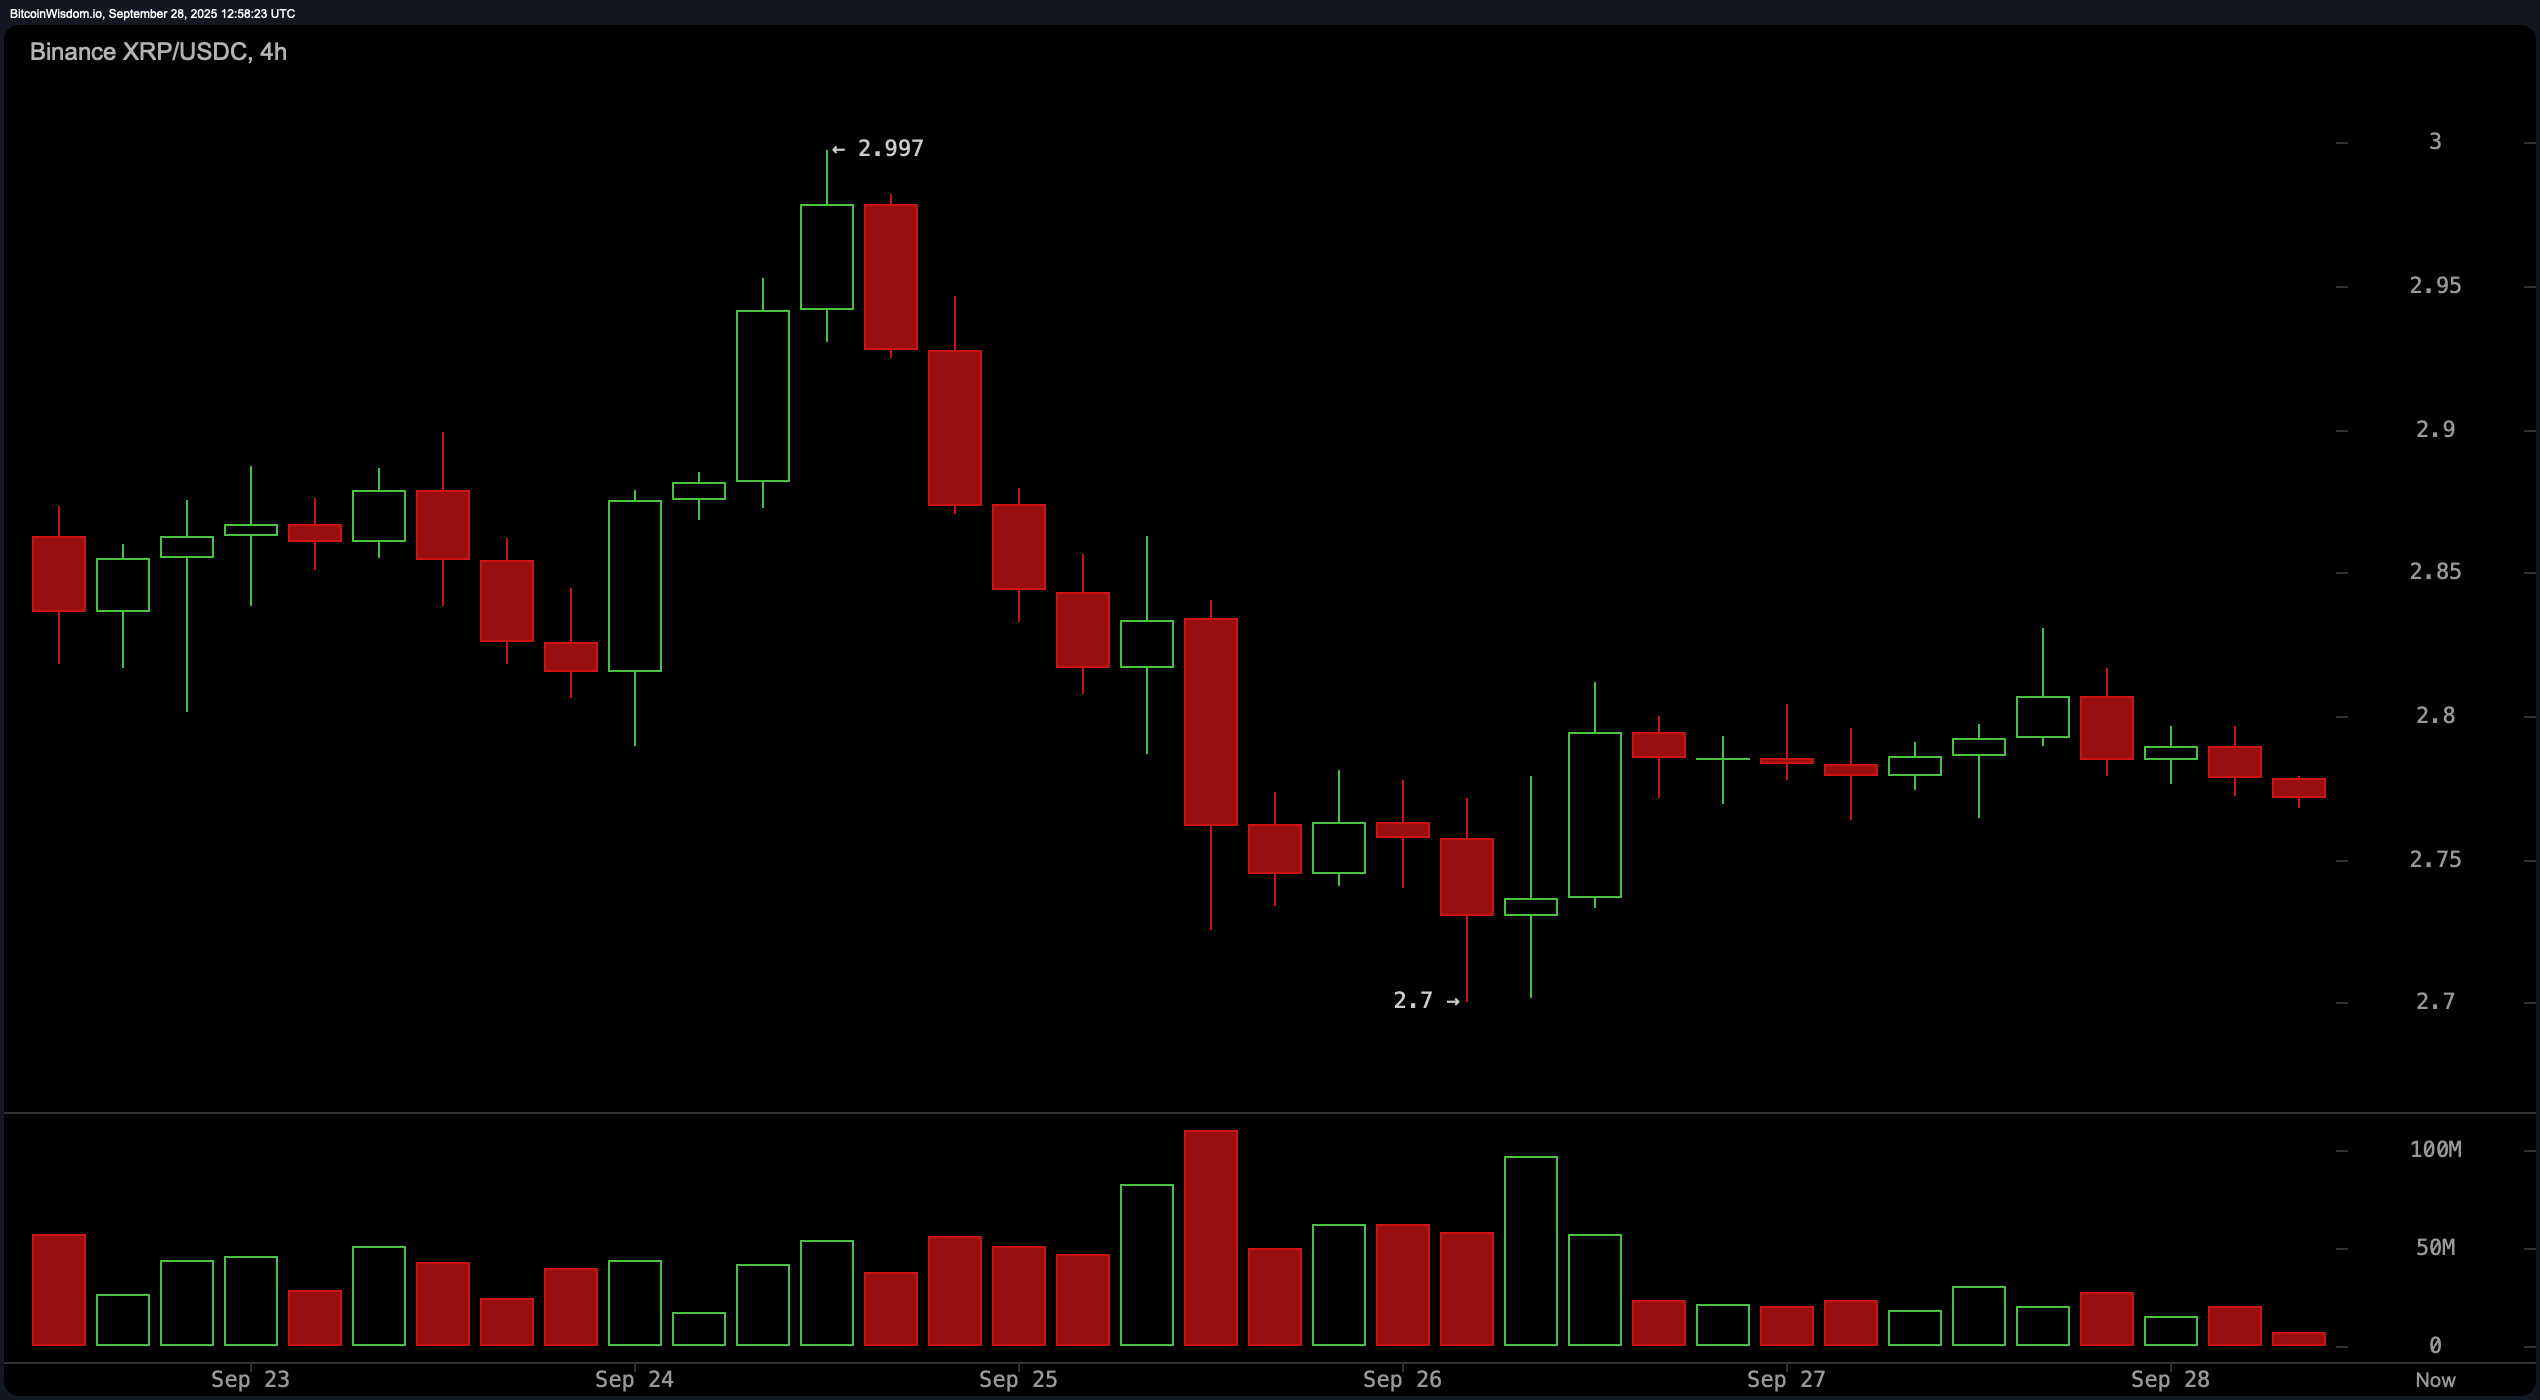
Zooming out to the 4-hour chart reveals a consistent downtrend of lower highs and lower lows, with a failed rally around $2.83 turning into yet another rejection. Support at $2.70 remains the saving grace, but it’s looking worn. The volume profile shows a clear drop-off on every green candle—like a boxer throwing punches underwater. This timeframe advises scalpers to be nimble: long entries near $2.70 might be viable if you like walking on tightropes. But unless a 4-hour candle closes above $2.83 with gusto, don’t expect a turnaround.

XRP/USDC via Binance on Sept. 28, 2025, 4-hour chart.
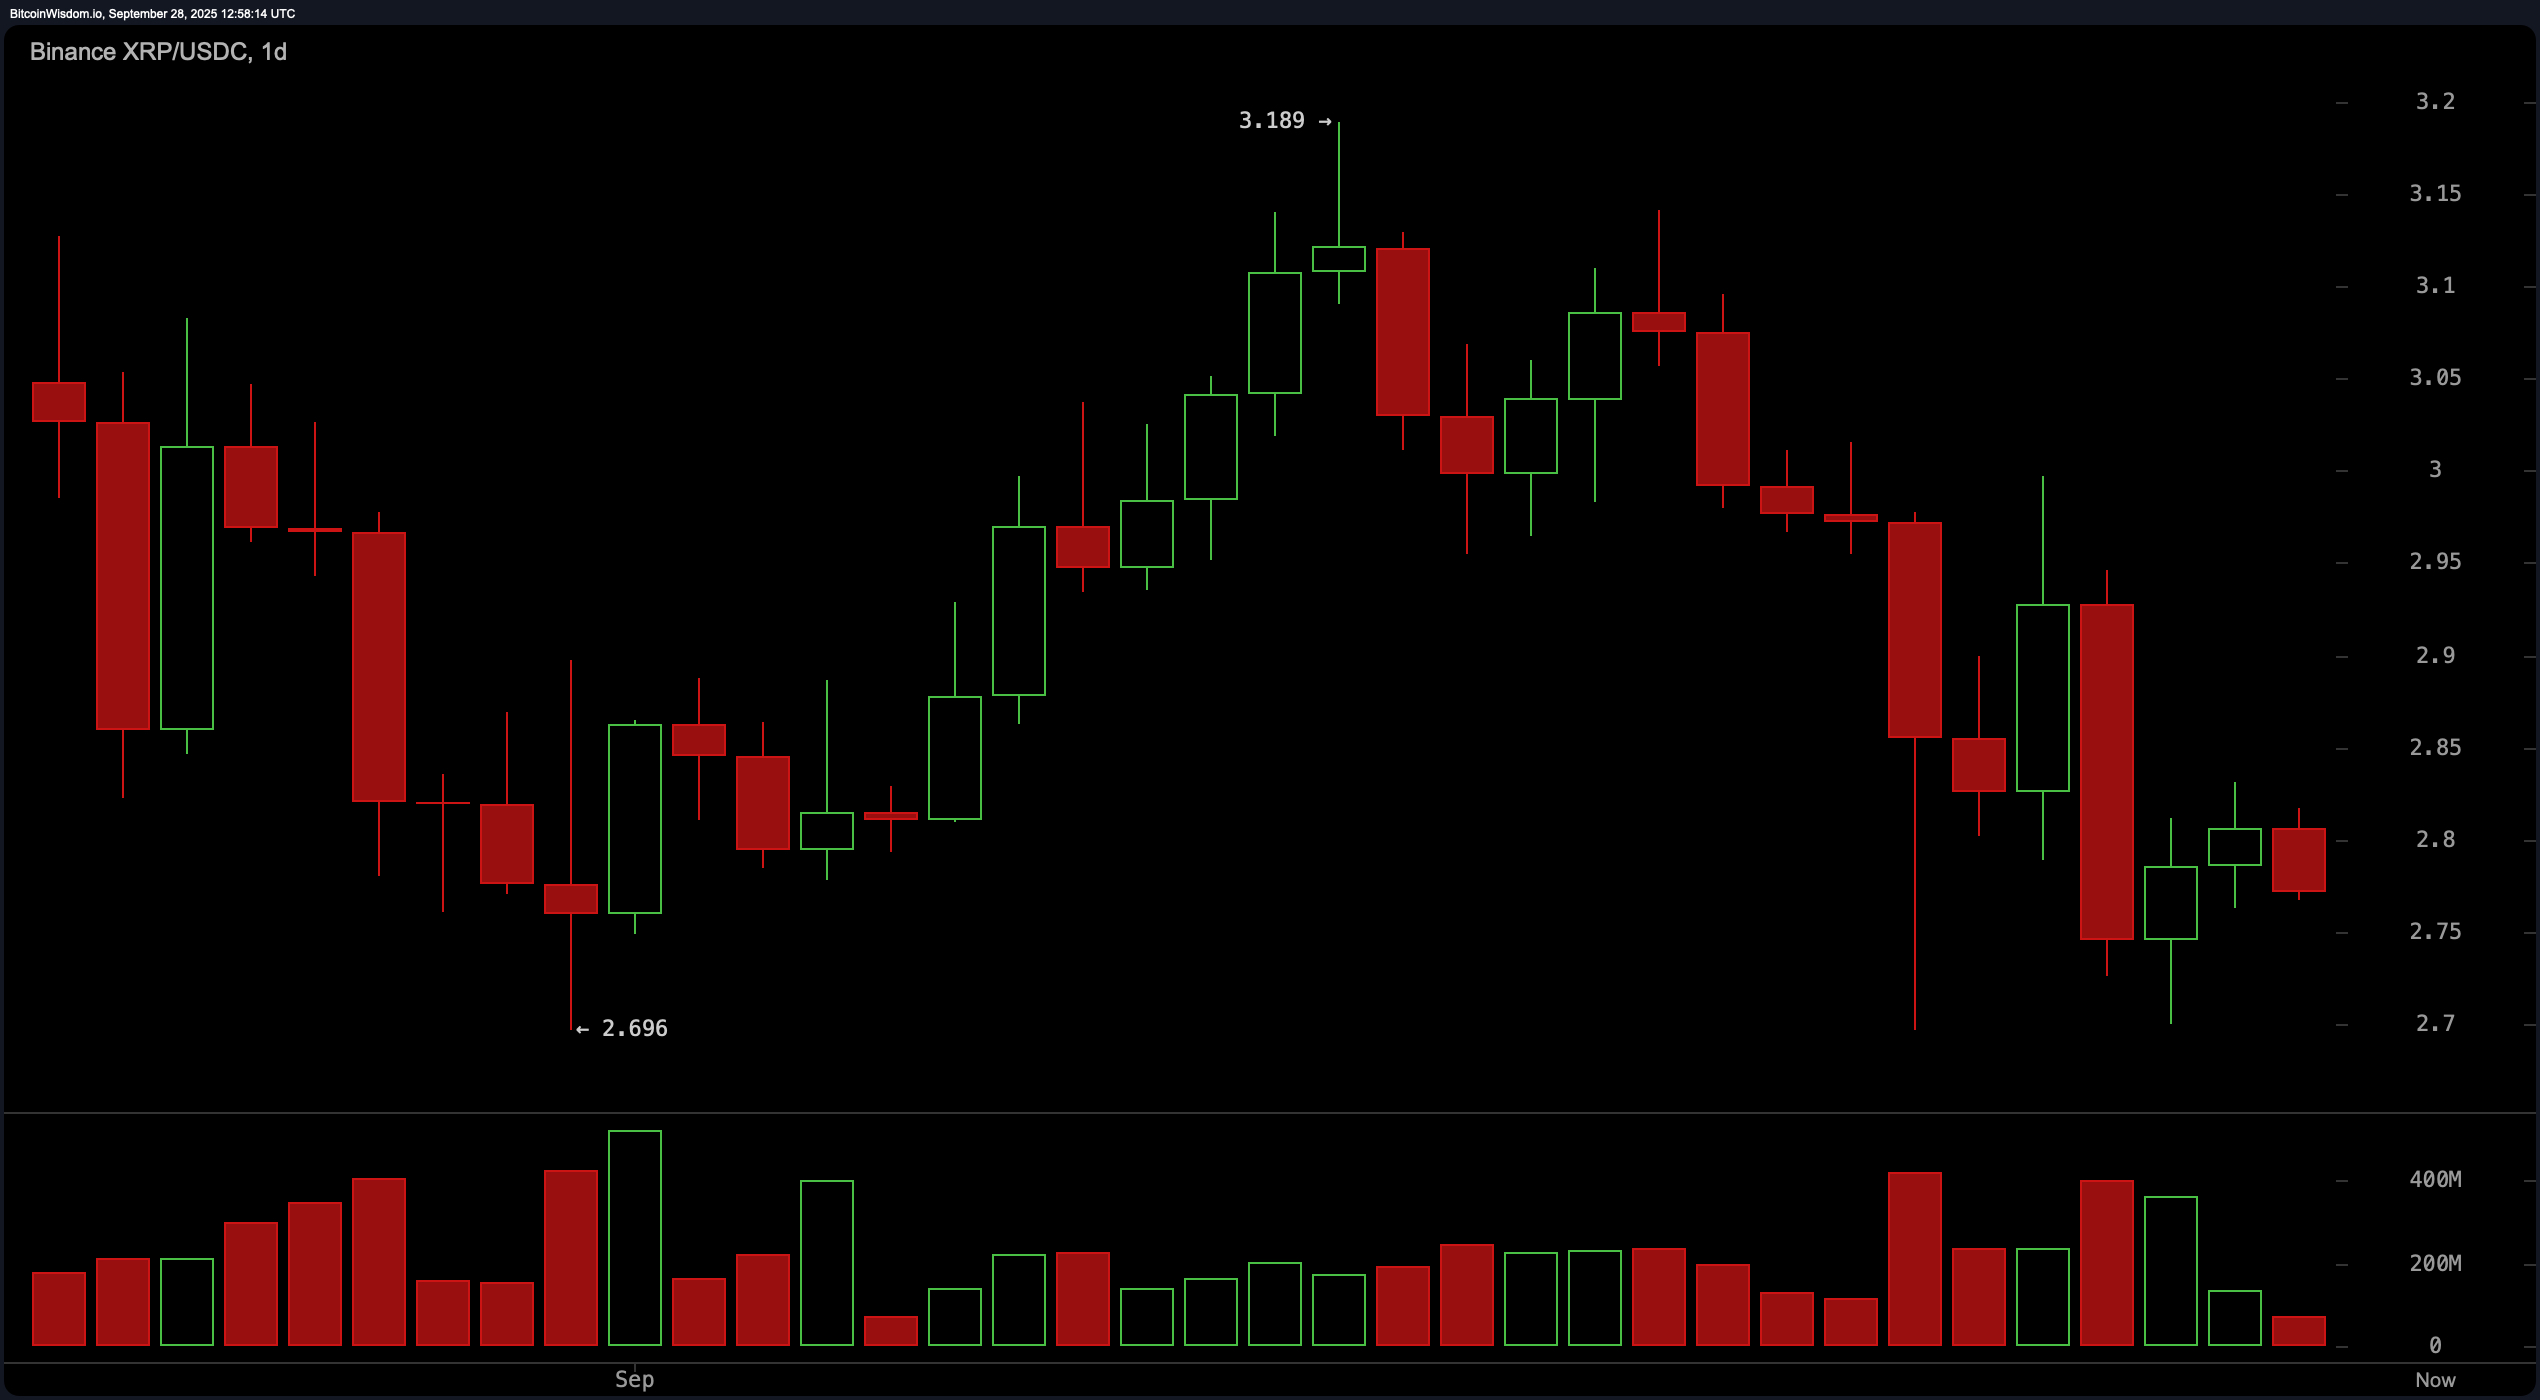
The daily XRP chart paints a broader—but still bleak—picture. XRP previously rallied to a peak of $3.189 before being slapped down into a sideways crawl between $2.70 and $2.83. Lower highs suggest that bullish strength is ebbing like a tide at dusk. What’s more, strong volume on down days and barely-there volume on bounces further confirms that sellers are holding the wheel. Long wicks on both ends of recent candles scream indecision, typically a sign of either an incoming breakout or breakdown. Traders should eye an entry above $2.85, provided there’s a solid volume surge. Otherwise, stay on the sidelines and let the chart sort itself out.

XRP/USDC via Binance on Sept. 28, 2025, 1-day chart.
Looking at the day’s oscillators, the landscape is a mixed bag of ambiguity. The relative strength index (RSI) stands at 40.59—neutral territory, neither oversold nor overbought. The Stochastic oscillator lingers at 20.32, also neutral, while the commodity channel index (CCI) dives to -119.36, giving off a lone bullish signal. Meanwhile, the average directional index (ADX) at 17.59 warns that the trend is too weak to trust. The Awesome oscillator (AO) at -0.10675 leans neutral, and the momentum indicator comes in at -0.30109, flashing a bearish sign. The moving average convergence divergence (MACD) level of -0.04569 also issues a negative call. So, in oscillator land, we’re looking at a lukewarm brew—nothing hot, nothing ice-cold.
As for the moving averages (MAs), XRP’s current price action is under a veritable ceiling of red flags. The exponential moving averages (EMAs) for 10, 20, 30, 50, and 100 periods all suggest bearish action, with the 200-period EMA at $2.607 providing the only breath of bullish air. The simple moving averages (SMAs) echo this bearish chorus, with all except the 200-period SMA—sitting at $2.548. In short, XRP is trading below most of its significant MAs, reinforcing the bearish trend.
Bull Verdict:
For the optimists among us, XRP still holds a sliver of potential—if, and only if, it can flip the $2.83 resistance with strong volume. A successful breakout with momentum could catapult the price back toward $2.99 or even $3.10. The 200-period exponential and SMAs are whispering bullish potential, but the bulls need to stop whispering and start roaring.
Bear Verdict:
The bears are running the show for now, with XRP making lower highs, dragging its feet below key moving averages, and showing little volume on bounces. Unless XRP reclaims $2.85 convincingly, the risk of a drop to $2.65 or lower remains high. Momentum indicators and short-term charts both agree: sit tight or short smart—bulls are currently out of breath.
免责声明:本文章仅代表作者个人观点,不代表本平台的立场和观点。本文章仅供信息分享,不构成对任何人的任何投资建议。用户与作者之间的任何争议,与本平台无关。如网页中刊载的文章或图片涉及侵权,请提供相关的权利证明和身份证明发送邮件到support@aicoin.com,本平台相关工作人员将会进行核查。


