Bitcoin.com News has already published explainers on oscillators and moving averages; consider this your next step in the toolkit—an immersive, plain-English tour of Bollinger Bands. The goal is twofold: explain the indicator with authority and show you how to use it without getting chewed up by head fakes. The timely hook is that bitcoin’s weekly compression is historic, which makes now a perfect moment to learn how the bands frame risk and opportunity.
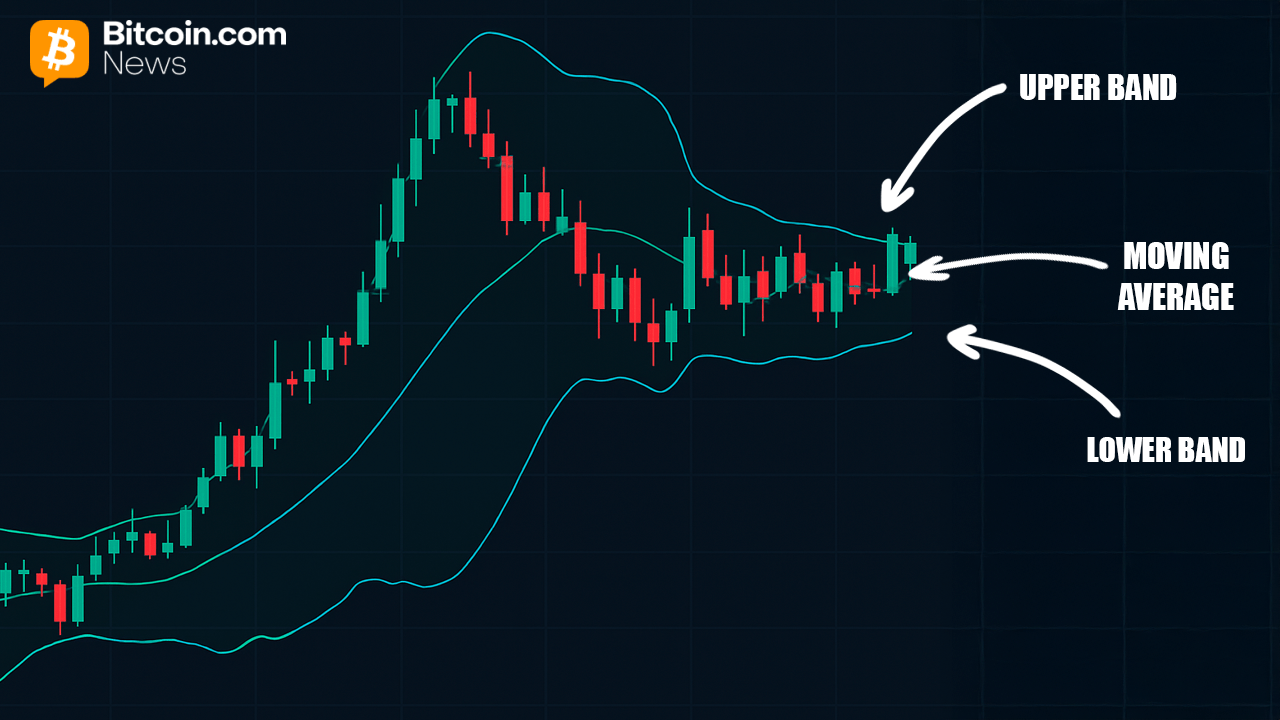
Bollinger Bands are a volatility envelope that adapts to the market’s breathing. The middle line is a simple moving average (SMA)—with the 20-period SMA being the default—while the upper and lower bands sit an equal distance away, commonly two standard deviations. When price action calms, the bands cinch; when price heats up, they expand. This dynamism is the point: unlike rigid price envelopes, Bollinger Bands adjust to whatever regime the market is in, giving you a relative read on high and low rather than an opinionated one.
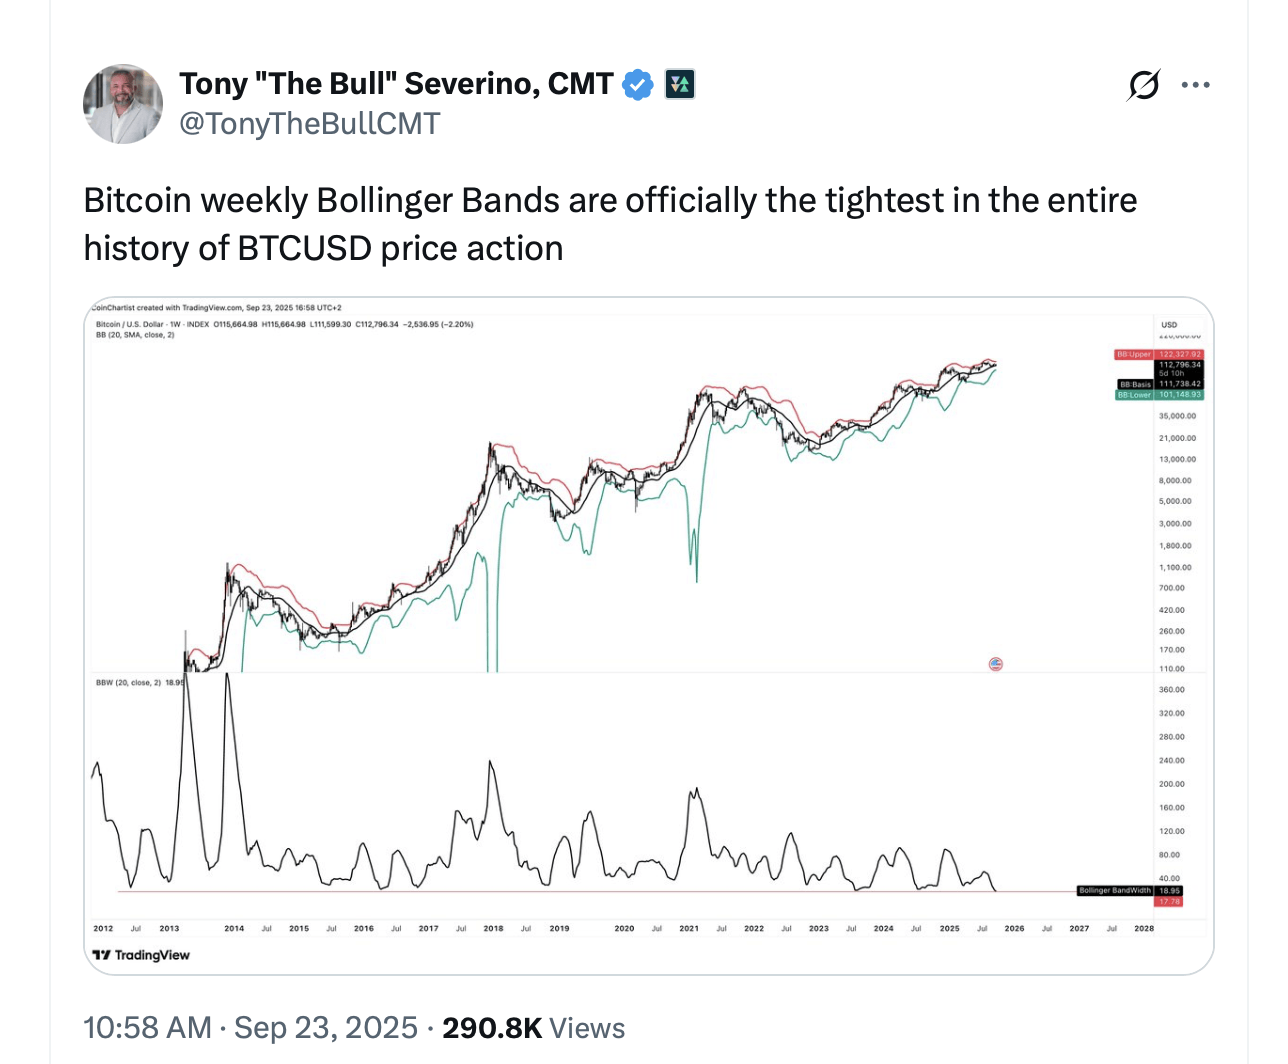
The current bitcoin setup is all about that “squeeze.” A squeeze is simply an extreme contraction in the bands—often measured by Bandwidth, which normalizes the distance between upper and lower bands. Squeezes don’t predict direction; they signal that a market is storing energy. The release—an expansion phase—tends to create the sort of trends traders remember and pundits invent narratives around. On the weekly chart today, that contraction is as tight as it’s ever been, which is why seasoned traders are alert for a decisive break and confirmation.

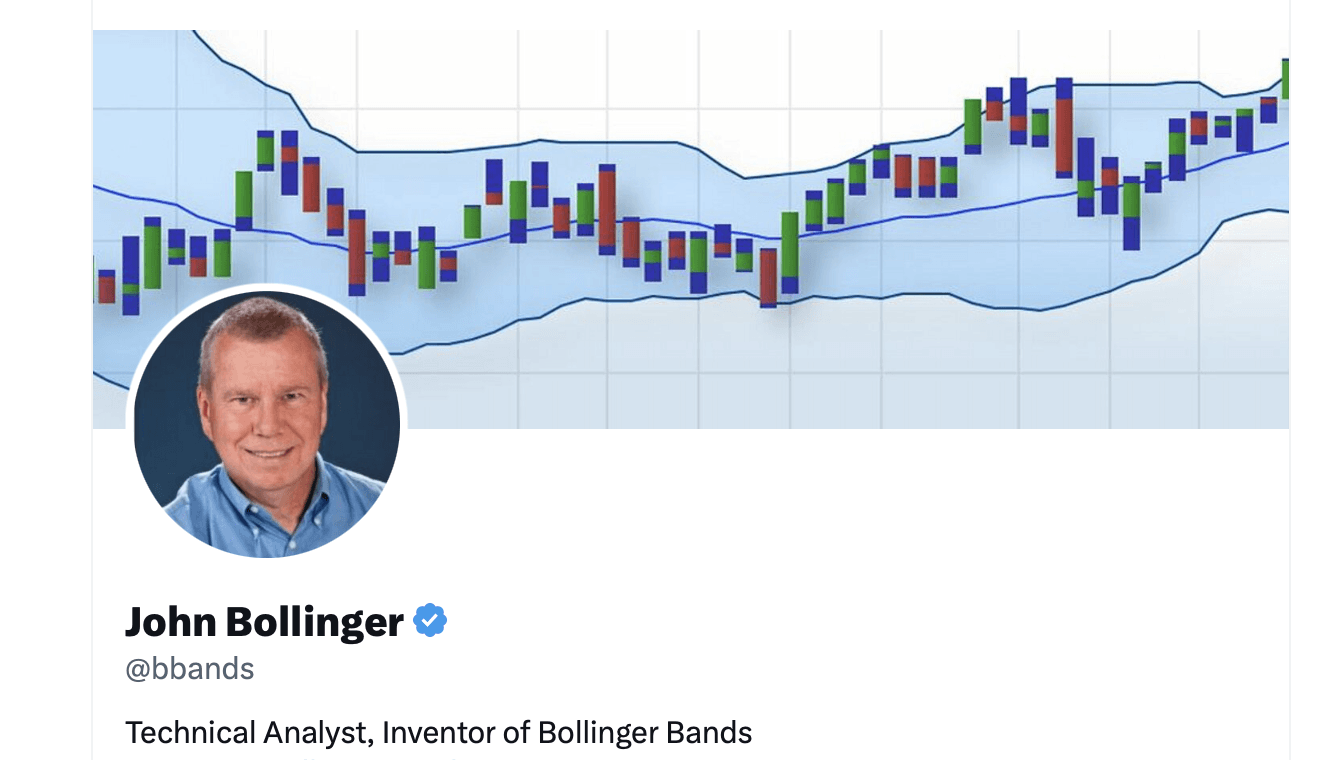
John Bollinger, the inventor of Bollinger Bands.
A quick origin story, because names matter. Bollinger Bands were developed by John Bollinger in the early 1980s as a more intelligent alternative to fixed-width trading bands. By keying the envelope to standard deviation—a moving measure of dispersion—the bands became self-tuning: snug in quiet markets, wide in chaotic ones. The approach matured through the 1990s as charting software went mainstream and was formalized in “Bollinger on Bollinger Bands” (2001). Related measures, such as percent-B (%b), which shows where the price sits within the envelope, and Bandwidth, which quantifies contraction/expansion, round out the toolkit.
So how do you use this without turning every touch into a knee-jerk trade? First, treat band tags as context, not destiny. A push outside the upper band can be the start of a trend or just a stretch that snaps back. In strong advances, price can “walk the band” (ride the upper rail) for far longer than short-sellers find comfortable; in declines, the reverse applies along the lower band. The message is humility: the bands show you where you are in the current distribution, not what must happen next.

Second, confirmation is your friend. Many traders wait for follow-through after a band break: not just a single candle poking its head through the upper rail, but a close with momentum support—say, oscillators, like the relative strength index (RSI) lifting alongside, or moving average convergence divergence (MACD) flipping from negative to positive slope. Some add volume filters to separate real expansion from bored chop. In other words, you’re looking for alignment: a volatility expansion that agrees with trend and momentum rather than contradicting them.

A simple and very basic Bollinger Bands diagram.
Third, let the regime guide the strategy. In a genuine squeeze-and-expand phase, breakout tactics can shine—entries in the direction of the move with risk defined near the middle band or the opposite rail. In rangy markets where price ping-pongs between bands, mean-reversion tactics (fade extremes, harvest the middle) can outperform. In established trends, buying pullbacks toward the middle band—or even riding a “walk the band” with trailing stops—often makes more sense than fighting the tape. Backtests on bitcoin suggest the tool can be productive when married to sane risk controls, though false breaks and drawdowns remain part of the game.
All of this loops back to today’s weekly compression. Historically, bitcoin’s biggest expansions followed unusually tight squeezes—late 2016 into 2017, late 2023 into early 2024, and the mid-2025 fireworks after another tight weekly coil. The tapes aren’t identical, but the rhyme is familiar: quiet bands, breakout, trend. The present coil carries the same DNA, only tighter. That argues for preparedness, not prophecy. Define invalidation, size positions like an adult, and let the market prove its case with expansion and follow-through rather than wishful thinking.
A final bit of practical advice for readers who prefer a checklist to a crystal ball. When Bandwidth is scraping historical lows on the weekly chart, mark the upper and lower rails as your volatility tripwires. If price closes above the top band with confirming momentum, you have the beginnings of an expansion play; if price knifes below the lower band with confirmation, respect the downside and don’t argue with the tape. Either way, manage the trade by structure—trailing stops along the middle band in trends, profit-taking into extensions if the move accelerates too quickly, and no heroics if the market snaps back and closes back inside the envelope.
Bollinger Bands apply cleanly to both price series and protocol-agnostic contexts, but when we’re talking entries, exits, and risk, we mean bitcoin’s price action on your chart. With the weekly bands this compressed, the next chapter likely won’t read like a lullaby. It will read like a release—direction to be determined by the breakout, confirmed by momentum, and controlled by the market’s rules. That’s the point of the bands: not to predict the future, but to frame it.
If you’ve mastered oscillators and moving averages, Bollinger Bands are the bridge that turns context into decisions. They won’t make you omniscient. They will help you stay honest when the market stops whispering and starts shouting.
免责声明:本文章仅代表作者个人观点,不代表本平台的立场和观点。本文章仅供信息分享,不构成对任何人的任何投资建议。用户与作者之间的任何争议,与本平台无关。如网页中刊载的文章或图片涉及侵权,请提供相关的权利证明和身份证明发送邮件到support@aicoin.com,本平台相关工作人员将会进行核查。


