Source: Blockworks
Original Title: Hype: Still Cheap?
Translation and Compilation: BitpushNews
Key Points
In the past few days, the spot trading volume of Hyperliquid has significantly increased. Further analysis shows that over the past year, the platform has been steadily eating into the market share of centralized exchanges (CEX) in both the spot and perpetual contract sectors. Hyperliquid's revenue run rate (HyperCore + HyperEVM) has also reached an all-time high, with a circulating P/S (Price/Sales) ratio of about 12, indicating that HYPE is either undervalued or that the valuations of most L1 (Layer 1) public chains are too high. Although the unlocking of core contributors in November (tokens accounting for 23.8% of the total supply will begin linear unlocking) poses a significant risk, we believe HYPE is currently the most attractively valued L1 token.
Key Details
Hyperliquid vs. CEXs: Market Share Shift
1. Surge in Spot Trading Volume and Market Share Erosion
Hyperliquid has seen a significant increase in spot trading volume, especially when compared to CEXs.
Weekend Trading Surge: Last weekend, an unknown entity deposited and sold approximately 22,100 BTC, subsequently buying about 555,000 ETH, with a total value exceeding $2.4 billion.
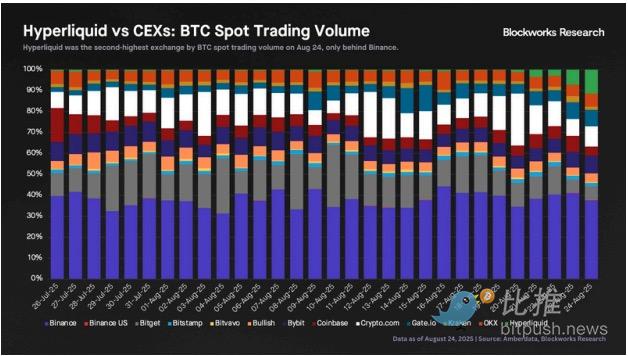
BTC Spot Trading Volume Ranking: This surge in spot trading volume made Hyperliquid the second-largest exchange for Bitcoin spot trading on August 24, capturing 12% of the market share, second only to Binance (38%). This is a significant increase compared to Hyperliquid's average daily market share of about 1% over the past 30 days.
Impact of Single Transaction: It is worth noting that this increase in spot trading volume came from a single entity. While this may be a one-time event, it is still impressive that a decentralized platform was chosen to execute such a large-scale transaction.
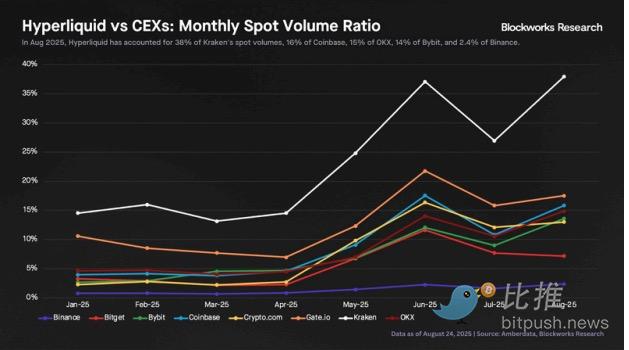
We compared Hyperliquid's monthly spot trading volume with various CEXs (including all assets) and observed that Hyperliquid's market share has been steadily increasing throughout the year:
- This month, Hyperliquid's spot trading volume accounted for 38% of Kraken, 16% of Coinbase, 15% of OKX, 14% of Bybit, and 2.4% of Binance. While all numbers have significantly increased since the beginning of the year, it also indicates that Hyperliquid still has a long way to go to surpass some of the largest CEXs.
2. Major Assets Spot Trading Volume Performance
Notably, most of Hyperliquid's spot trading volume in early 2024 and 2025 is concentrated on trading HYPE tokens. The spot trading volume of major assets only began after the listing of UBTC in February 2025.
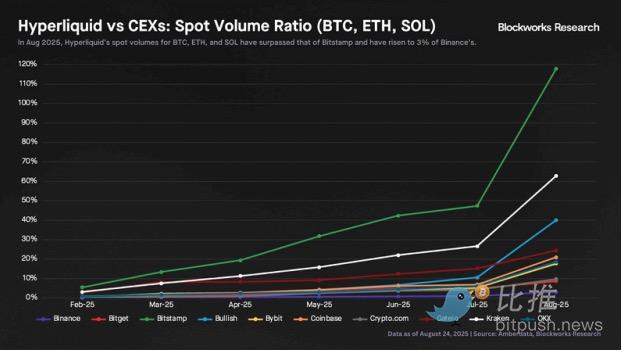
This month, Hyperliquid has surpassed Bitstamp in spot trading volume for the three major assets: BTC, ETH, and SOL.
The spot trading volume of these three major assets on Hyperliquid accounts for 63% of Kraken, 21% of Coinbase, 19% of OKX, 18% of Bybit, and 3% of Binance.
Since February, the ratio of Hyperliquid's spot trading volume for these three major assets to Binance's trading volume has increased 26 times.
3. Perpetual Contract Trading Volume: Growing Faster than CEXs
In terms of perpetual futures trading volume, Hyperliquid's growth rate is significantly faster than that of its centralized counterparts.
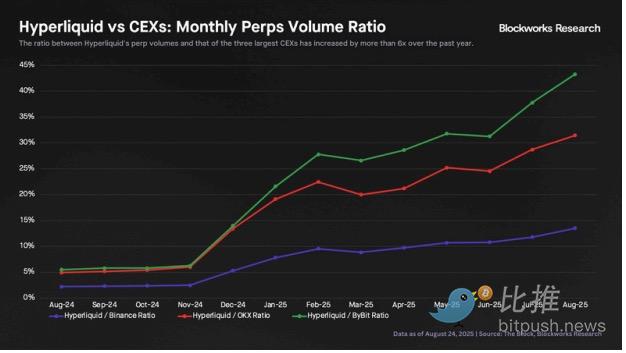
The ratio of Hyperliquid's perpetual contract trading volume to the trading volume of the three major CEXs has increased more than sixfold over the past year.
Hyperliquid's monthly perpetual contract trading volume now accounts for about 14% of Binance's futures trading volume, up from just 2.2% a year ago.
We believe Hyperliquid can continue to eat into the market share of CEXs, especially in the perpetual contract space. The HIP-3 proposal will significantly accelerate the exchange's launch speed, while Builder Codes allow Hyperliquid to effectively improve its distribution (e.g., Phantom integration).
Revenue and Valuation Analysis
The growth in trading volume is impressive, but how does it compare to revenue, especially against other public chains?
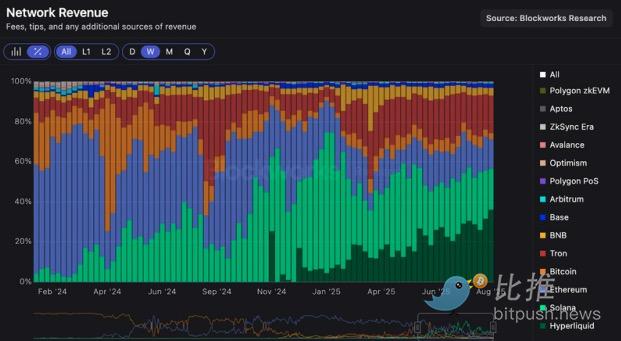
4. Revenue Run Rate Hits All-Time High
- Hyperliquid (HyperCore + HyperEVM) has recorded approximately $28 million in weekly revenue for two consecutive weeks, achieving $98 million in revenue over the past 30 days.
- These figures translate to an annualized revenue run rate of $1.2 billion to $1.4 billion. If annualized based on the past 90 days' revenue ($245 million), the run rate would be slightly lower ($980 million).
- Over the past two weeks, Hyperliquid has been the highest weekly revenue-generating public chain, with a market share reaching a historic high of 36%.
5. HYPE Token Valuation: Lowest P/S Ratio
- The table below shows that among leading public chains, HYPE is the cheapest asset based on Price/Sales (P/S), with a circulating P/S of 12, 90% lower than its peers.
- Even when calculated based on FDV/Sales, HYPE is still the cheapest L1.
- While there is debate over whether L1s should enjoy a premium and whether they should be valued based on revenue, the fact remains that based solely on the P/S metric, HYPE's current pricing is more attractive than all other L1s.
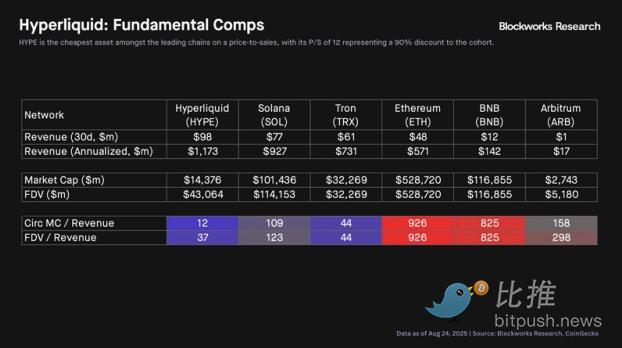
A question worth considering is: What would happen if the so-called "L1 premium" disappears? What if the buying pressure from DATCOs weakens? Is HYPE undervalued, or are the valuations of other L1s incredibly high and increasingly unsustainable?
6. Comparison with CEX Giant Coinbase
- While comparing Hyperliquid to other public chains using only revenue may not be comprehensive, Hyperliquid's attributes as an exchange allow for a comparison with Coinbase (COIN), which also has its core business as an exchange and operates its own public chain (Coinbase + Base, https://www.bitpush.news/articles/tag/base compared to HyperCore + HyperEVM).
- We define the income of HYPE holders as 97% of the total fees allocated to the Hyperliquid Assistance Fund (this will change to 99% in the future).
- Based on the annualized income of holders over the past 30 days as of August 25, HYPE's circulating P/E (Price/Earnings) is approximately 13, and FDV/Earnings is about 39. The circulating P/E of 13 is very similar to the previous section's P/S of 12, due to its high buyback to revenue ratio.
- Based on the annualized income over the past 90 days, HYPE's circulating P/E is approximately 16, and FDV/Earnings is about 48.
- In contrast, Coinbase's trailing P/E is about 30, and forward P/E is around 46. Considering that Hyperliquid's growth rate is significantly higher than that of Coinbase, HYPE's pricing remains attractive.
Final Thoughts
Limitations Statement
First, it is crucial to acknowledge the inherent limitations in our analysis. First, we have used only revenue as a single metric when comparing Hyperliquid to other public chains, while real-world comparisons may be more nuanced and complex. Second, the market is likely to primarily position Hyperliquid's valuation as an exchange, which means that comparisons with other exchanges may be a more appropriate reference.
Given that Coinbase (COIN) has its core business as an exchange and its chain (Coinbase + Base, corresponding to HyperCore + HyperEVM) has additional potential, it serves as a good comparison object.
We can define the income of HYPE holders as 97% of the total fees allocated to the Hyperliquid Assistance Fund (this ratio will soon change to 99%).
Based on the annualized income of holders over the past 30 days as of August 25, HYPE's circulating P/E is approximately 13, and fully diluted valuation/Earnings (FDV/Earnings) is about 39. Notably, the P/E of 13 here is very similar to the P/S of 12 in the previous section, due to its high buyback/revenue ratio.
Based on the annualized income over the past 90 days, HYPE's circulating P/E is approximately 16, and FDV/Earnings is about 48.
Comparing these figures with Coinbase's trailing P/E of about 30 and forward P/E of about 46, considering that Hyperliquid's growth rate is significantly higher than that of Coinbase, HYPE's pricing remains attractive.
Key Risks
Finally, the primary risk to our argument is the token unlocking event on November 28.
This event could bring significant selling pressure, as 23.8% of the total supply (71.44% of the circulating supply, valued at $10.9 billion) allocated to core contributors will begin to vest.
Assuming a two-year linear vesting schedule, this would mean approximately $450 million worth of HYPE entering circulation each month.
This supply backlog is an important consideration that needs to be closely monitored.
免责声明:本文章仅代表作者个人观点,不代表本平台的立场和观点。本文章仅供信息分享,不构成对任何人的任何投资建议。用户与作者之间的任何争议,与本平台无关。如网页中刊载的文章或图片涉及侵权,请提供相关的权利证明和身份证明发送邮件到support@aicoin.com,本平台相关工作人员将会进行核查。


