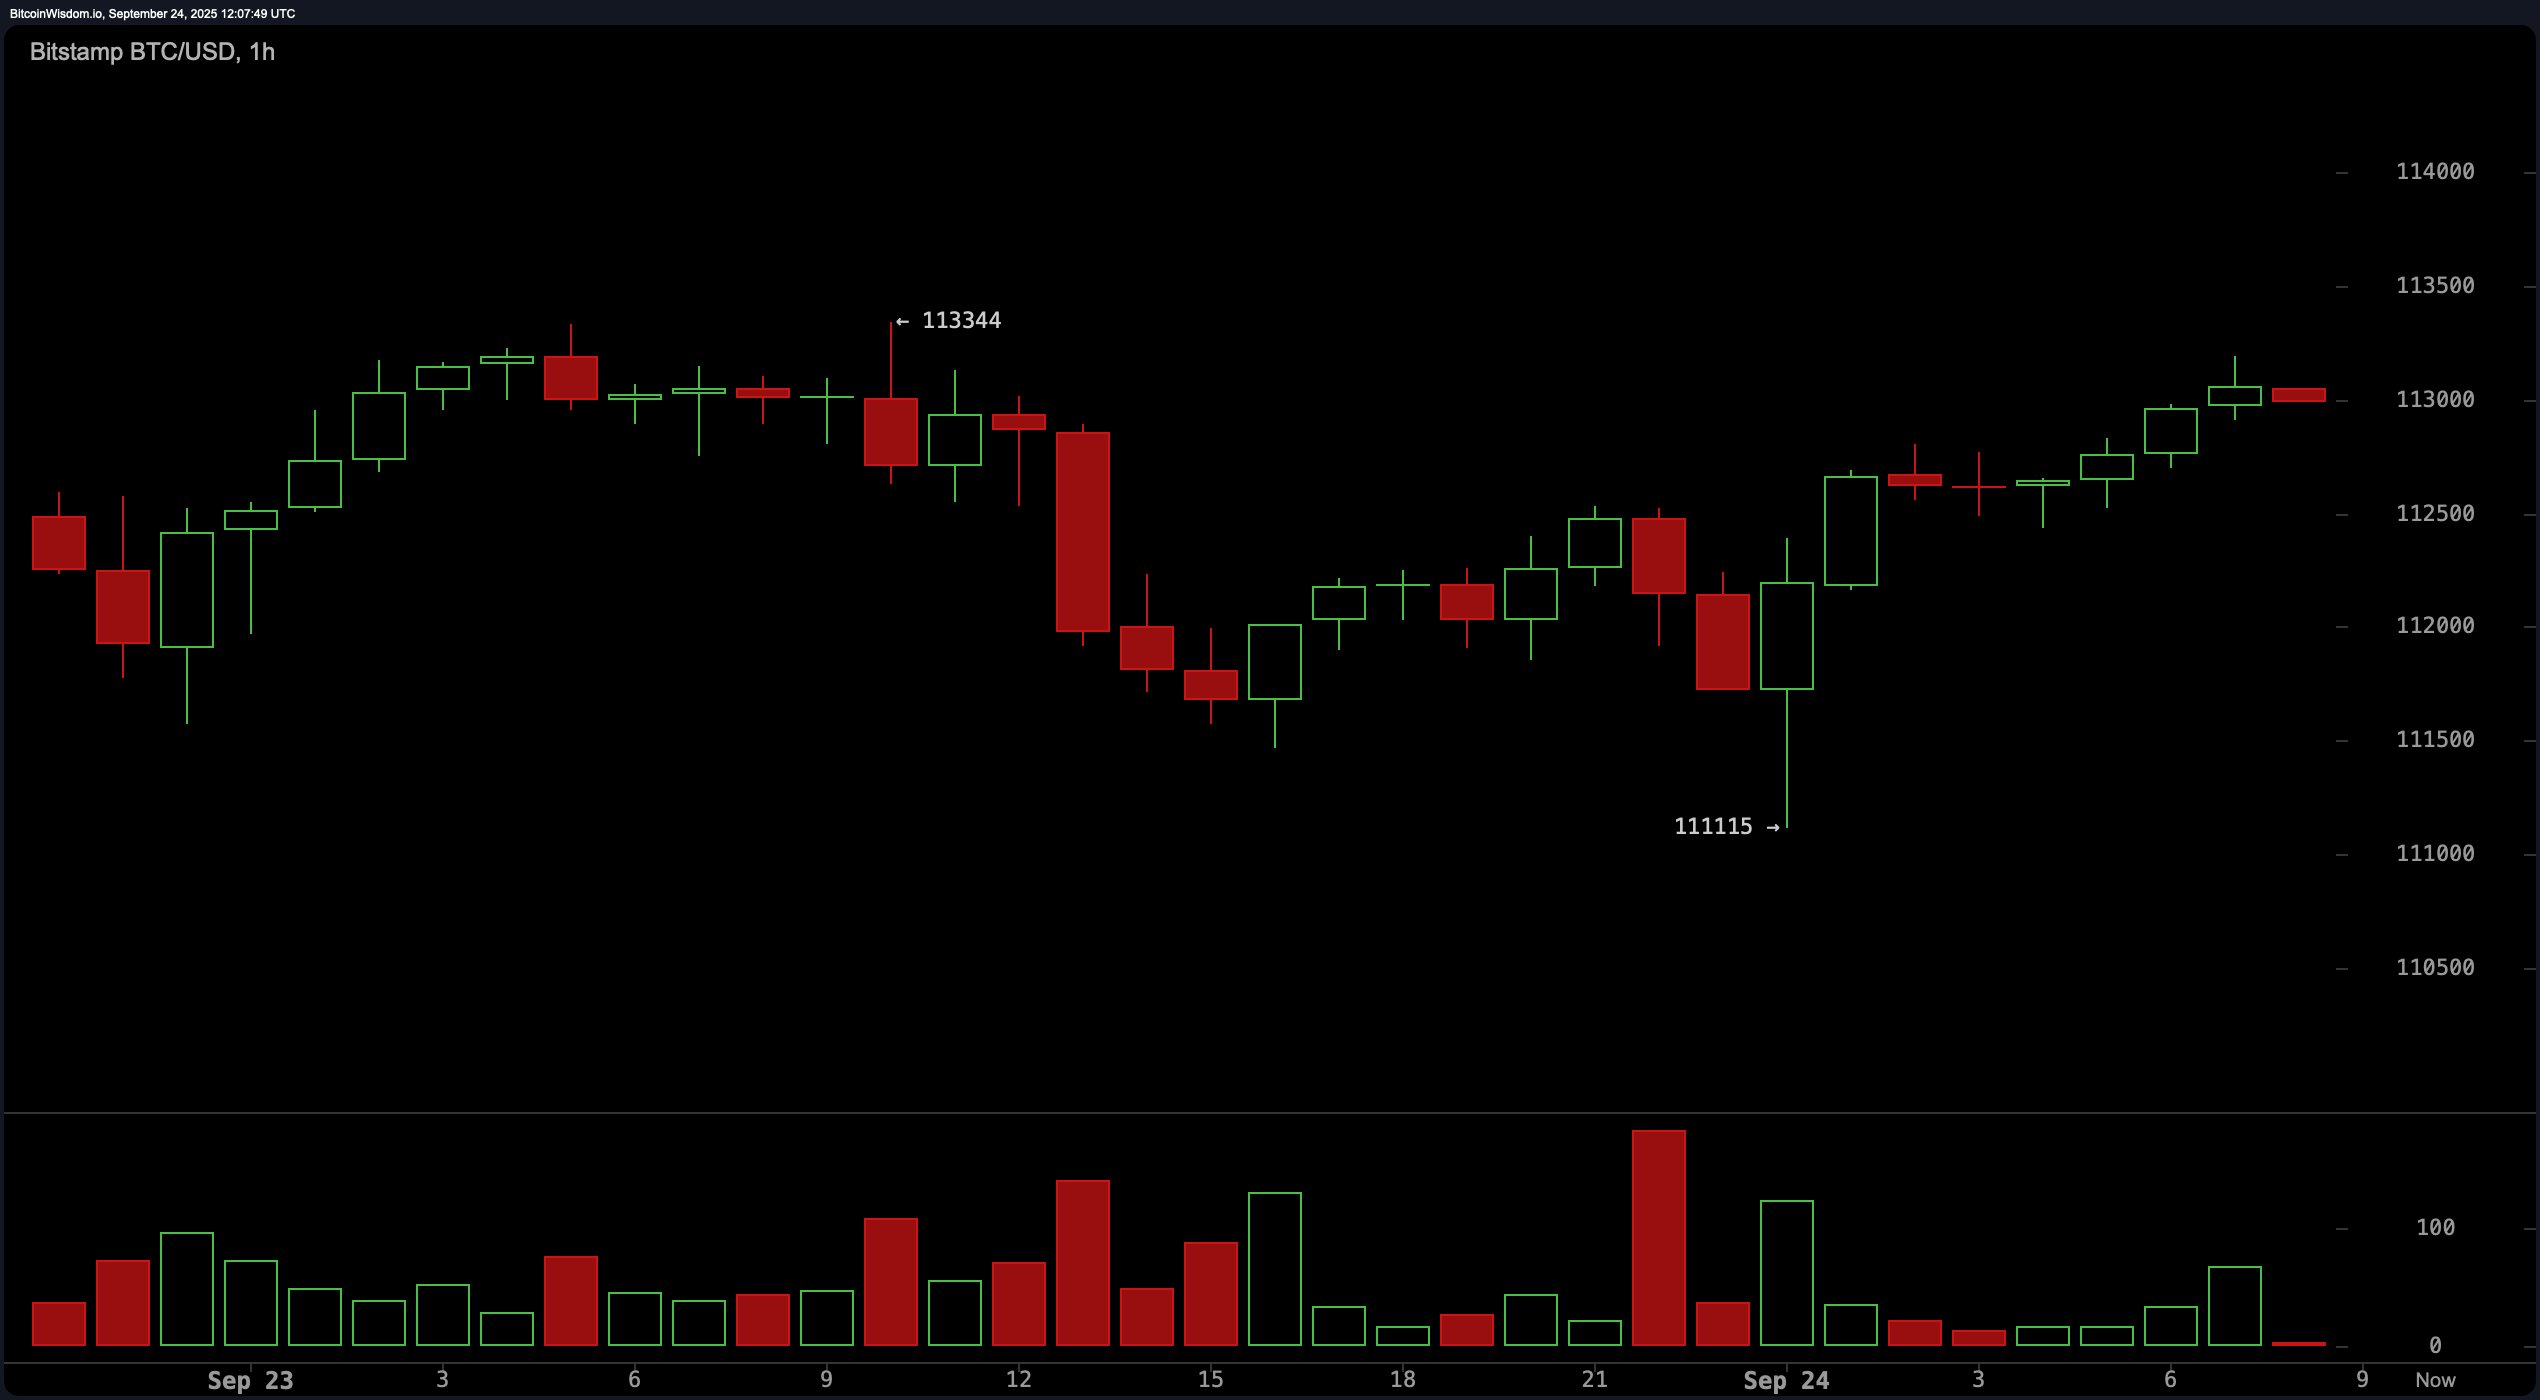
The hourly bitcoin chart paints a clear double bottom near $111,115, offering short-term traders a flicker of optimism. Volume spikes on green candles add some credibility to this rebound attempt, and higher lows reinforce the budding bullish bias. However, resistance at $113,500 remains a formidable gatekeeper.
A break above this level could push bitcoin to flirt with the $114,500–$115,000 zone, where previous support turned resistance. A tight stop-loss below $112,000 is not only recommended—it’s survival.

BTC/USD 1-hour chart via Bitstamp on Sept. 24.
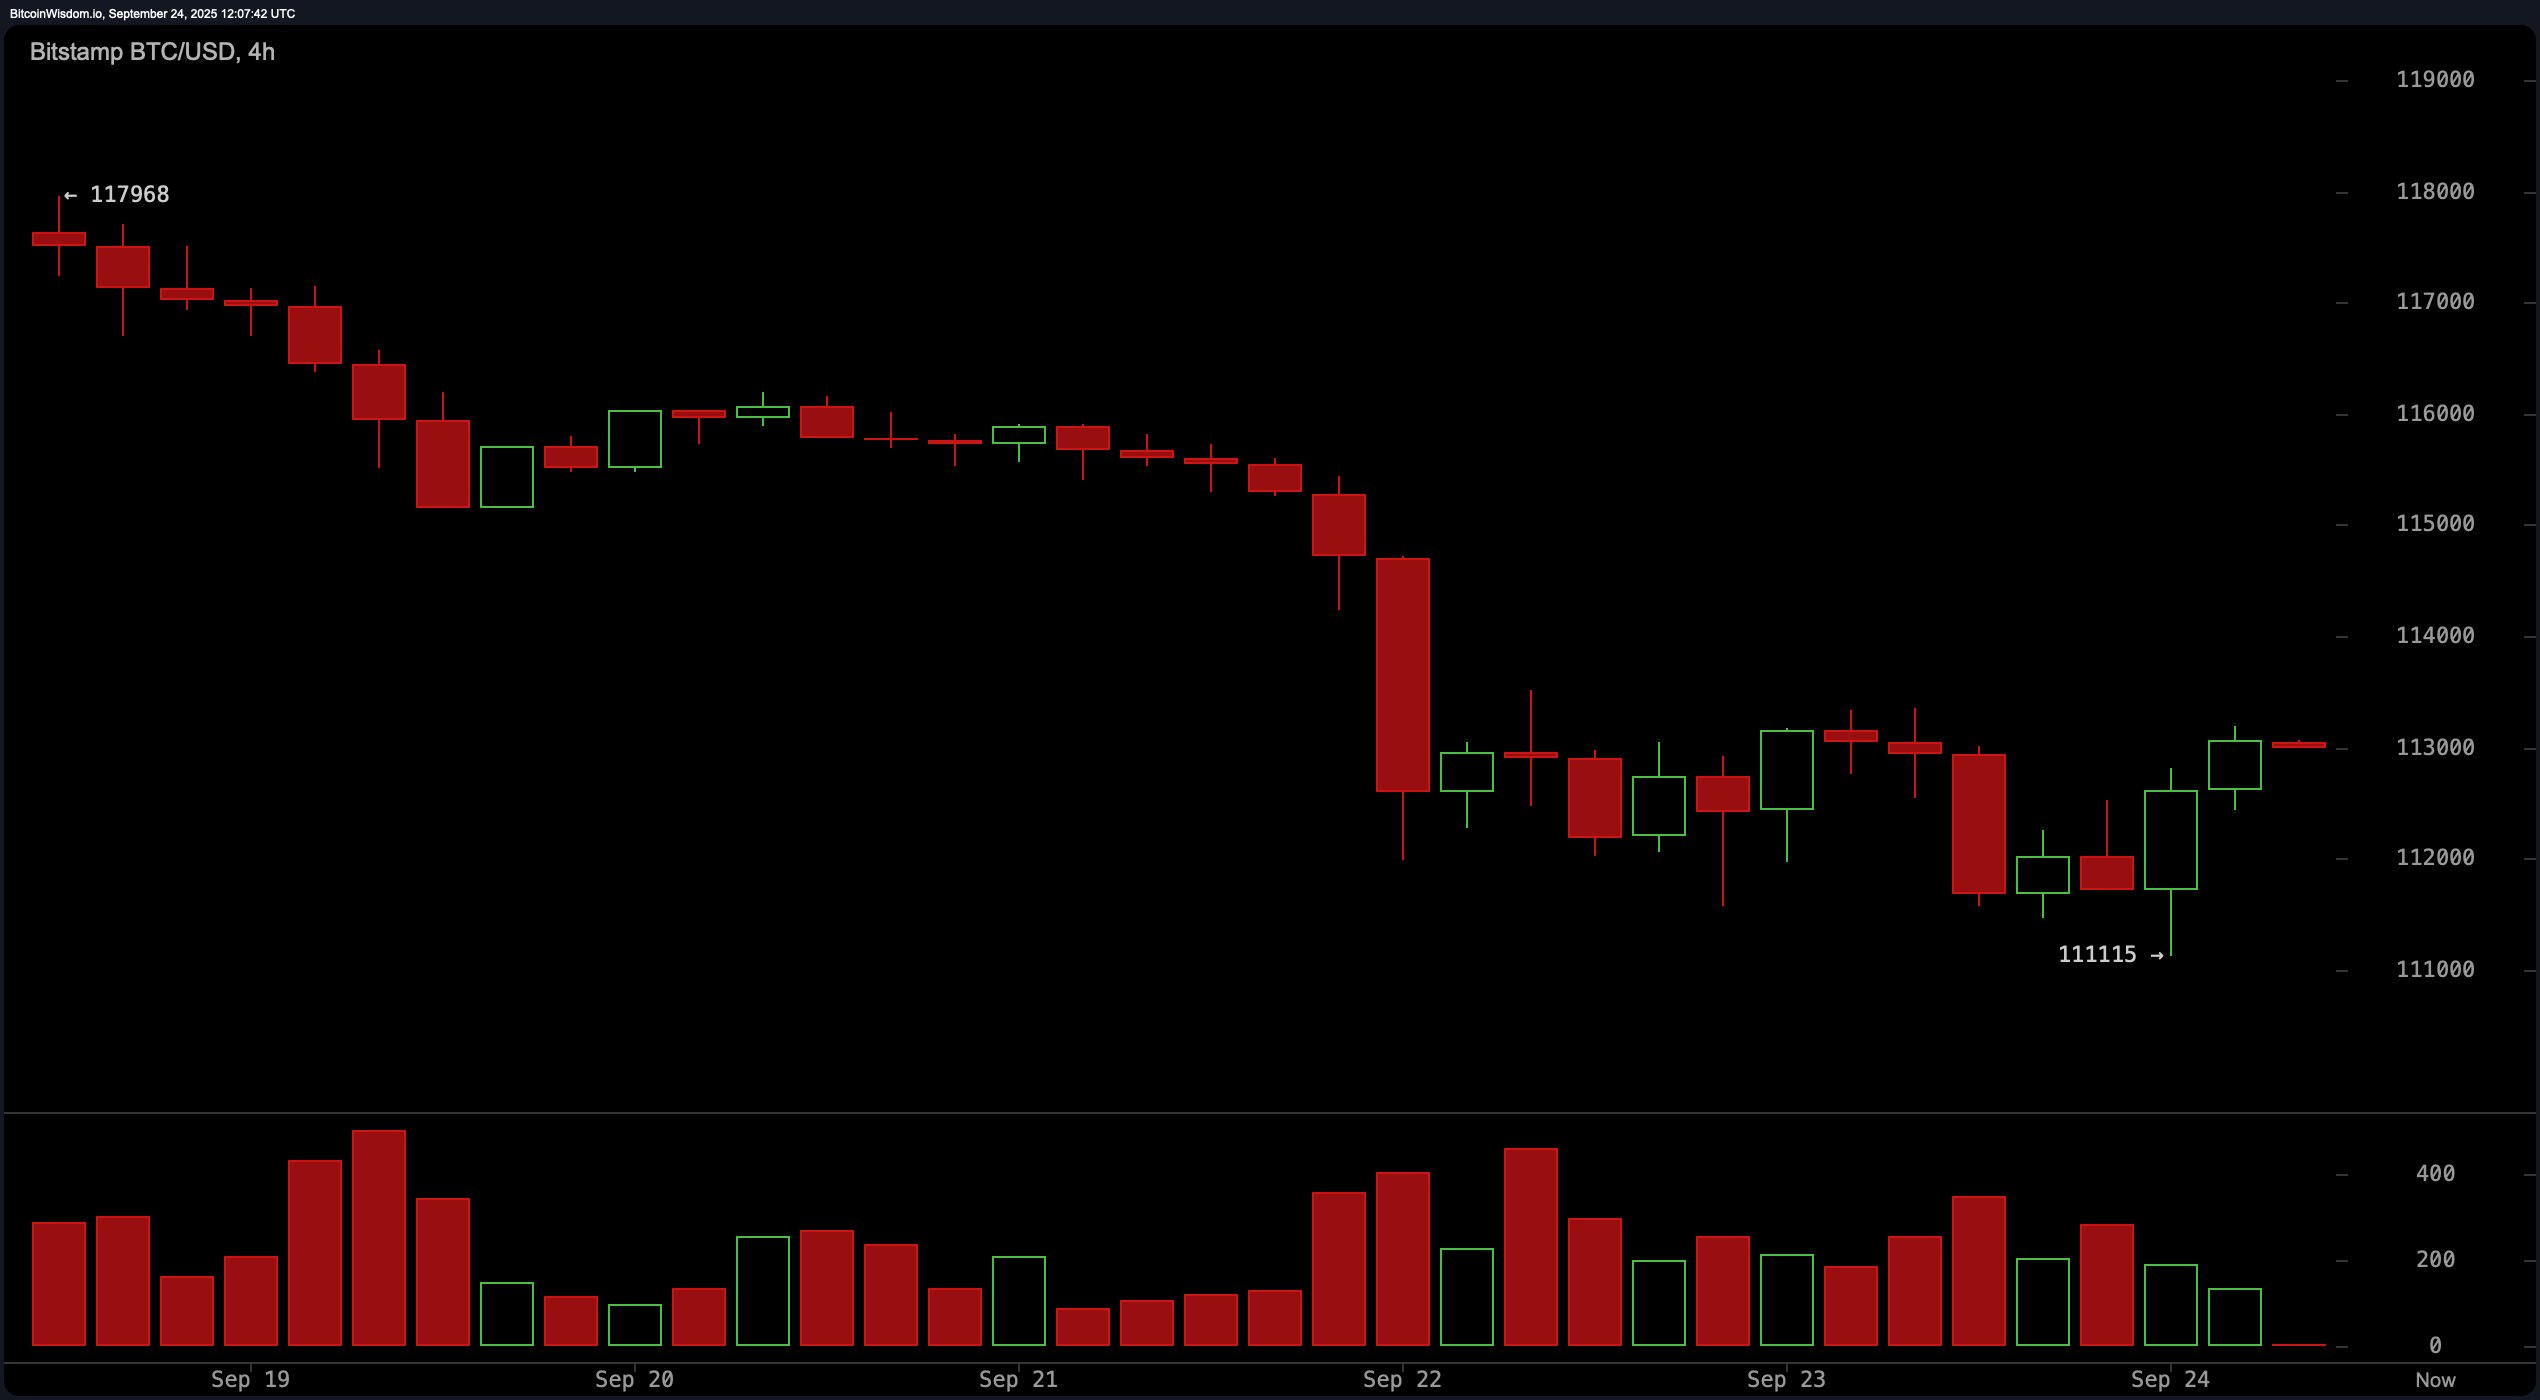
On the four-hour bitcoin chart, things are a little less rosy. The asset recently tumbled from a high of $117,968, then built a base near $111,115. While it’s now creeping higher, volume isn’t exactly screaming conviction. Traders eyeing a long setup need confirmation above $113,500—preferably with a red-hot volume spike. Until then, this recovery looks like it’s walking on eggshells.

BTC/USD 4-hour chart via Bitstamp on Sept. 24.
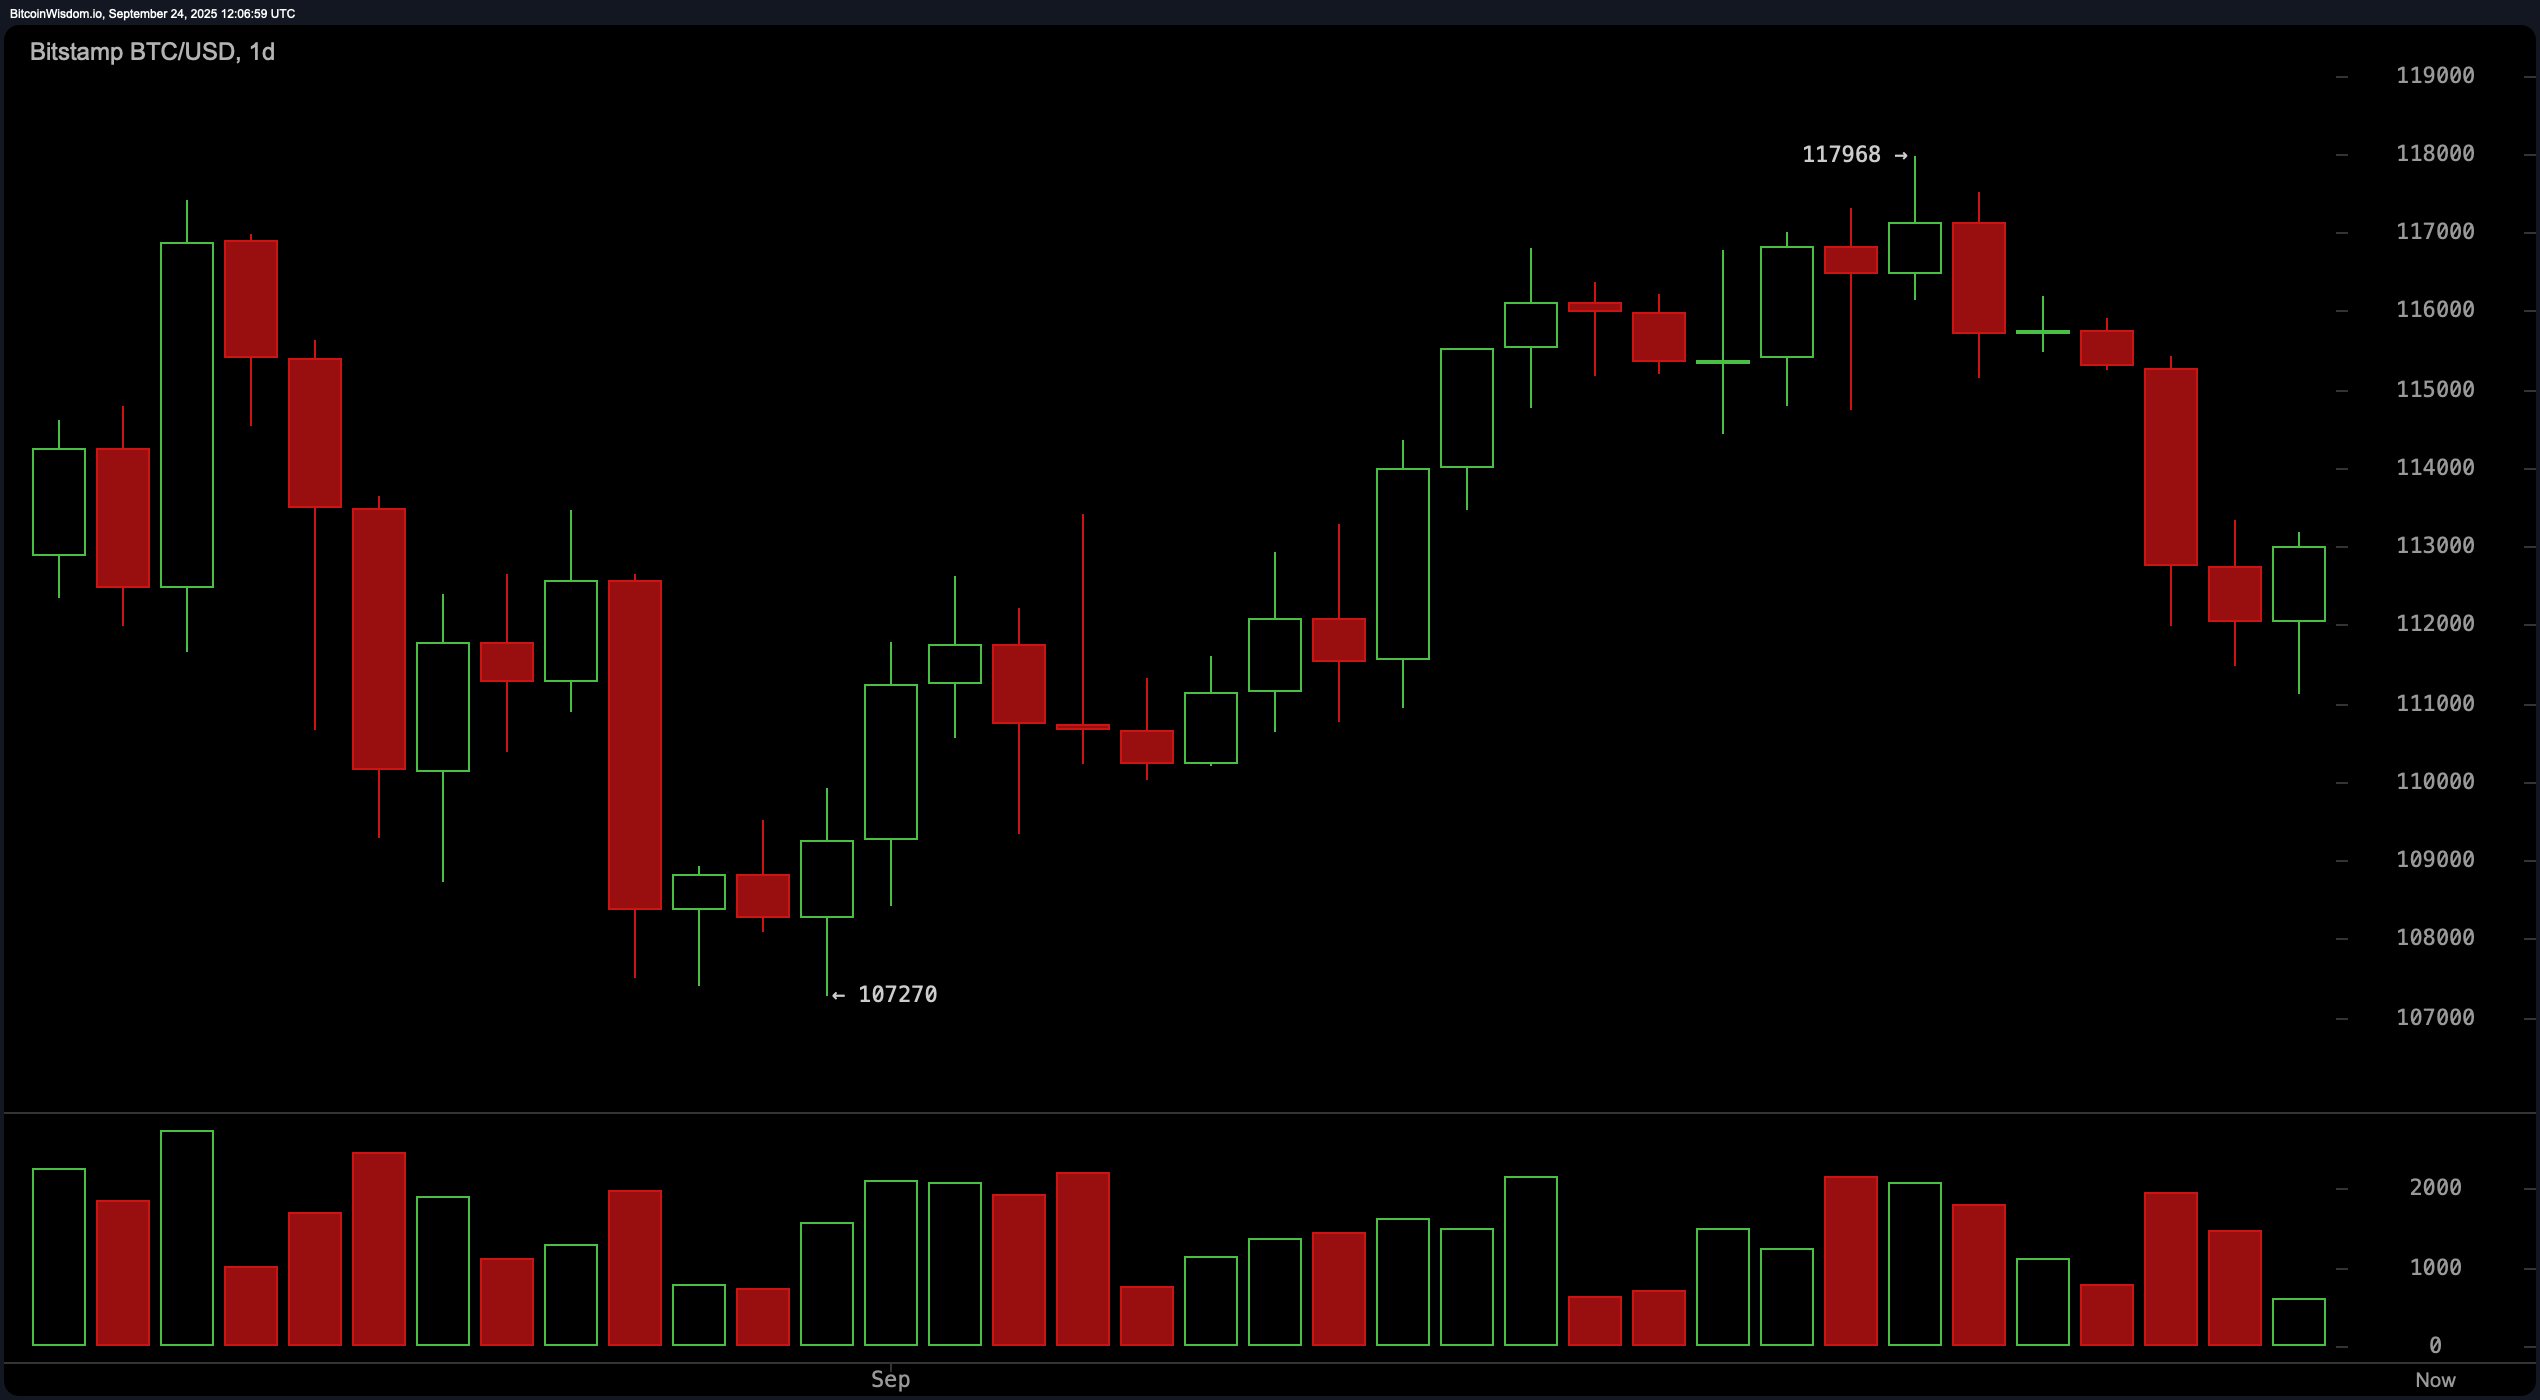
The daily bitcoin chart reveals even more indecision. After a brutal drop from recent highs, bitcoin’s current candles have tiny bodies—textbook signs of market ambivalence. But here’s the kicker: the formation of a rough double bottom paired with volume climax selling hints at a possible short-term reversal. Still, any real enthusiasm is conditional on a breakout above $113,500. A daily close below $111,000 would crush the narrative and send bulls scrambling.

BTC/USD daily chart via Bitstamp on Sept. 24.
Oscillators are about as excited as a Monday morning. The relative strength index (RSI) sits at 46—neutral. The Stochastic indicator and commodity channel index (CCI) echo the same mood, while the average directional index (ADX) at 18 suggests a weak trend. The Awesome oscillator shows a positive value of 1,013 but offers no real directional bias. Momentum is negative at −2,310, oddly issuing a bullish signal, while the moving average convergence divergence (MACD) level of 156 rings negative. Translation? Confusion reigns, and patience is currency.
Moving averages only add to the mixed messaging. All short- and mid-range indicators—like the exponential moving average (EMA) and simple moving average (SMA) across the 10, 20, and 50 periods—are flashing red. But zoom out, and the longer-term EMAs and SMAs (100 and 200) are skewing bullish. The exponential moving average (100) and simple moving average (200) both issue bullish signals. If you’re betting on the big picture, bulls may still be holding the reins—but don’t expect them to gallop without a clear catalyst.
In short, bitcoin is playing the waiting game. It’s a market of maybes: maybe a breakout, maybe a breakdown. For now, the wise stay sharp, nimble, and data-driven.
Bull Verdict:
If bitcoin claws its way above $113,500 with volume backing it like a hype man at a crypto conference, bulls could push this baby toward $115,000 and beyond. The higher lows are whispering an uptrend, but only a breakout will make it scream. Until then, sit tight and don’t pop the champagne just yet.
Bear Verdict:
Should bitcoin slip below $111,000, this recovery will look less like a rally and more like a classic dead cat bounce wearing a bull costume. With soft volume and cranky oscillators, the bears are lurking—and they’re not here to play. Proceed with caution or risk getting mauled by market gravity.
免责声明:本文章仅代表作者个人观点,不代表本平台的立场和观点。本文章仅供信息分享,不构成对任何人的任何投资建议。用户与作者之间的任何争议,与本平台无关。如网页中刊载的文章或图片涉及侵权,请提供相关的权利证明和身份证明发送邮件到support@aicoin.com,本平台相关工作人员将会进行核查。


