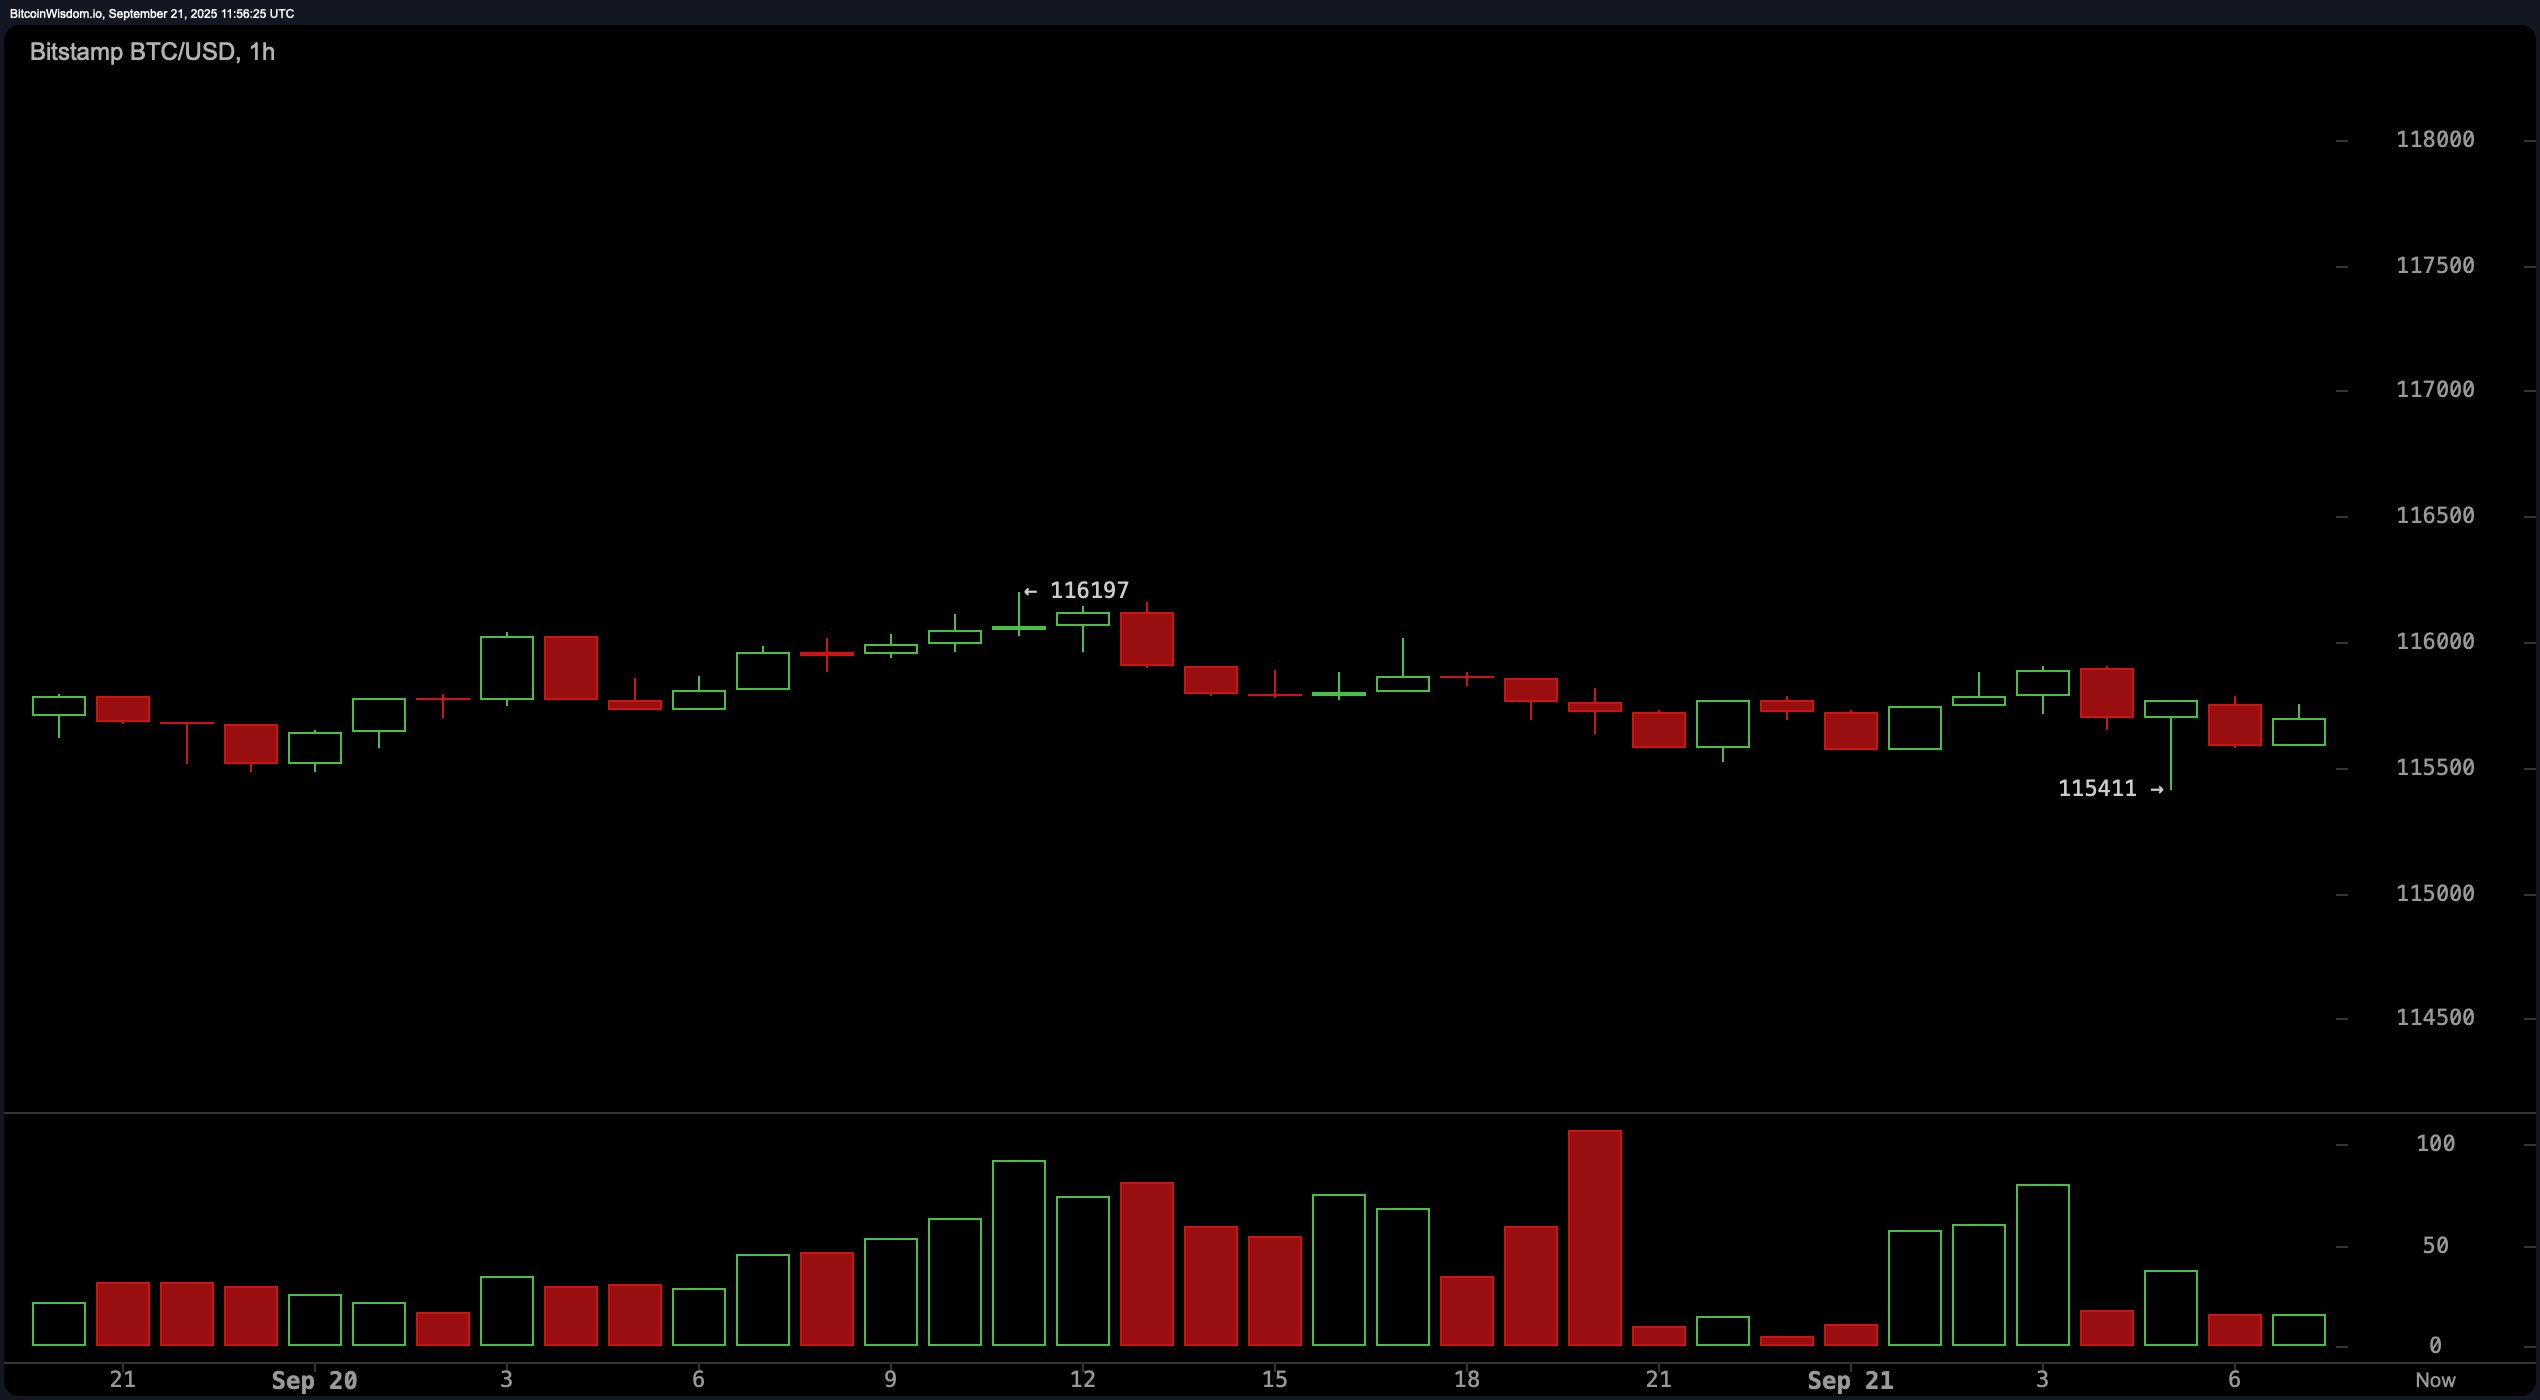
From an intraday perspective, the 1-hour bitcoin chart reveals a sideways trend with a slight bearish drift, characterized by small-bodied candlesticks and declining volume following a prior spike. Price action between the $115,400 support and $116,200 resistance suggests a zone of indecision, with no clear directional bias.
The absence of strong conviction was further underlined by the lack of follow-through above key resistance levels. Unless bitcoin decisively breaks above $116,200 with sustained volume, traders are advised to avoid entries or wait for a breakdown below $115,400 for short setups.

BTC/USD 1-hour chart via Bitstamp on Sept. 21, 2025.
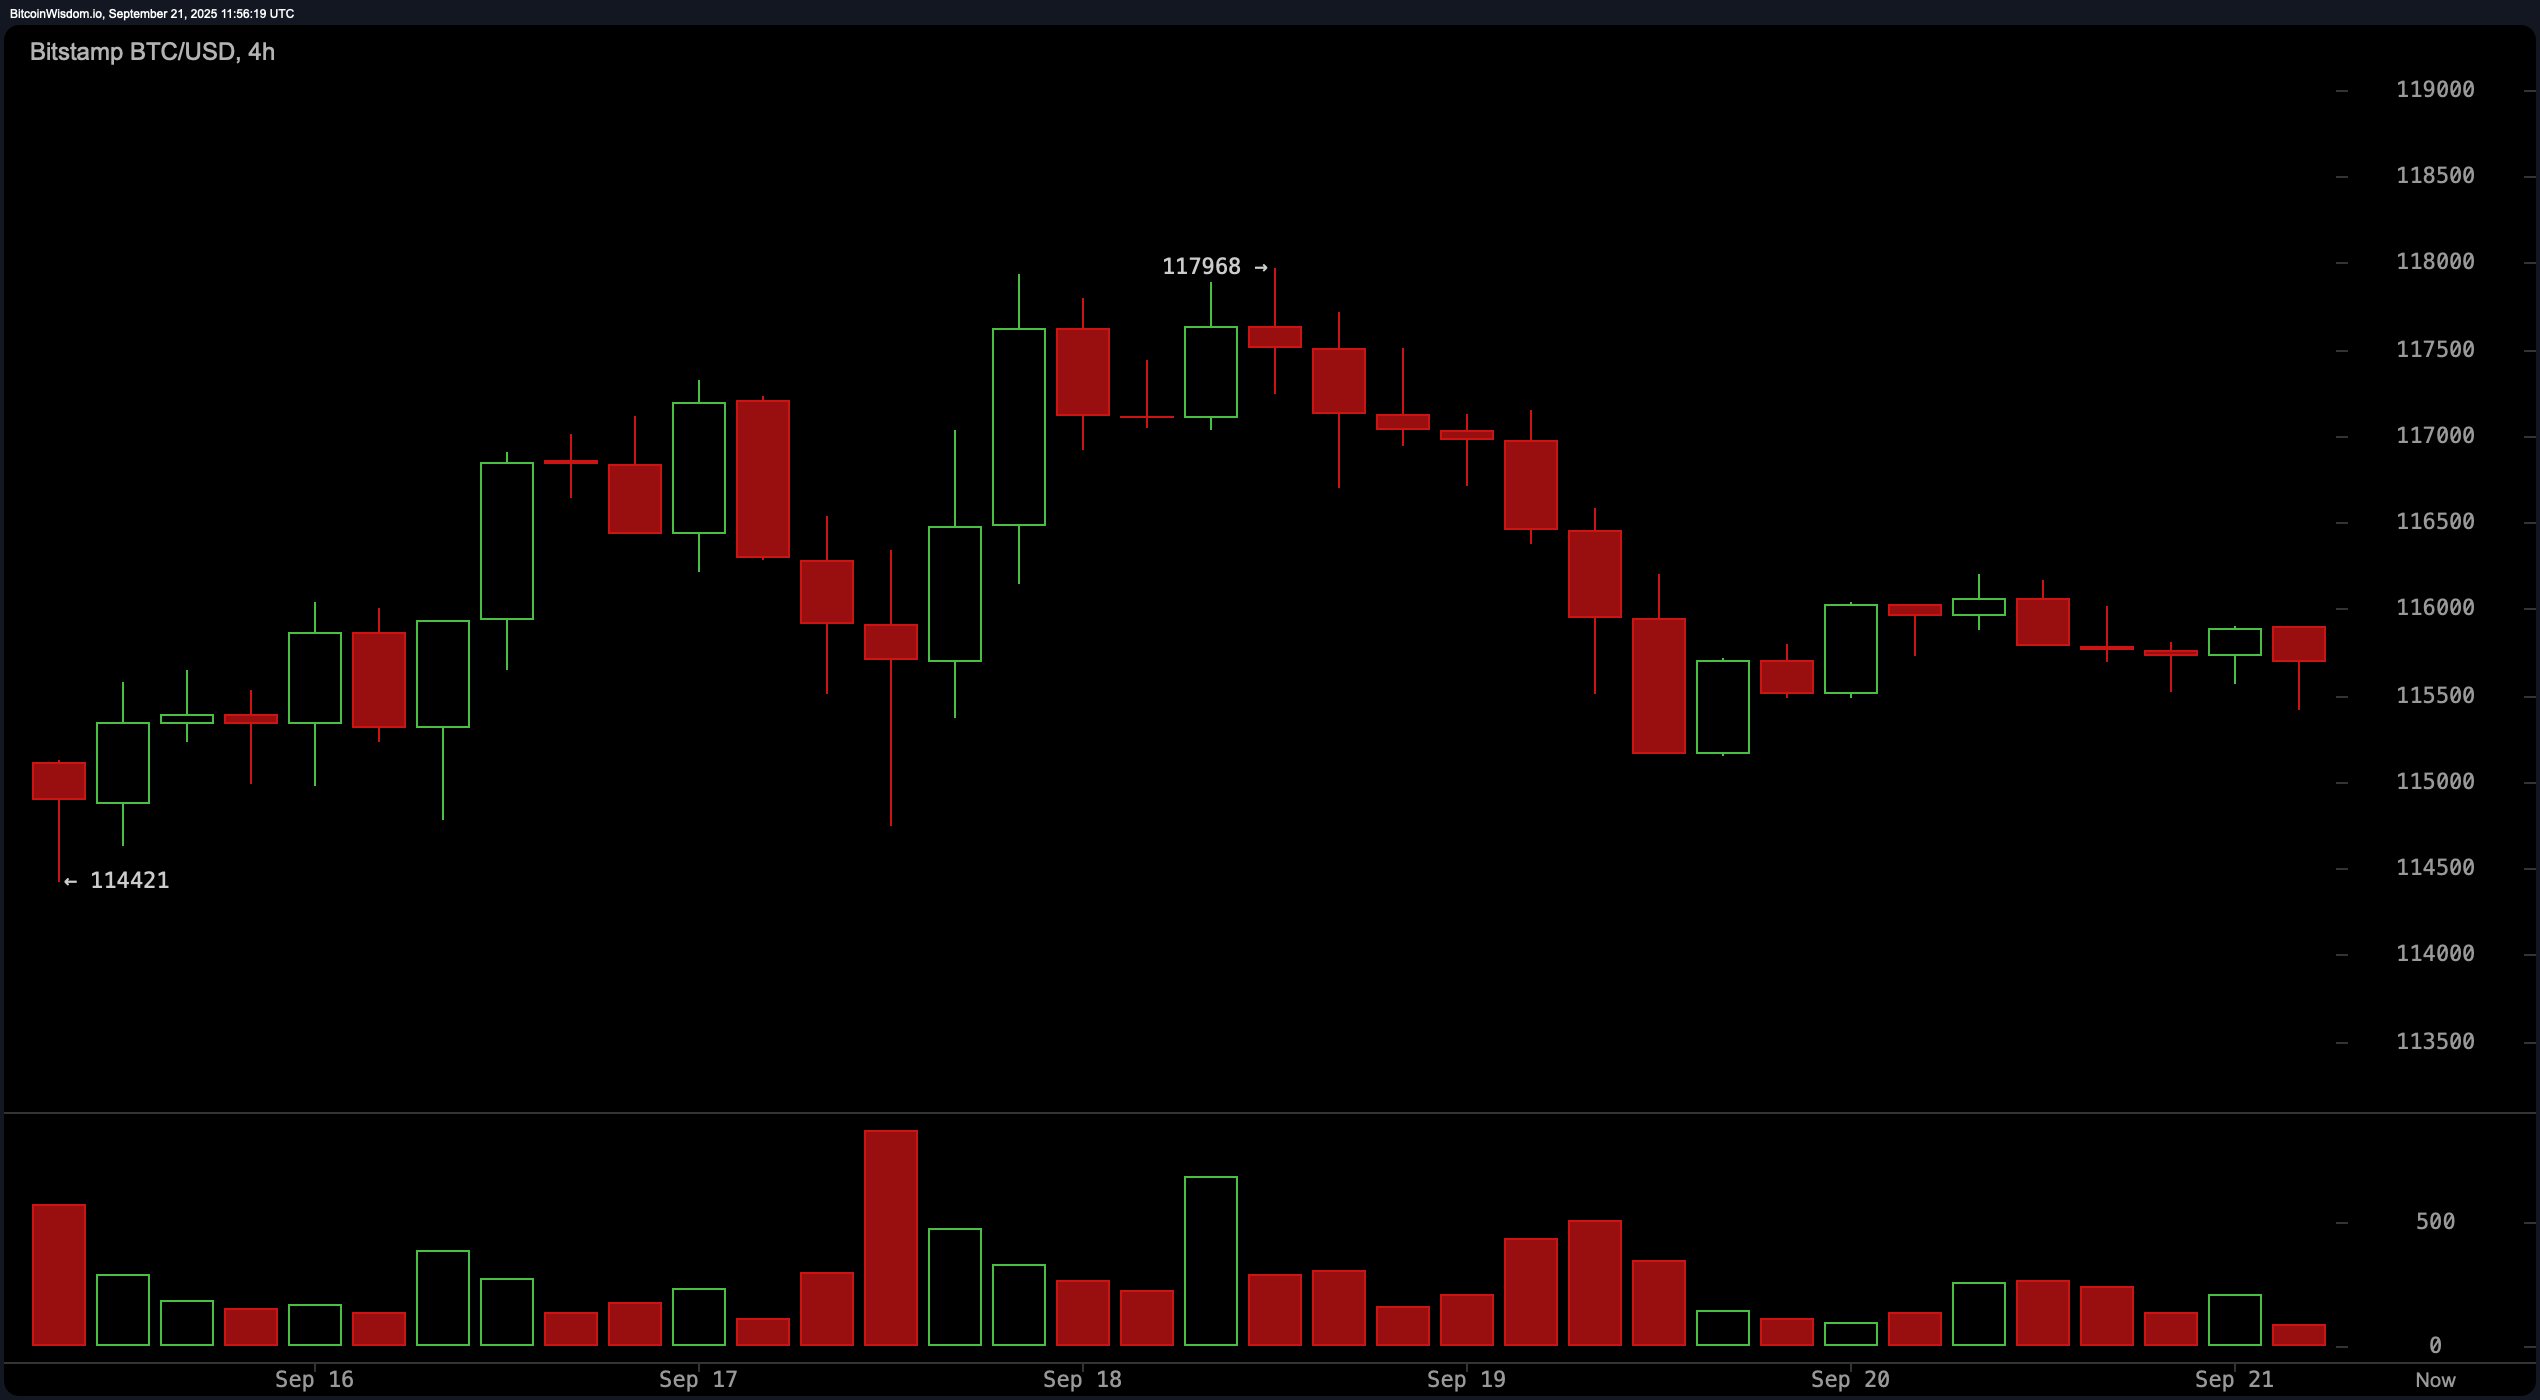
The 4-hour chart echoes this caution, as bitcoin continues to retrace from its recent local high of $117,968. Price structure has printed a series of lower highs, and candles now show clear rejections near the midrange of $116,000. A failure to reclaim this level may trigger further downside, especially if the price falls through $115,400 on a confirmed candle close. Volume continues to fade on bounce attempts, reflecting a diminishing appetite from buyers. The next key support lies near $114,400, while a bullish breakout above $117,000 with momentum could negate near-term downside risk.

BTC/USD 4-hour chart via Bitstamp on Sept. 21, 2025.
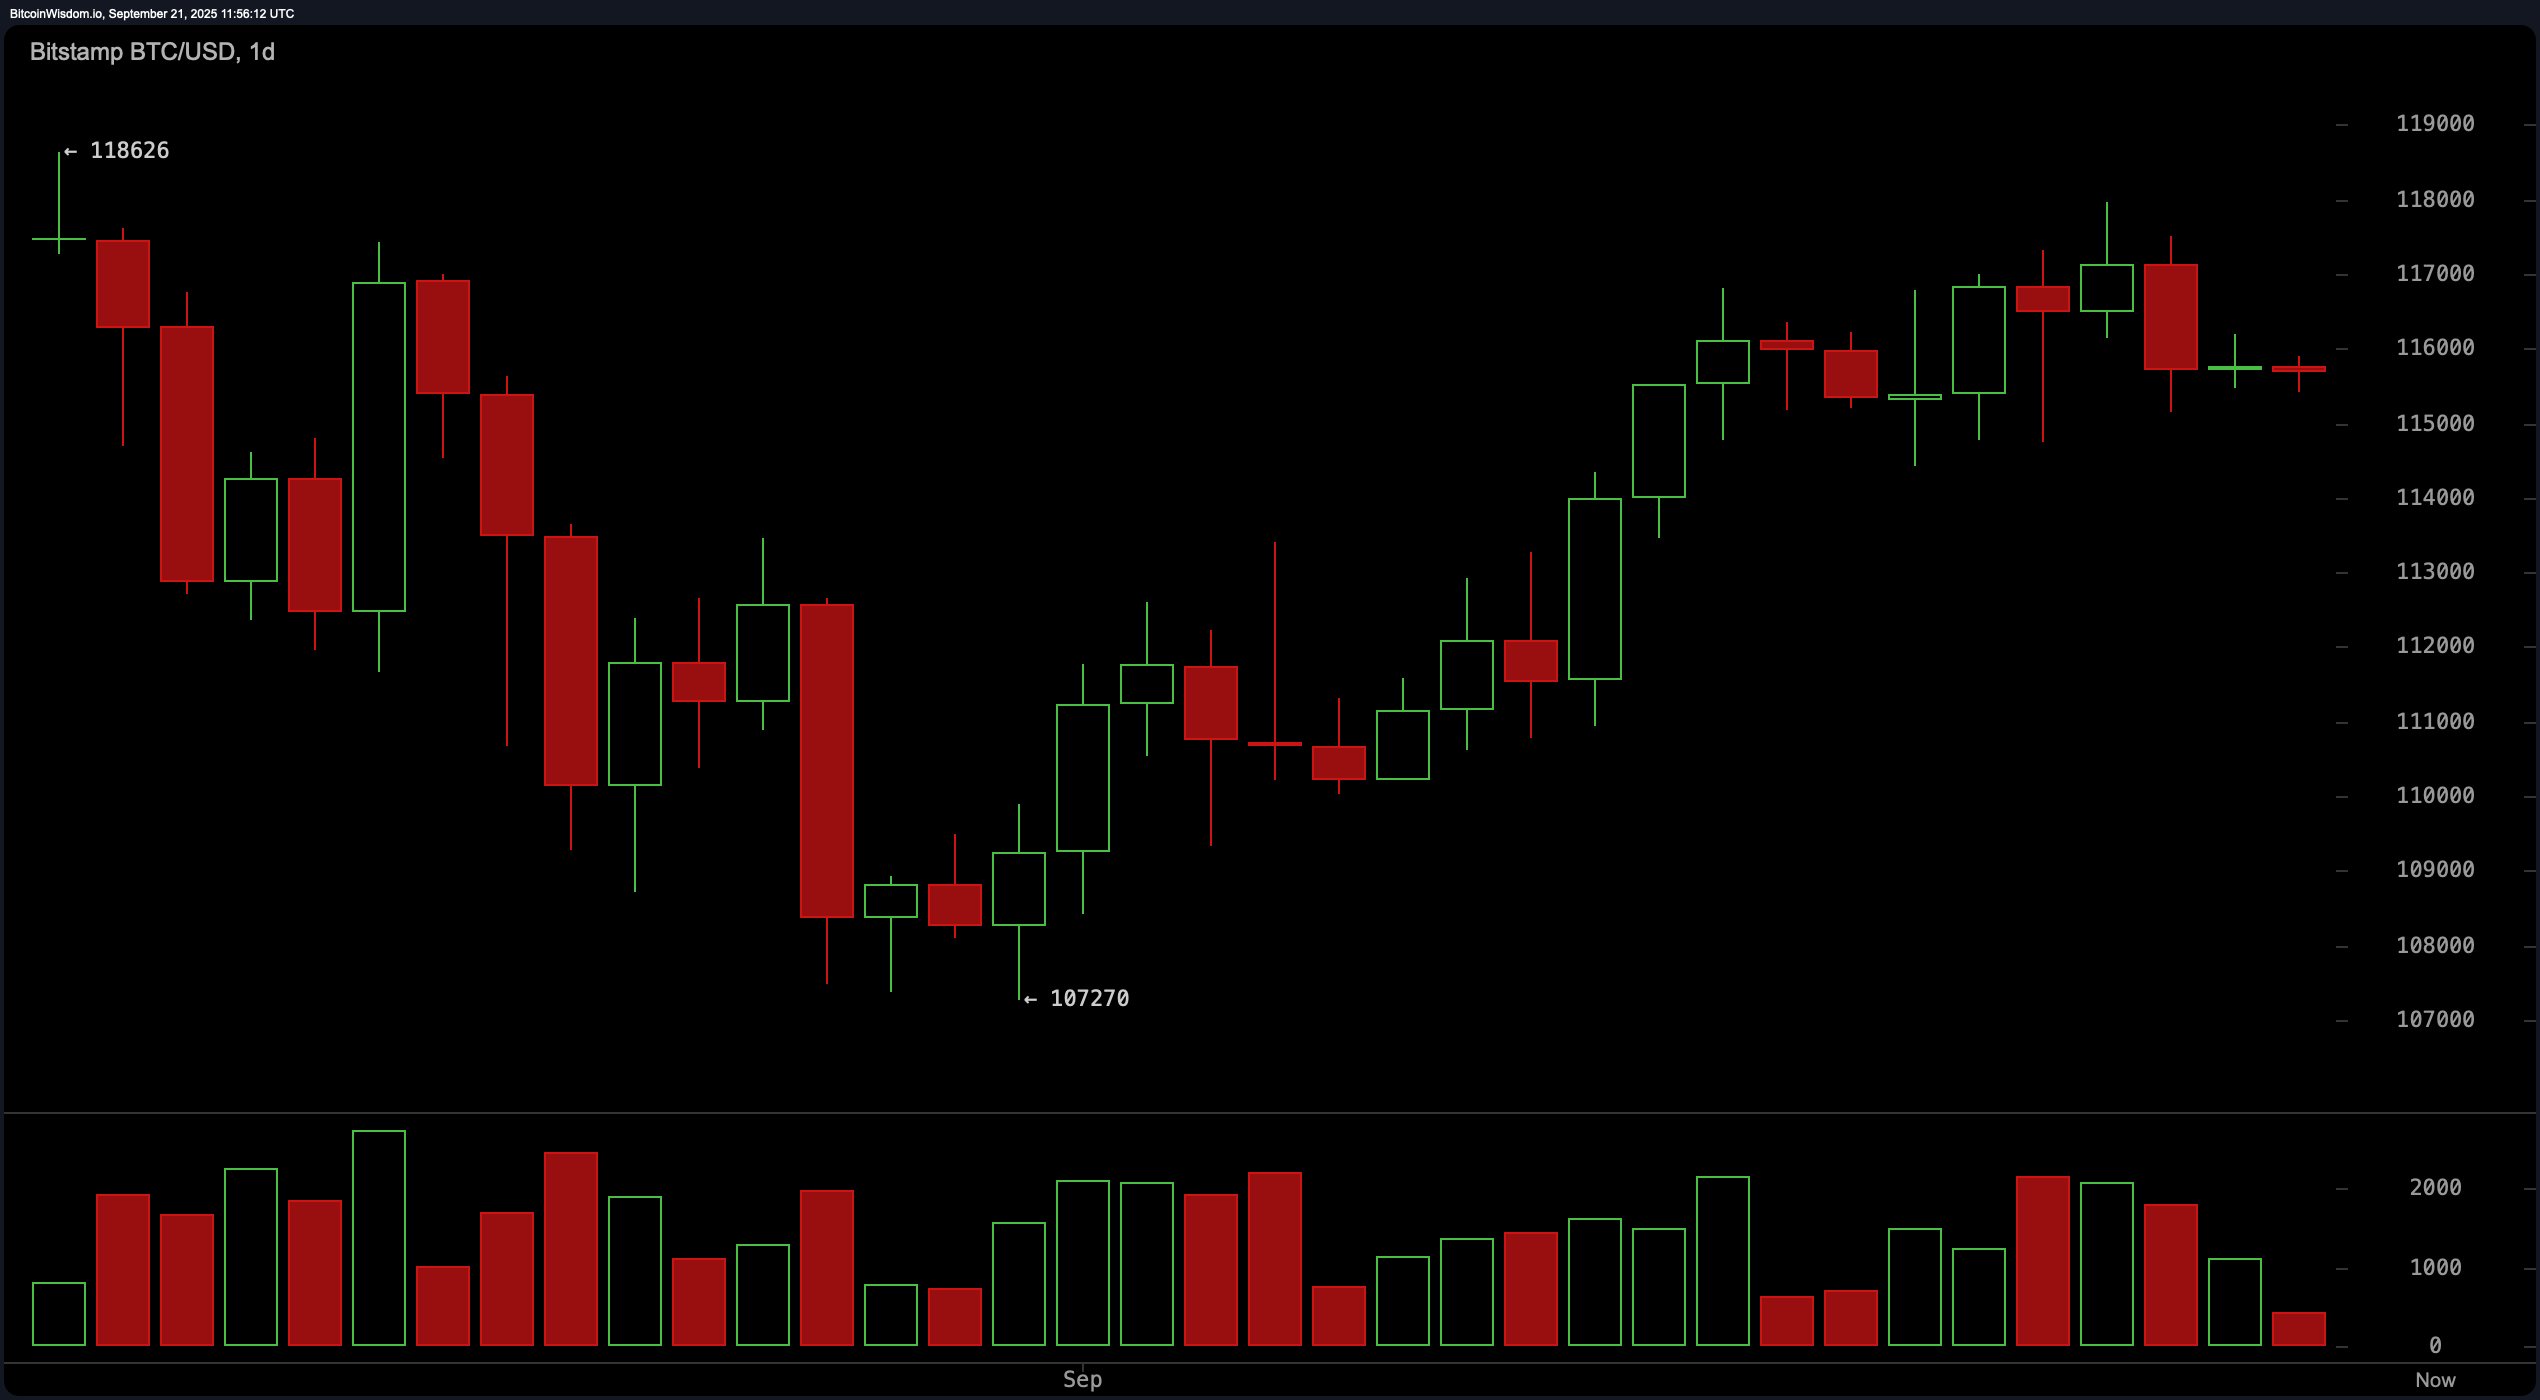
On the daily chart, bitcoin is exhibiting signs of a potential reversal after forming a macro low at $107,270 and climbing to a recent peak of $118,626. While a sequence of higher lows points to constructive long-term structure, the formation of a possible double top around the $117,000 to $118,000 region raises concern. Volume has also decreased on recent green candles, suggesting a weakening bullish trend. A daily close above $118,000 would validate a breakout, but failure to hold above $115,000 could signal a short-term top and usher in a deeper retracement.

BTC/USD daily chart via Bitstamp on Sept. 21, 2025.
Technical indicators paint a mixed picture. Oscillators such as the relative strength index (RSI) at 55, stochastic at 71, commodity channel index (CCI) at 54, average directional index (ADX) at 18, and the awesome oscillator at 3,157 all signal a neutral stance. The momentum indicator, however, shows a bearish bias with a negative signal, while the moving average convergence divergence (MACD) level at 851 registers an opposite and bullish signal. This divergence reflects broader market indecision and a lack of strong momentum either way.
The moving averages indicate a tilt toward bullish bias, particularly over longer periods. The exponential moving averages (EMAs) for 10, 20, 30, 50, 100, and 200 periods all align with positive signals, with only the 10-period simple moving average (SMA) showing a bearish indication at $116,040. This suggests underlying support remains intact on a macro basis, even if short-term price action remains range-bound. Bitcoin appears poised between a confirmed breakout and a deeper correction, with the $115,000 to $117,000 range acting as a key battleground for directional momentum in the coming sessions.
Bull Verdict:
If bitcoin breaks and closes above the $118,000 level on strong volume, bullish momentum could resume with potential upside targets at $120,000 and $122,500. Long-term moving averages and the MACD buy signal support a broader continuation of the uptrend, provided key resistances are cleared convincingly.
Bear Verdict:
A sustained move below $115,000—particularly if volume increases—would confirm a failed breakout and open the path toward deeper support zones at $114,400 and potentially $112,000. Momentum weakening across timeframes, along with fading volume on rallies, signals caution and favors a bearish bias until bulls reclaim higher ground.
免责声明:本文章仅代表作者个人观点,不代表本平台的立场和观点。本文章仅供信息分享,不构成对任何人的任何投资建议。用户与作者之间的任何争议,与本平台无关。如网页中刊载的文章或图片涉及侵权,请提供相关的权利证明和身份证明发送邮件到support@aicoin.com,本平台相关工作人员将会进行核查。


