On the 1-hour chart, XRP exhibited a weak downtrend moving into consolidation. Price action dropped from $3.08 to a low of $2.976 before entering a sideways pattern marked by small-bodied candles, suggesting market indecision.
Immediate support held at $2.975, while resistance was visible in the $3.00–$3.02 zone. Scalpers found potential entries at the $2.975 support level, aiming for exits near the resistance band. A breakout above $3.03 or a breakdown below $2.96, if accompanied by high volume, could signal a new directional trend.
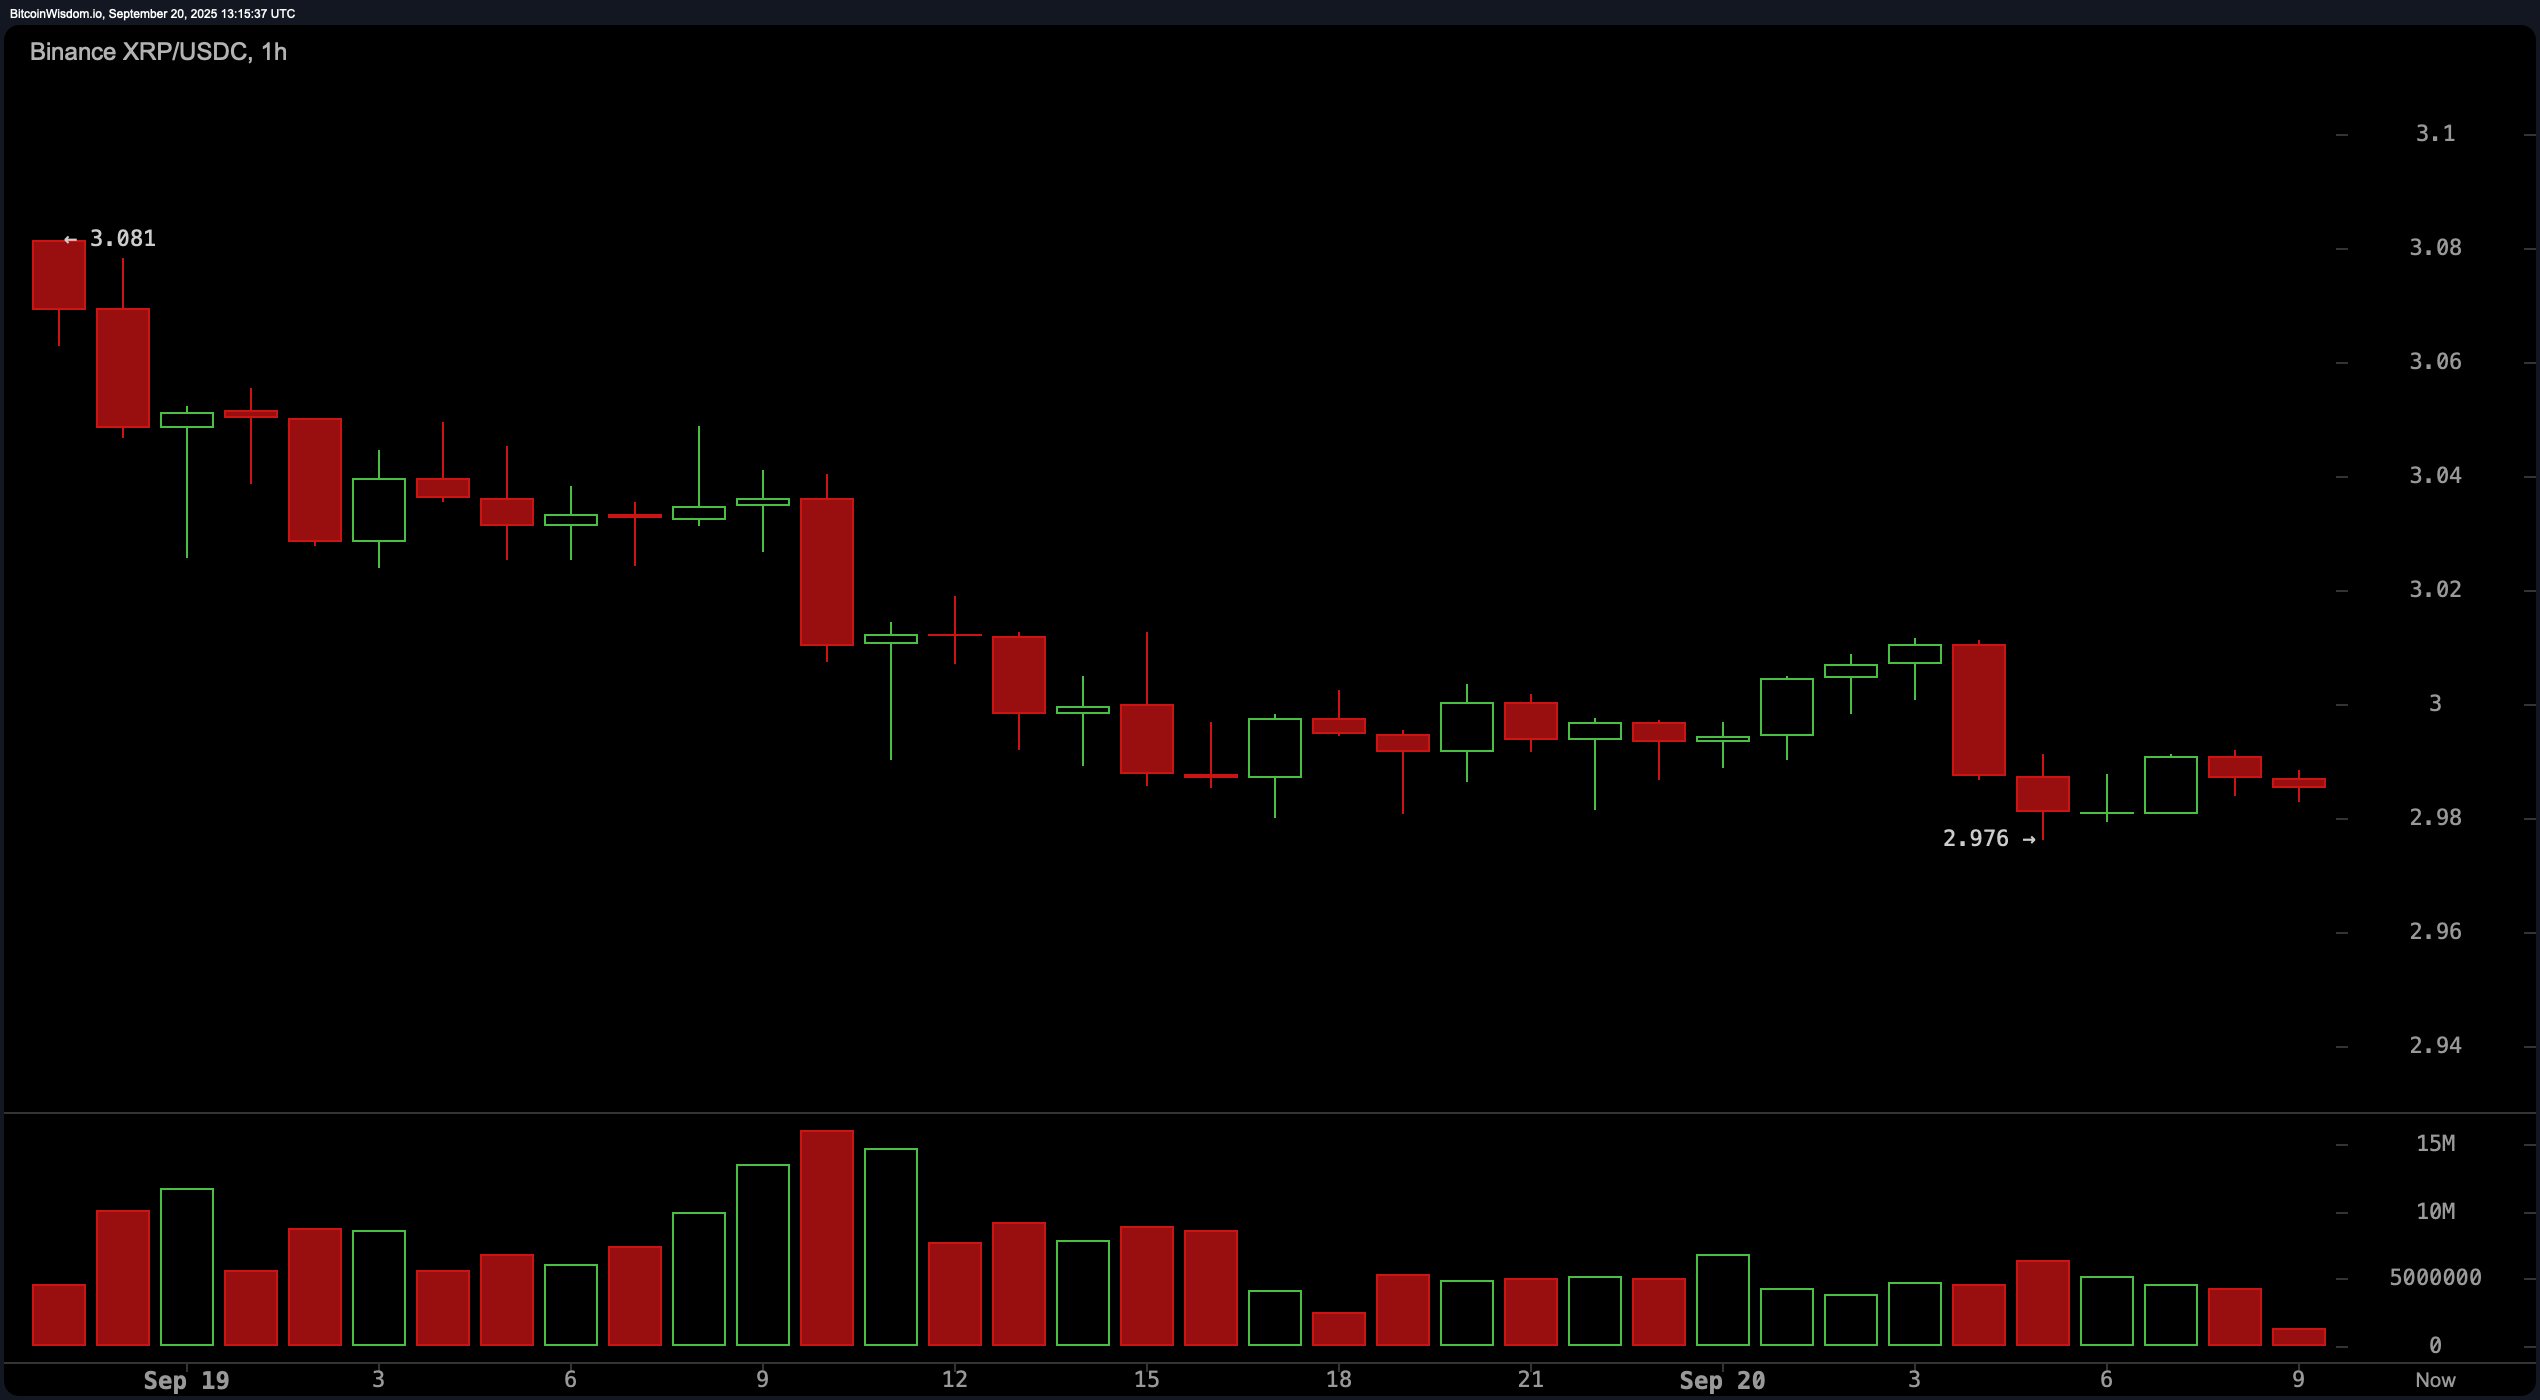
XRP/USDC via Binance 1-hour chart on Sept. 20, 2025.
The 4-hour chart indicated a short-term downtrend structure, though price momentum appeared to be fading. Following the peak at $3.141, XRP posted a series of lower highs and lower lows. However, the declining range in candlestick bodies and multiple buyer defenses near the $2.98–$3.00 range suggested weakening bearish pressure. Short-term bulls may have considered entries around $2.95 or on a confirmed break above $3.02, targeting resistance between $3.10 and $3.14. Conversely, bears might monitor the $3.02–$3.05 zone for rejection signals and bearish candle formations.
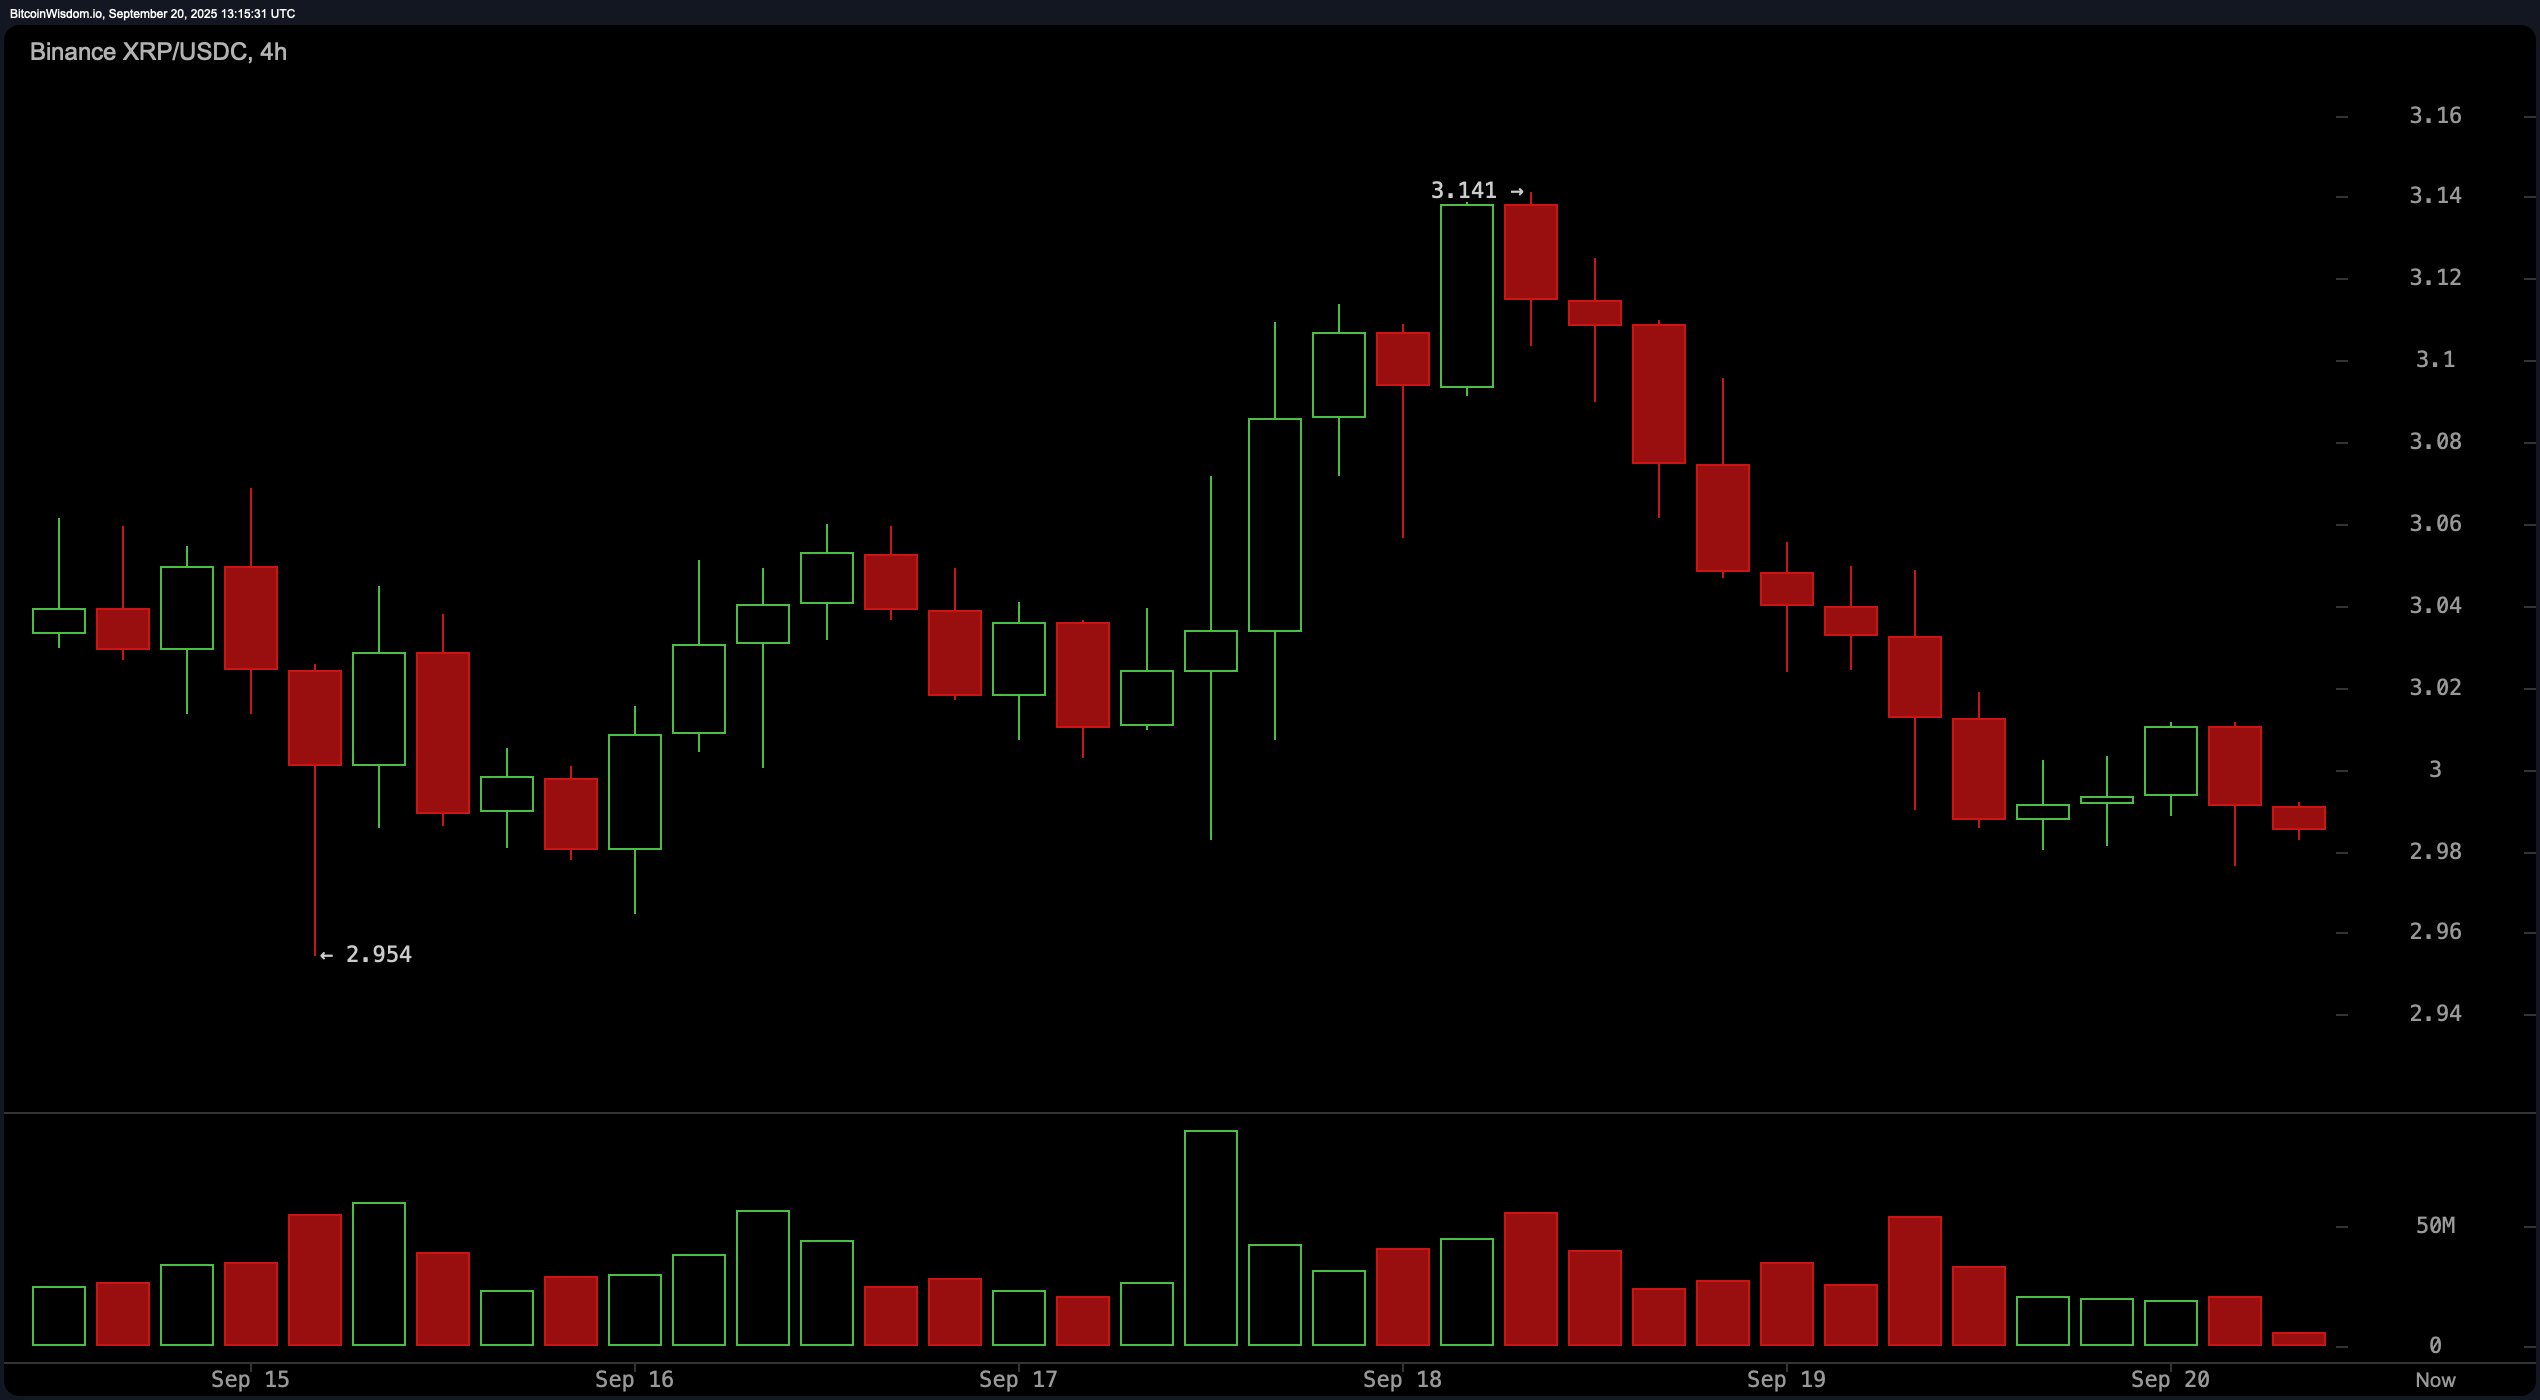
XRP/USDC via Binance 4-hour chart on Sept. 20, 2025.
On the daily chart, XRP displayed signs of transitioning from a mild uptrend into sideways movement. The asset rebounded from a recent swing low at $2.696 and briefly reached a high of $3.189 before encountering selling pressure. The emergence of lower highs and decreasing volume during the pullback signaled potential consolidation rather than strong bearish intent. Key support rested in the $2.70–$2.85 range, while resistance was clearly defined at $3.18. Long entries near $2.85, confirmed by bullish reversal patterns or a volume uptick, targeted exits just under the $3.18 resistance mark.
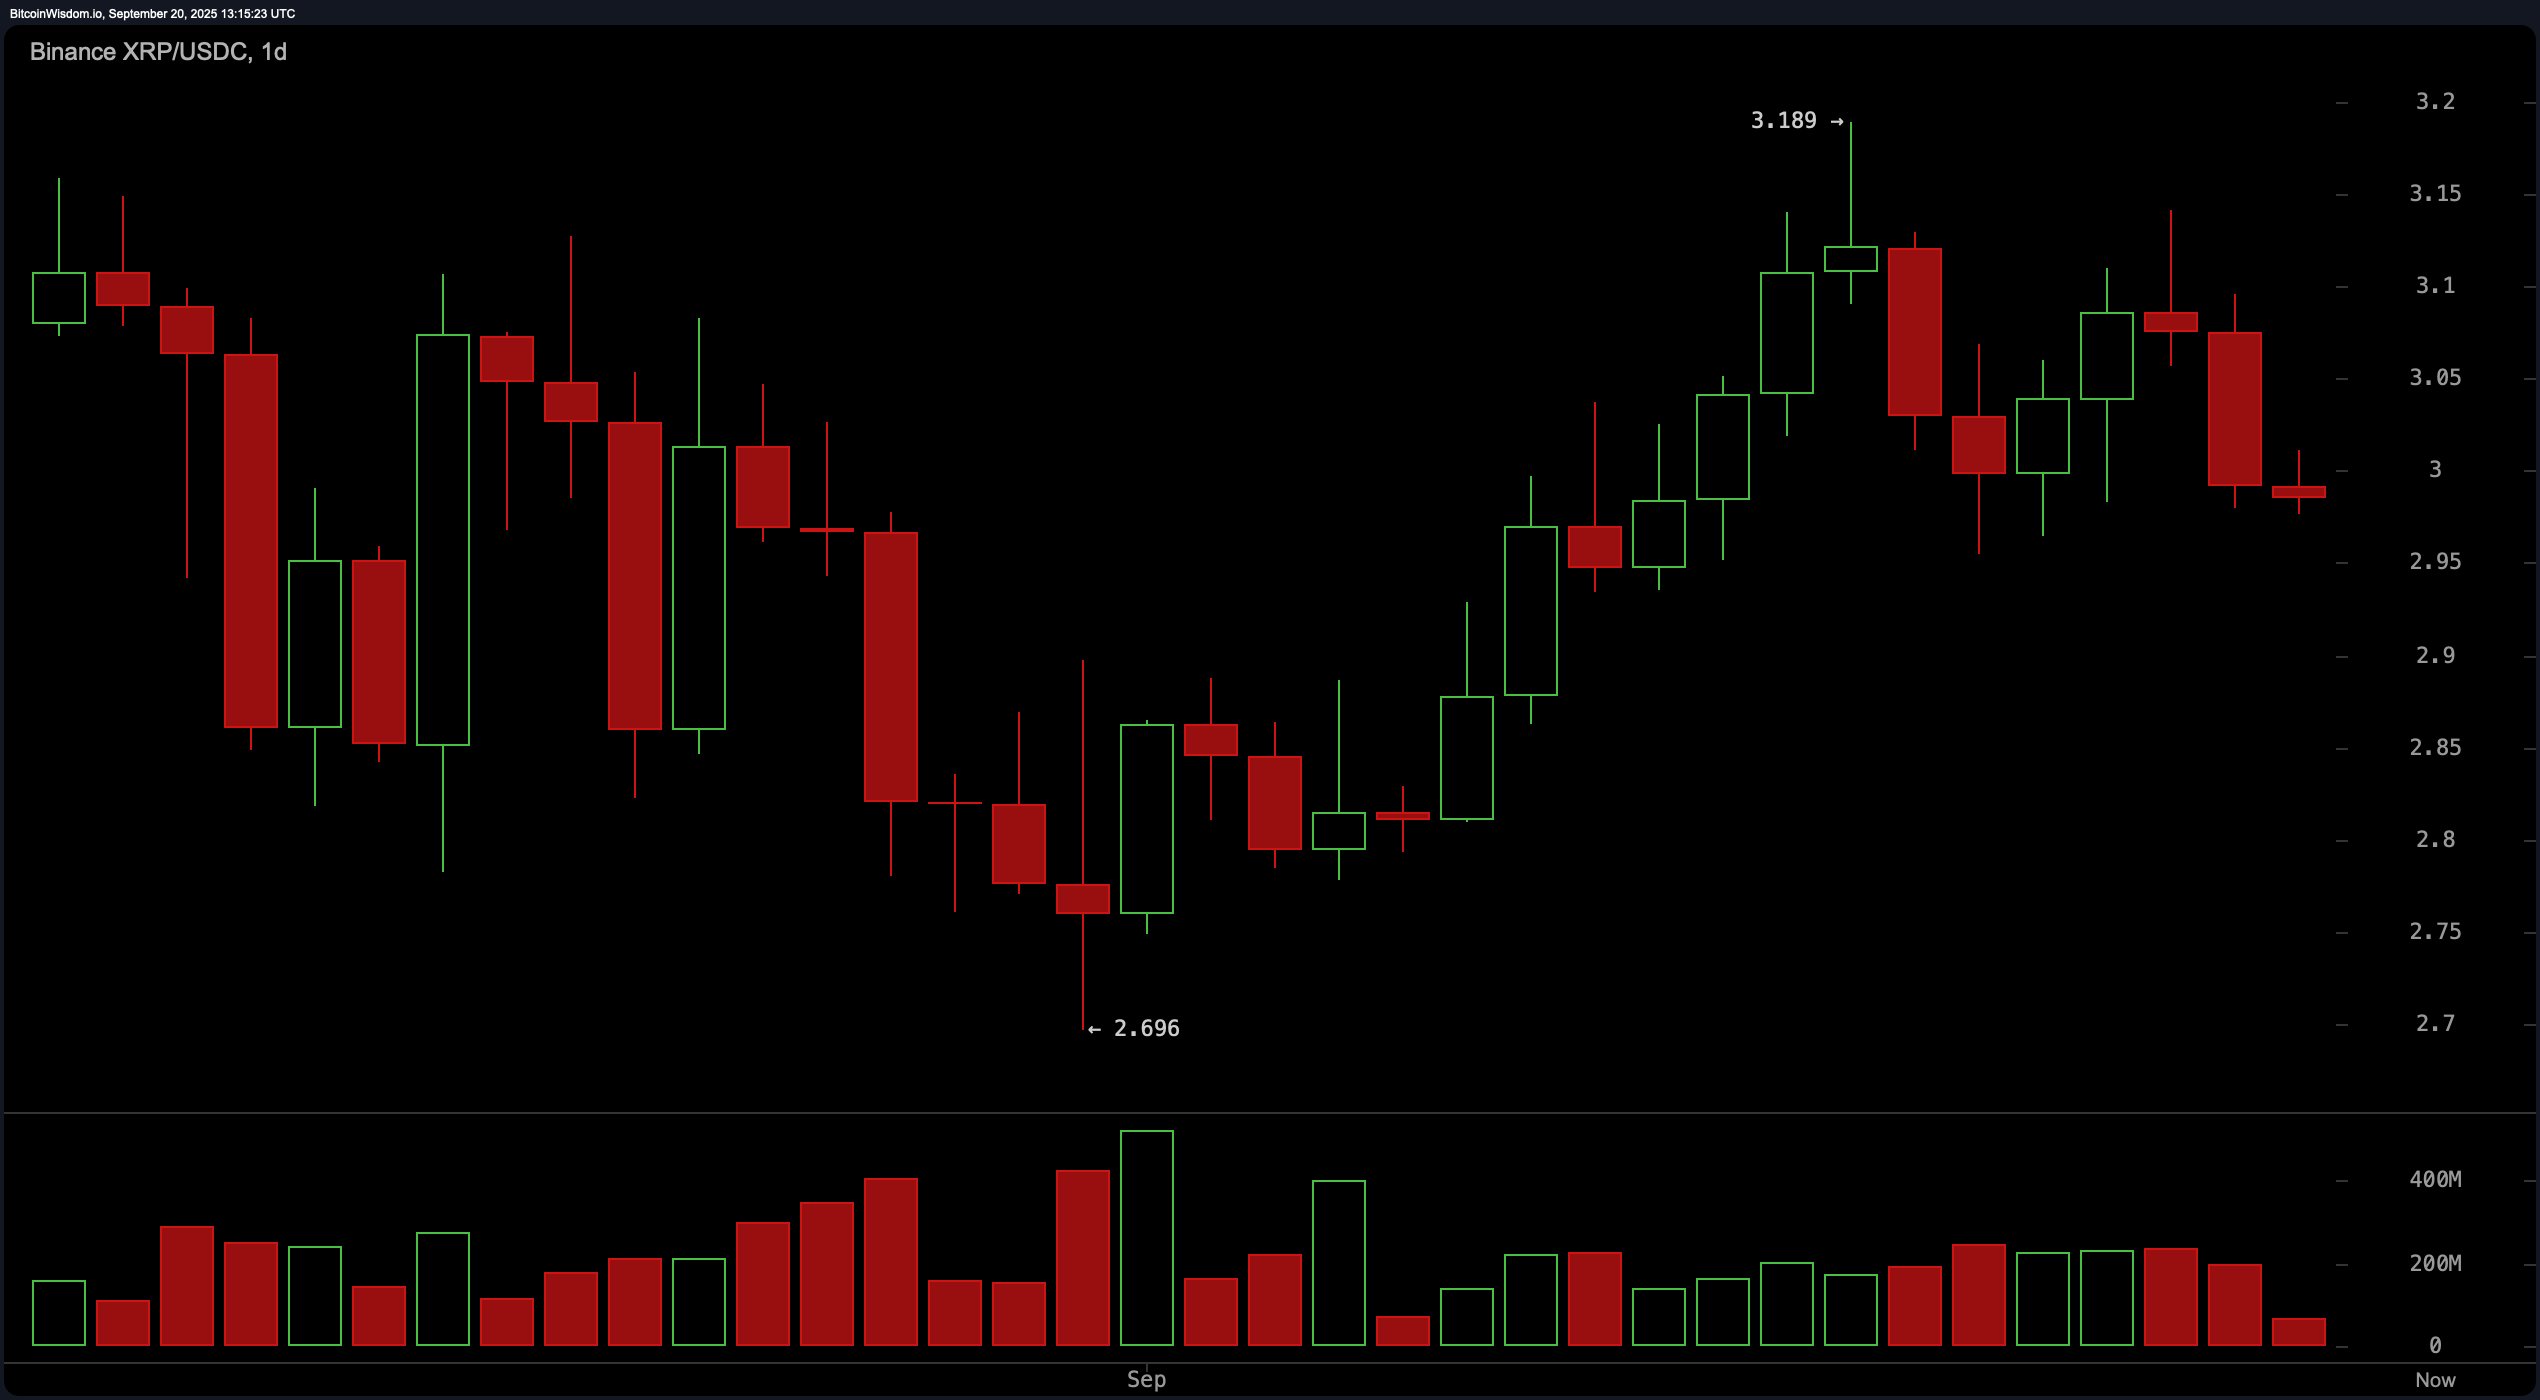
XRP/USDC via Binance daily chart on Sept. 20, 2025.
Oscillators conveyed a largely neutral sentiment across the board. The relative strength index (RSI) read at 49.85, indicating neither overbought nor oversold conditions. The Stochastic oscillator printed 56.30 and the commodity channel index (CCI) stood at 23.91, both reflecting a neutral bias. The average directional index (ADX) at 15.58 showed weak trend strength, while the Awesome oscillator at 0.08683 echoed a lack of momentum. Momentum was slightly negative at 0.00107, suggesting mild bearish bias, while the moving average convergence divergence (MACD) level of 0.02248 signaled a nascent bullish crossover.
Moving average (MA) signals were mixed, leaning slightly bullish on longer timeframes. The exponential moving average (EMA) and simple moving average (SMA) over 10 and 20 periods pointed to short-term bearishness, with the EMA (10) at $3.015 and the SMA (10) at $3.046 both signaling bearish actions. Conversely, the 30-period and longer moving averages indicated bullish strength: the EMA (30) at $2.984 and SMA (30) at $2.949 issued bullish signals, as did all EMAs and SMAs from the 50 to 200-period range. These longer-term indicators, including the EMA (200) at $2.588 and the SMA (200) at $2.526, reinforced the underlying upward structure despite short-term corrections.
In conclusion, XRP’s technical landscape as of Sept. 20, 2025, reflects consolidation with bullish undercurrents. While short-term indicators remain indecisive, support at $2.95–$2.98 continues to hold. Sustained movement above $3.03 with volume could renew upside interest, but a decisive break below $2.96 would expose the asset to further downside toward the $2.85–$2.70 range.
Bull Verdict:
If XRP maintains support above $2.95 and buyers reclaim the $3.03 level with volume confirmation, the broader uptrend remains intact. With longer-term moving averages supporting upside momentum and oscillators leaning neutral, a breakout toward the $3.15–$3.18 resistance zone appears technically viable in the near term.
Bear Verdict:
Failure to hold the $2.96 support level could trigger accelerated downside pressure, opening the path toward the $2.85–$2.70 demand zone. With short-term moving averages aligned bearishly and momentum indicators showing weakness, XRP remains vulnerable to a deeper pullback unless bullish volume re-emerges decisively.
免责声明:本文章仅代表作者个人观点,不代表本平台的立场和观点。本文章仅供信息分享,不构成对任何人的任何投资建议。用户与作者之间的任何争议,与本平台无关。如网页中刊载的文章或图片涉及侵权,请提供相关的权利证明和身份证明发送邮件到support@aicoin.com,本平台相关工作人员将会进行核查。


