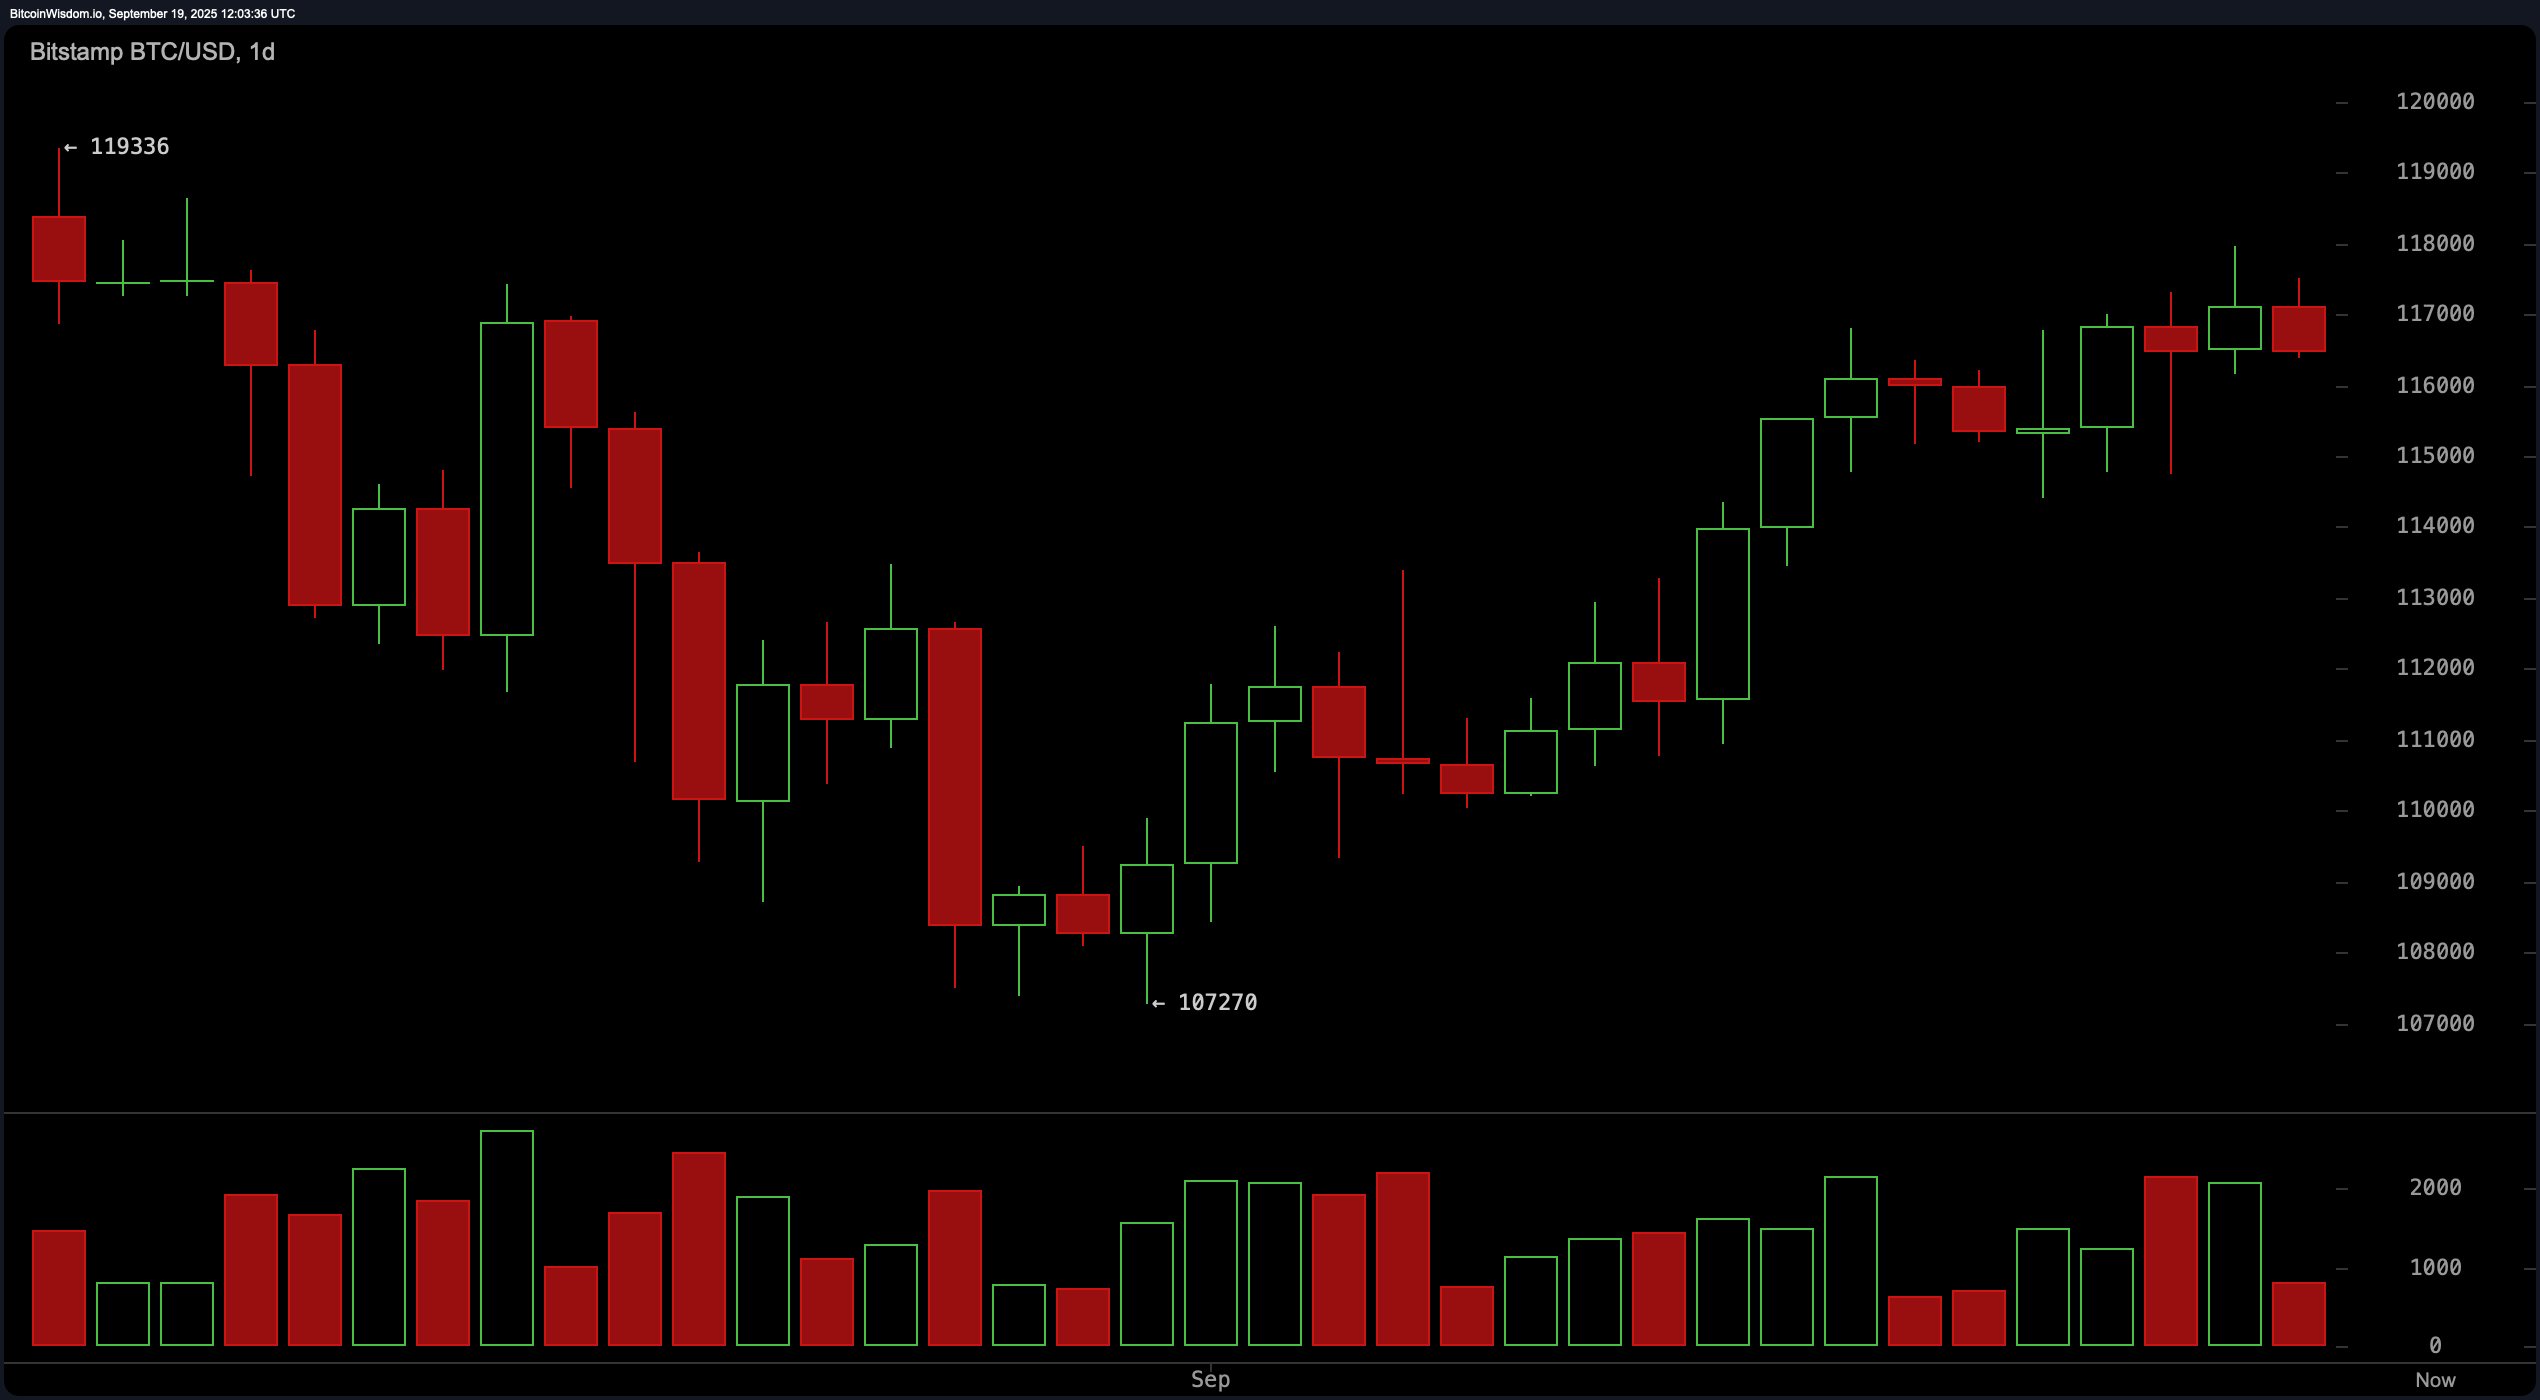
On the daily chart, bitcoin has been in a confirmed uptrend since early September, having bounced strongly from the $107,270 support level, where it formed a double-bottom structure. Since then, price action has steadily climbed, albeit now stalling just beneath a significant resistance zone at $119,336.
The uptrend remains intact, but the current consolidation near the $117,000–$118,000 range indicates indecision. Volume has modestly increased during upward pushes, although the latest candles suggest caution as price approaches overhead resistance. Key buy zones lie between $113,500 and $114,500, with an optimal take-profit level between $118,000 and $119,500, and a stop-loss placed under $111,000.

BTC/USD 1-day chart via Bitstamp on Sept. 19, 2025.
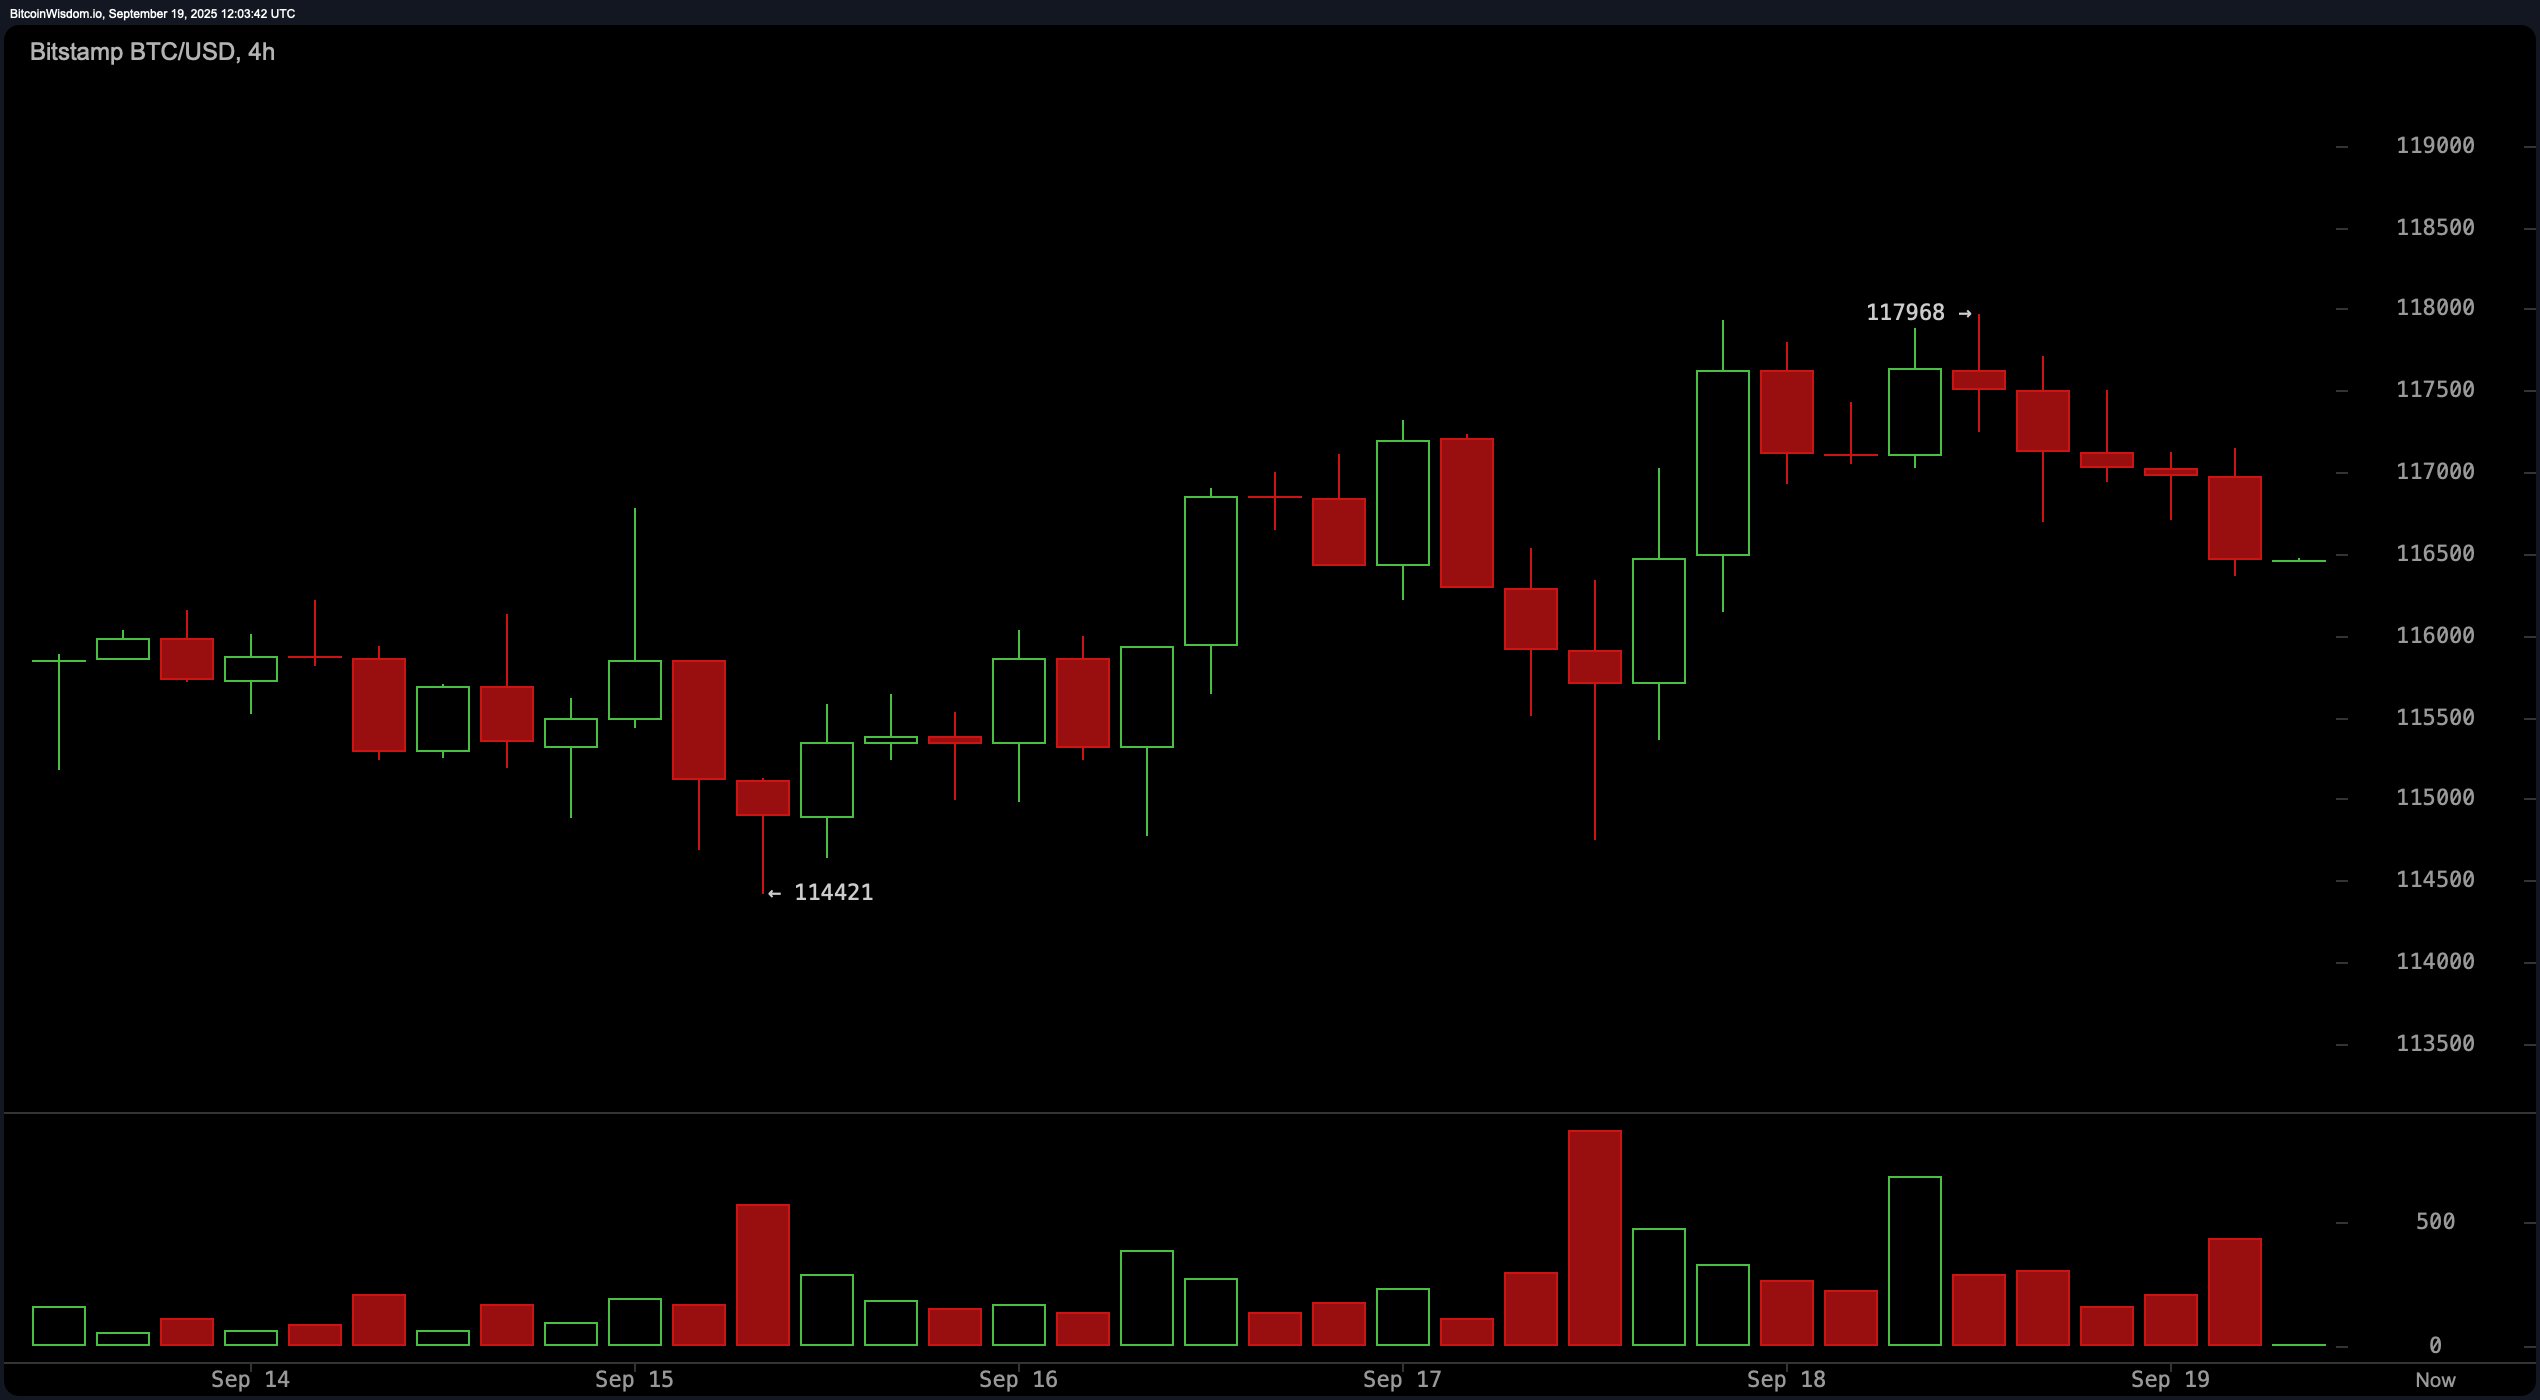
On the 4-hour chart, bitcoin recently peaked at $117,968 before declining, forming several bearish candles with diminishing momentum. This shift was accompanied by a notable spike in red volume, hinting at possible short-term distribution. Despite this, the broader structure remains supportive, with strong prior support observed around $114,421. The asset is likely to retest the $115,000–$115,500 area before resuming its broader trend. Traders watching this zone for a bullish reversal candle may find a favorable risk-reward scenario, targeting $117,500–$118,000 on the upside with a protective stop-loss set at $114,000.

BTC/USD 4-hour chart via Bitstamp on Sept. 19, 2025.
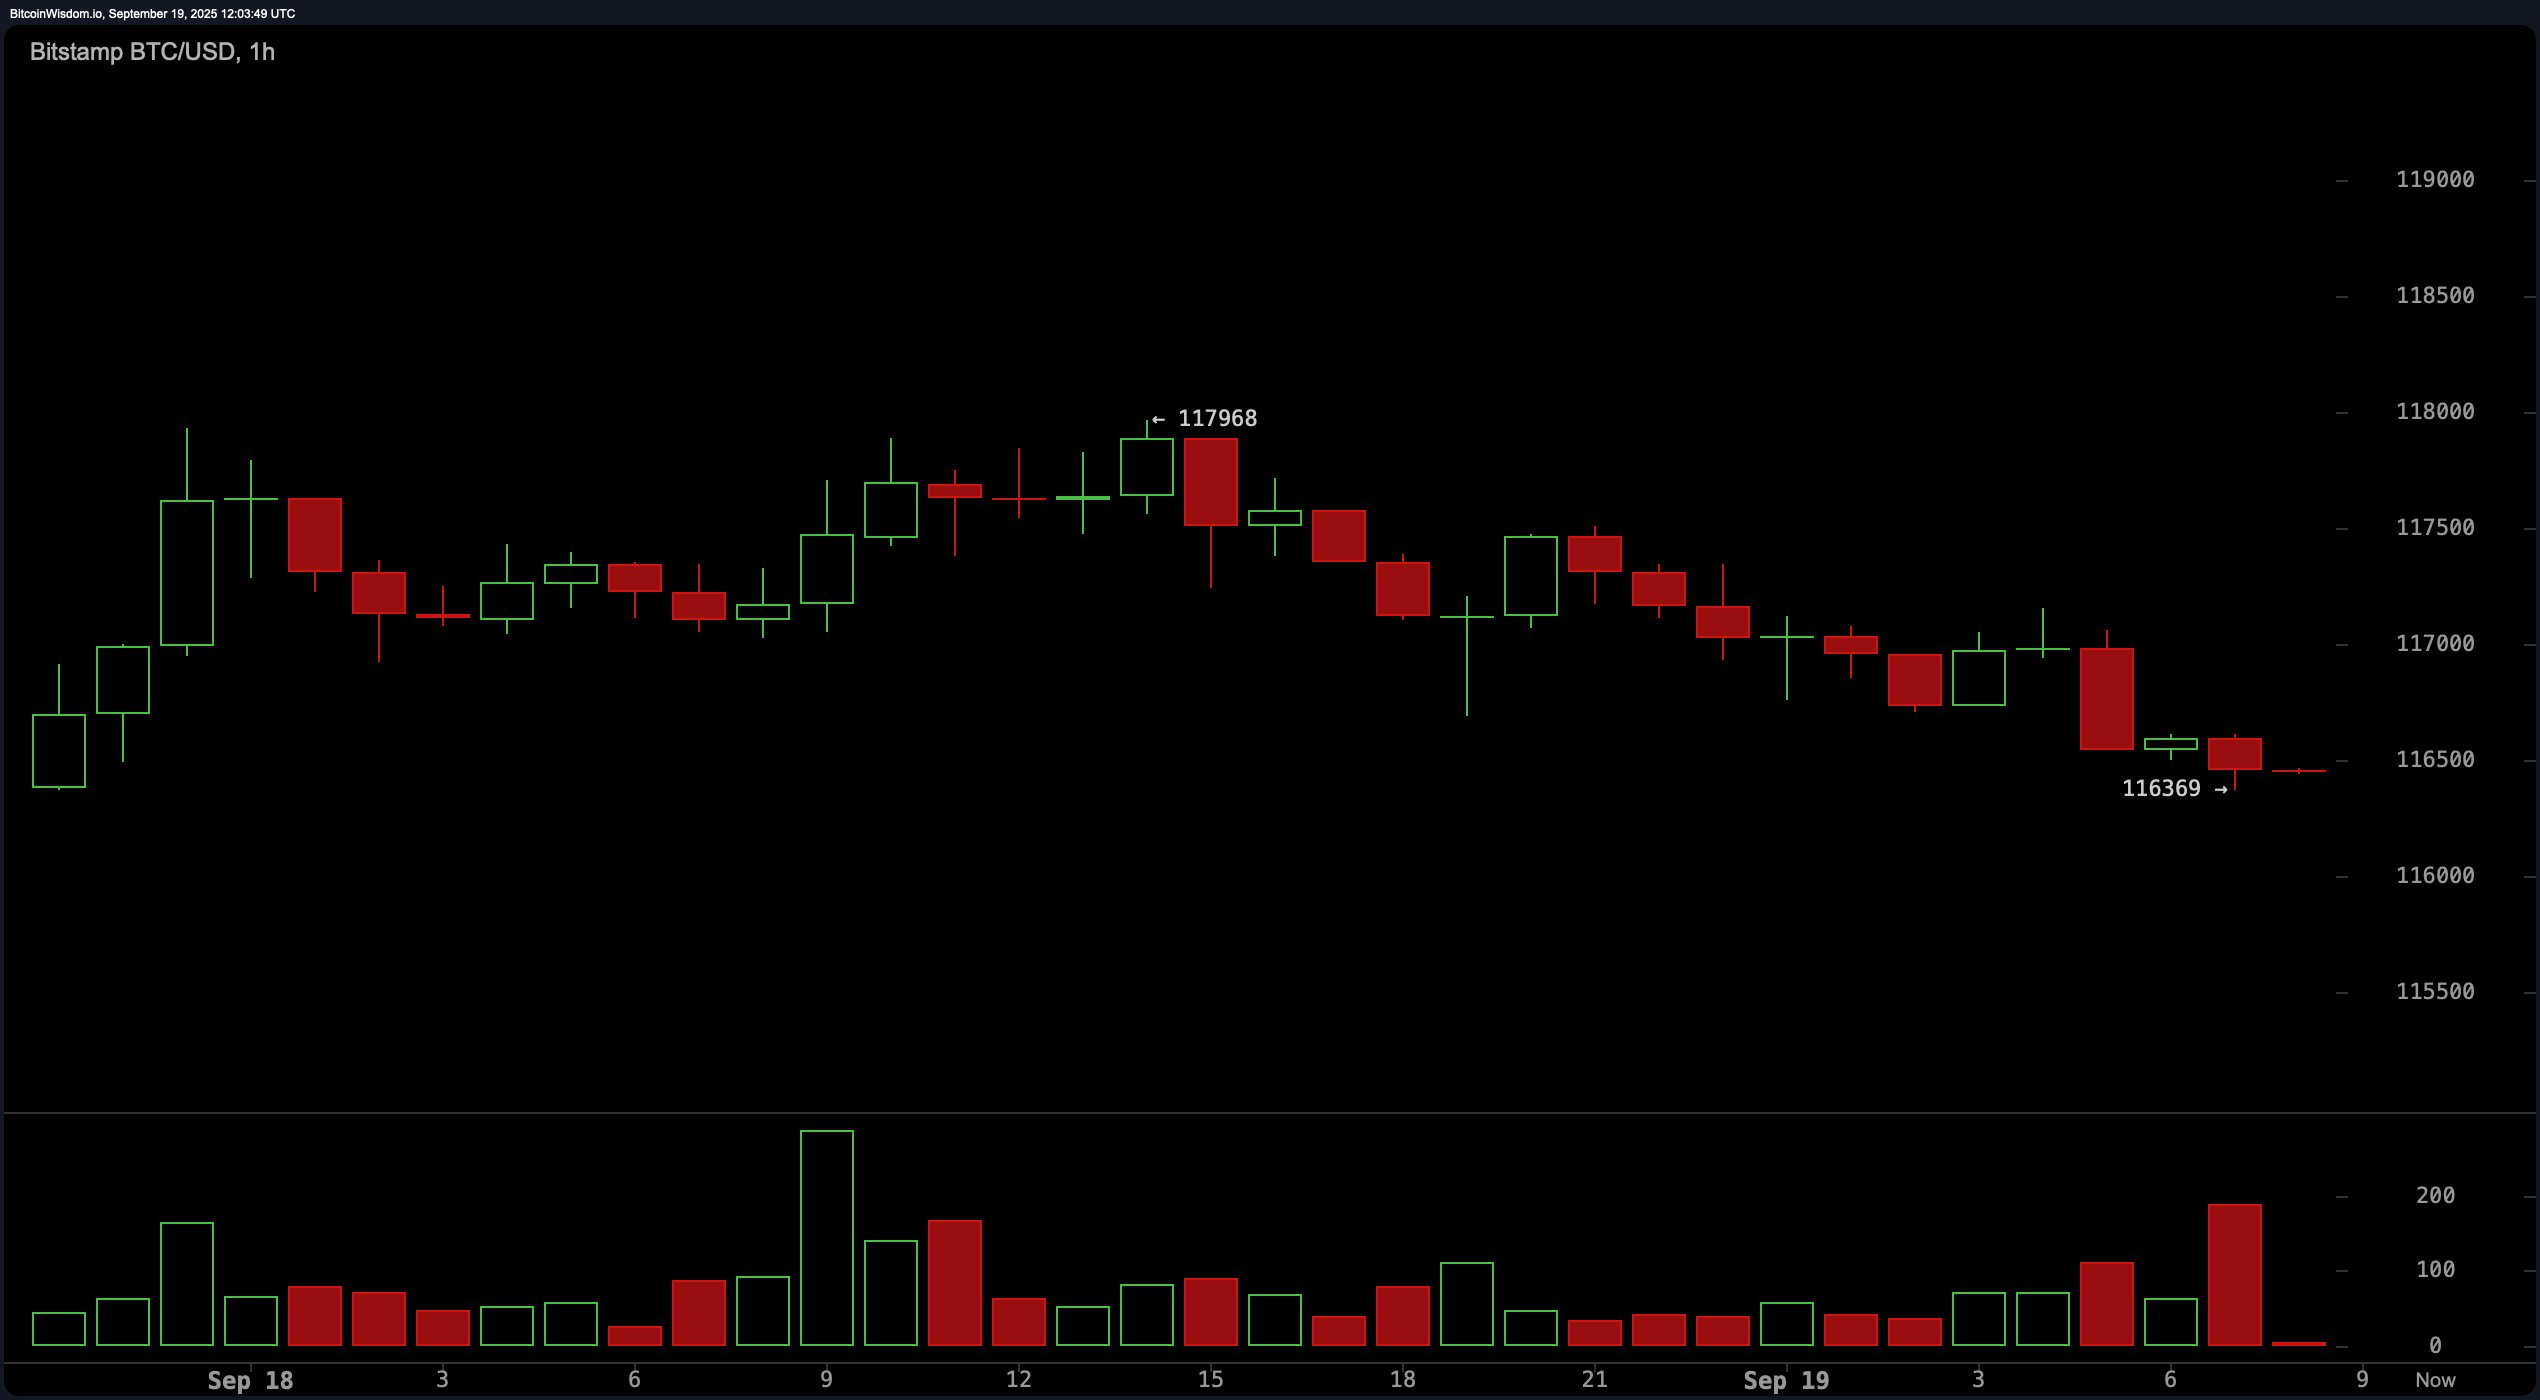
The 1-hour bitcoin chart shows a clear short-term downtrend, characterized by a series of lower highs and lower lows following the $117,968 top. Recent price action touched $116,369, brushing against minor support. This movement appears corrective within the context of a broader bullish structure seen on higher timeframes. Volume is incrementally rising on the sell side, further confirming a retracement phase. Unless a strong bullish candle materializes near the $116,000 level, immediate long entries are discouraged. A tight entry between $116,000–$116,300 may be considered if upward momentum returns, with a suggested exit around $117,000–$117,500 and a stop-loss below $115,700.

BTC/USD 1-hour chart via Bitstamp on Sept. 19, 2025.
Among key technical indicators, oscillators paint a mixed picture. The relative strength index (RSI) stands at 58, reflecting neutral momentum. The Stochastic is in overbought territory at 87, signaling a potential sell-off. Meanwhile, the commodity channel index (CCI) at 95 and the average directional index (ADX) at 19 both indicate a non-committal stance, while the awesome oscillator reads 3,185 with a neutral bias. Notably, momentum (10) is flashing a bearish signal at 4,930, while the moving average convergence divergence (MACD) at 961 remains bullish.
Moving averages (MAs) offer more definitive directional guidance, with all major short- and long-term averages suggesting bullish momentum. The exponential moving average (EMA) and simple moving average (SMA) for 10, 20, 30, 50, 100, and 200 periods all align below the current price, indicating strong underlying trend support. The EMA (10) is at $115,575, and the SMA (10) is at $115,924, both signaling bullish conditions. Longer-term moving averages such as the EMA (200) at $105,738 and the SMA (200) at $103,240 reinforce the positive outlook.
Overall, while bitcoin remains technically strong on the daily timeframe, traders must remain cautious amid signs of short-term fatigue. Ideal entries now depend on lower timeframe support confirmations, particularly near the $115,000–$116,000 range. A breakout above $118,000, backed by volume, would invalidate the consolidation thesis and reintroduce momentum to test new highs.
Bull Verdict:
Bitcoin maintains a structurally bullish posture, with consistent support from all major moving averages and a well-established uptrend on the daily chart. Should price hold above the $115,000–$116,000 support zone and break above $118,000 with volume confirmation, a continuation toward $120,000 and beyond appears likely in the near term.
Bear Verdict:
Despite a strong daily trend, bitcoin faces immediate resistance pressure and weakening momentum on lower timeframes. Failure to reclaim $117,500 convincingly, coupled with a breakdown below $115,000, could initiate a deeper retracement toward the $113,000 range, undermining the recent rally.
免责声明:本文章仅代表作者个人观点,不代表本平台的立场和观点。本文章仅供信息分享,不构成对任何人的任何投资建议。用户与作者之间的任何争议,与本平台无关。如网页中刊载的文章或图片涉及侵权,请提供相关的权利证明和身份证明发送邮件到support@aicoin.com,本平台相关工作人员将会进行核查。


