Author: Frank, PANews
On September 17, the Federal Reserve predictably pressed the interest rate cut button, lowering the key rate by 25 basis points. For risk assets like cryptocurrencies, this rate cut seems to pave the way for a bull market. However, can macroeconomic benefits translate into market upward momentum? After the liquidity valve is opened, will the next stop for the crypto market be the stars and the sea, or a cliff that has long been overdrawn by internal leverage? To answer this question, we need to delve into the market's intricacies, seeking answers from options, futures, capital flows, and even the micro-performance within the market.
PANews will conduct a multi-dimensional data analysis of macro data from the crypto market and data from several recent typical cycles, attempting to outline the true picture of the market at the time of the interest rate cut.
Options Data: Bullish Sentiment is Obvious, $110,000 is the Maximum Pain Point
Starting with options data, Coinglass shows that the current Bitcoin options/contract open interest ratio (the ratio of options contracts to the total number of options + futures contracts) is about 68.63%, while ETH is about 28.81%. From this data, it can be seen that options hold a significant share in the Bitcoin market, making Bitcoin's options data more reflective of some actual market conditions, while the lower ratio for ETH means that options data is less relevant.
In the options data, it can be observed that as prices rise, the open interest in BTC options is also continuously increasing, currently reaching a historical high of $60 billion. In terms of expiration dates, September 26 will become the most important delivery date in the near term, with the highest amounts of both call and put options expiring on that day, far exceeding other times, followed by the quarterly delivery date on December 26.
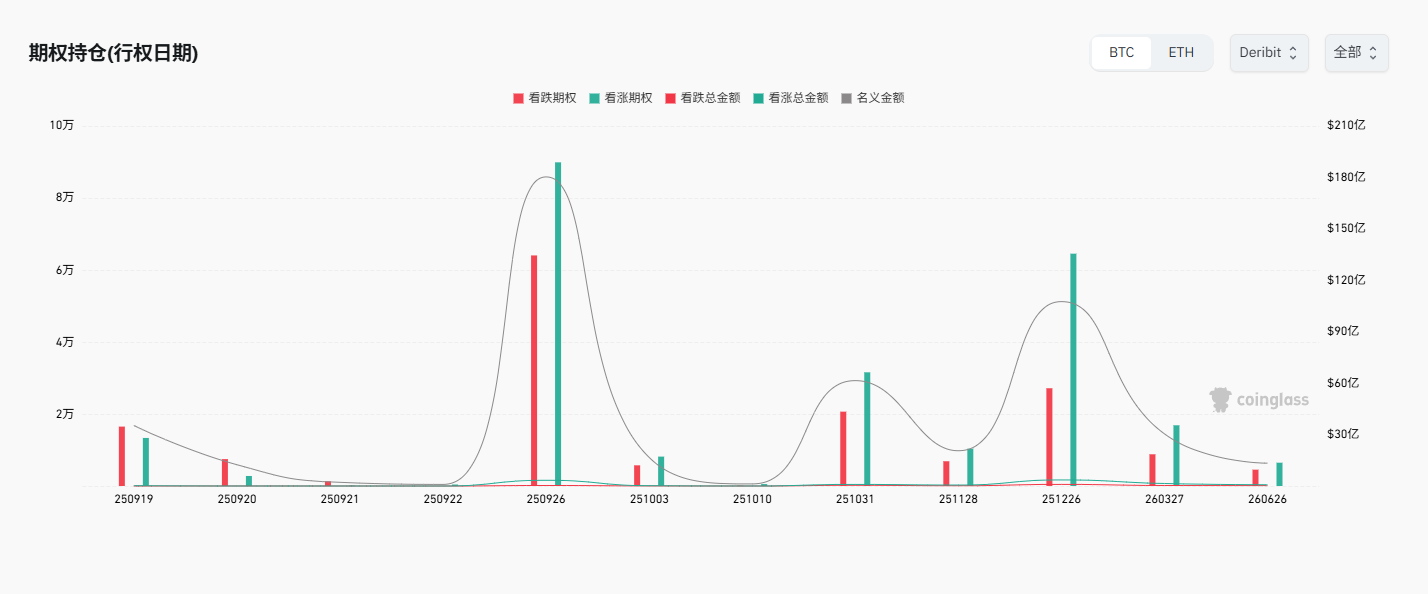
For the options expiring on September 26, the total amount of call options reached $331 million, while the total amount of put options was only $29.57 million, with the former being about ten times the latter. This indicates that a large amount of capital is betting that the price will rise by the expiration date of September 26.
However, it is important to be cautious, as this one-sided market structure is also very fragile. If the market fails to rise as expected, or even declines, these massive call options will quickly depreciate, potentially leading to a long squeeze and triggering severe reverse volatility.
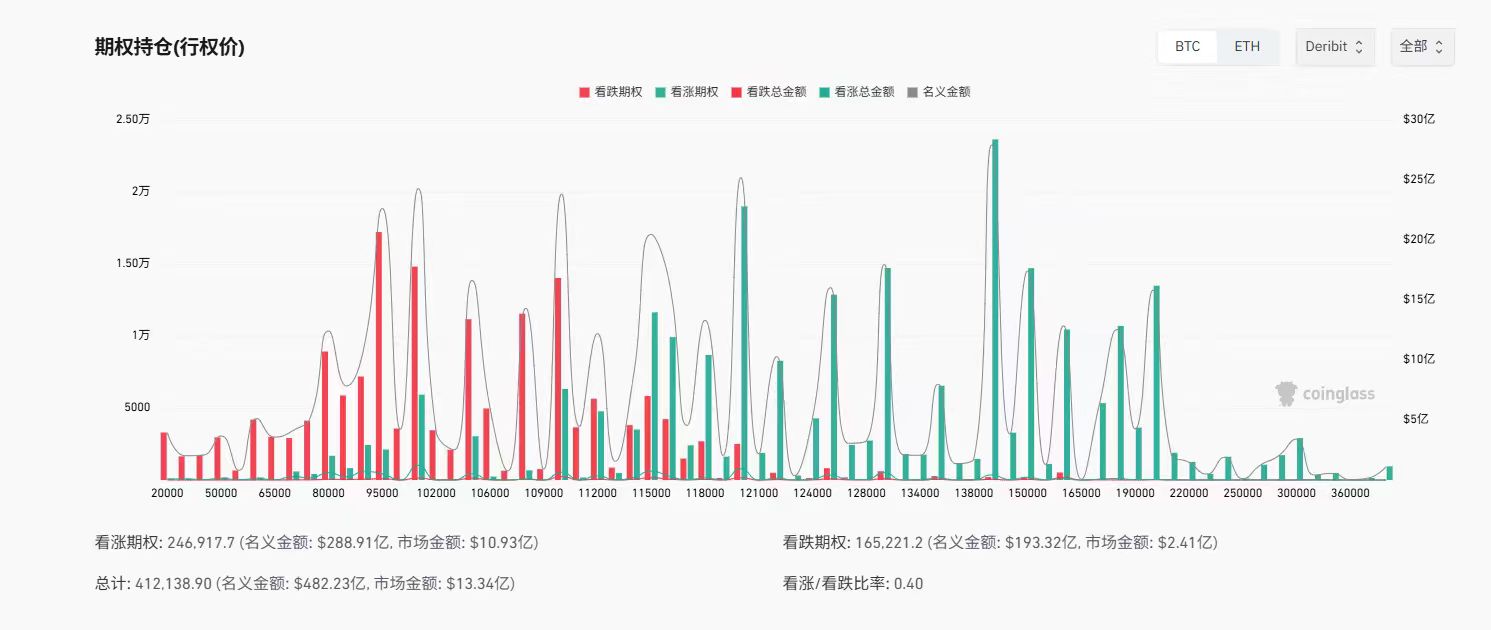
In terms of strike prices, the most heavily bet call options in the short term are between $120,000 and $150,000, while shorts are mainly betting on prices between $110,000 and $95,000. This indicates that the main offensive target for bulls is around $120,000 to $150,000, while the $95,000 to $110,000 range is seen as a support zone by the market. The current maximum pain point is the $110,000 price, so this may be the main offensive range for sellers, and around the delivery date of September 26, prices may fluctuate around this price range.
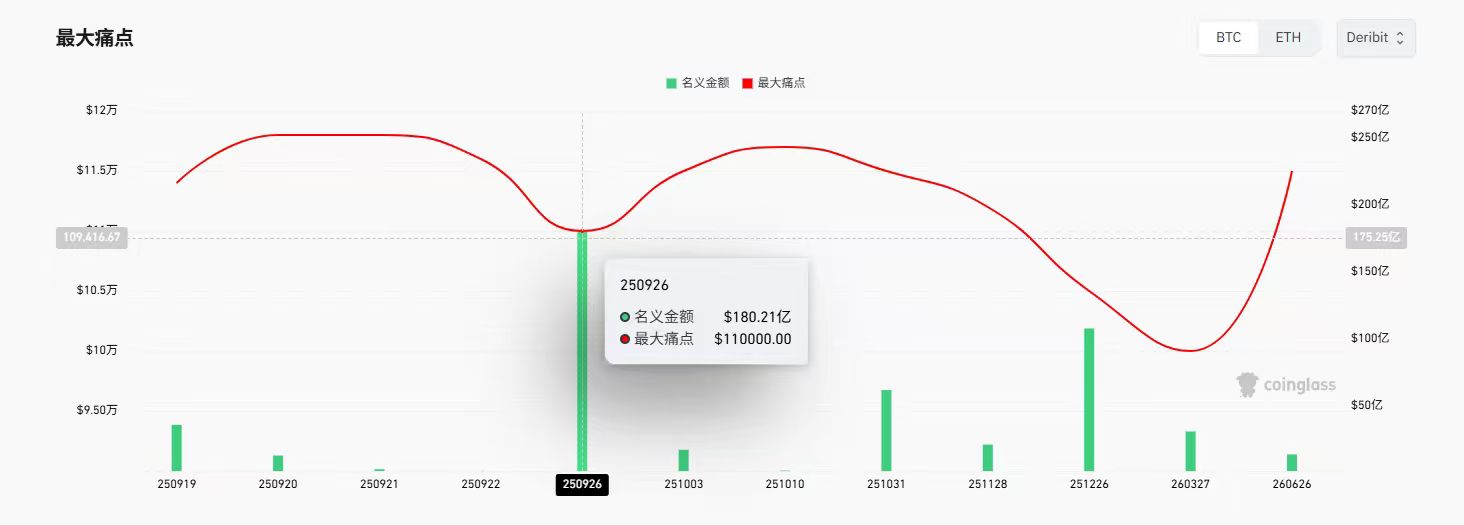
Overall, the options data for BTC shows that short-term market optimism remains evident, with bulls betting that prices will rise above $120,000. The shorts seem to be more about hedging orders, viewing $95,000 as a key support level. For options sellers, maintaining the price at $110,000 on September 26 would maximize profits, so both sides may engage in extreme tug-of-war around this time and price range.
Futures Open Interest at Historical Highs, High Leverage Brewing Volatility Risks
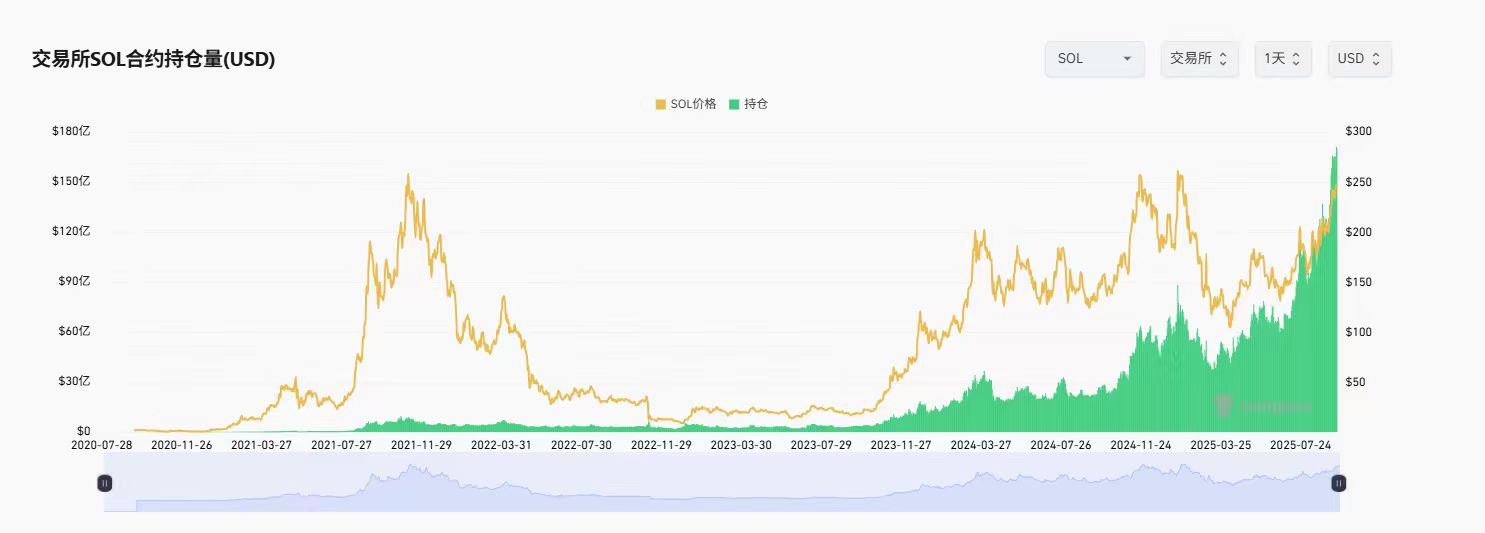
In terms of futures data, whether for BTC, ETH, or SOL, the contract open interest is at historical highs. Especially for ETH and SOL, compared to the previous cycle's peak, the current contract open interest has reached its peak. Taking SOL as an example, when the price reached around $250 in 2021, the total open interest value of its exchange contracts was about $850 million. In this cycle, although the current price has not reached last year's historical high, the contract open interest has already reached $17 billion, which is not only 21 times that of 2021 but also about twice the historical high of 2024 ($8.78 billion).
ETH's contract open interest level shows a similar effect.
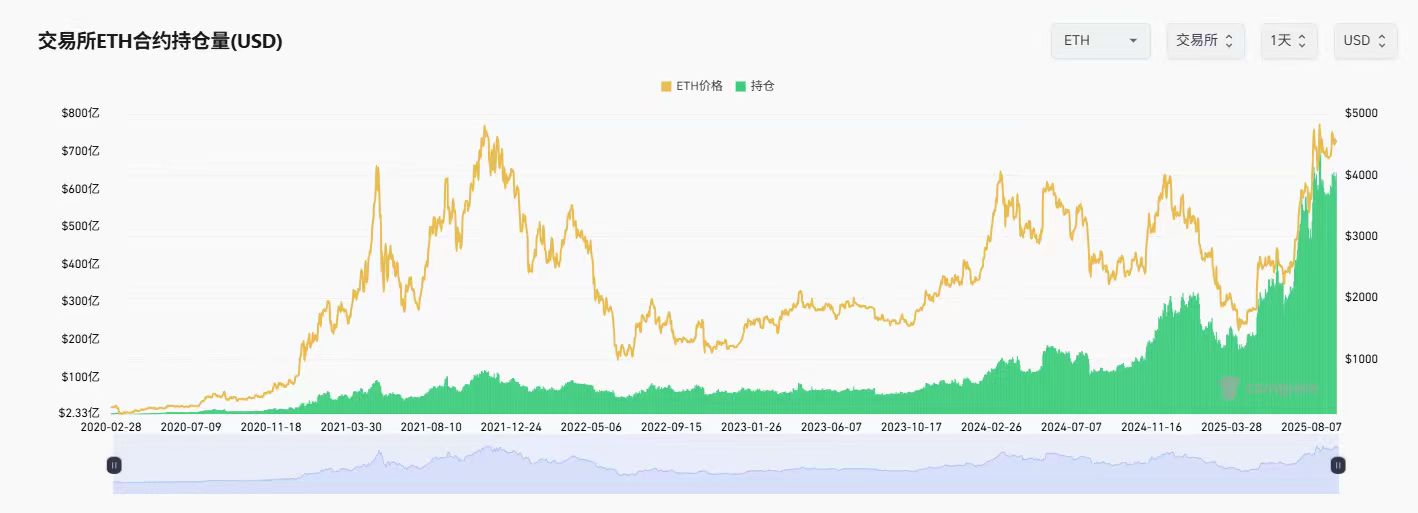
The above data indicates that, unlike the first phase of the rise, this wave of increase clearly involves a large amount of leveraged capital participating and driving the market. This suggests that speculation in the futures market is extremely high, with a significant amount of chasing funds entering through contracts. Although the upward momentum appears strong, it is essential to be fully prepared for potential severe pullbacks and to have risk control measures in place. This chart pattern is characteristic of the late or peak phase of a bull market, and market volatility will greatly increase.
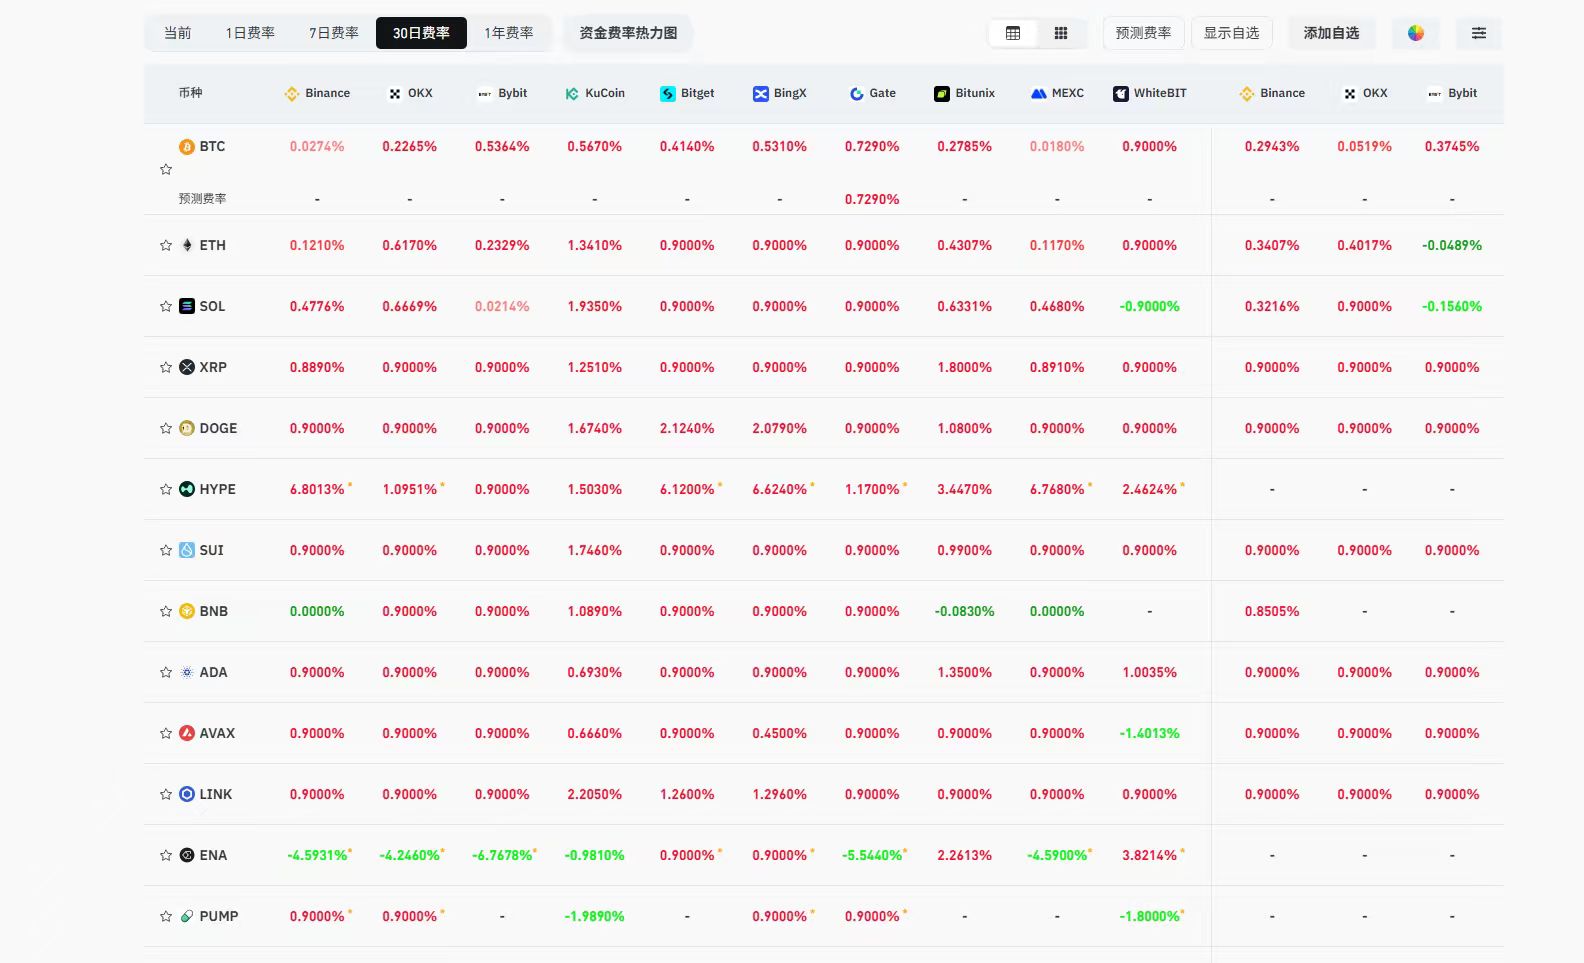
In the 30-day funding rates, the vast majority of cryptocurrencies across major exchanges have positive funding rates, with many at quite high levels (e.g., exceeding 0.1%). Some small-cap or popular altcoins, such as HYPE, have even reached an astonishing funding rate of 6.8%. This indicates that in the current bull market atmosphere, speculative funds are more inclined to flow into altcoins with greater volatility and more imaginative potential. The bullish leverage in the altcoin market has become very crowded, and the speculative bubble component is heavier.
Capital Flows: Funds Still in Net Inflow State, but Showing Signs of Fatigue
Next, we analyze the market from the perspective of incoming capital. Currently, the inflow of funds from traditional financial markets into the crypto space mainly comes from U.S. spot ETFs and DAT companies.
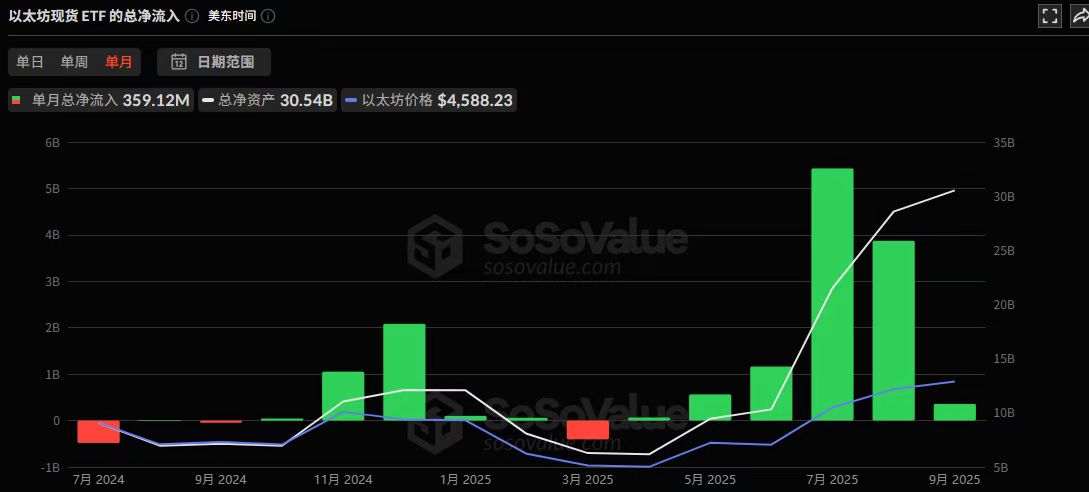
In terms of ETF data, over the past month, the overall capital for BTC and ETH has shown a net inflow state. The net inflow for BTC in September is about $3.25 billion, a significant rebound compared to the net outflow of $750 million in August. ETH has shown a continuous net inflow since April, with the highest net inflows in July and August, reaching $5.4 billion and $3.87 billion, respectively. As of September 19, the net inflow for September is about $359 million. Although it remains in an inflow state, the momentum has clearly decreased.
Regarding DAT company data, after the Federal Reserve cut interest rates by 25 basis points on September 17, it can be seen that the trading volume of listed companies in crypto assets has significantly increased, rising from $7.6 billion the previous day to $11.6 billion. In terms of holdings, it is evident that after September, the growth rate of DAT company's holdings in BTC has significantly slowed, while mainstream altcoins like ETH and SOL have become the main direction for current DAT company increases. As of September, the amount of DAT's increase is about $5.24 billion. In August, this figure was about $8.99 billion, and in July, it was about $13.6 billion. Structurally, July was mainly about increasing BTC, August focused on ETH, and September is centered on SOL. However, overall, this momentum also shows signs of weakening. Although many listed companies are currently announcing increases in crypto assets, in terms of scale, they are clearly not comparable to the previous enterprises that relied on BTC as their treasury.
In terms of stablecoins, the total market capitalization of stablecoins has now exceeded $291.8 billion, with a clear overall growth trend. Over the past month, USDT's growth rate is about 2.47%, USDC's growth rate is about 9.68%, USDe's growth is significant, with a growth rate of 20.78%, and USD1's growth also reaching 20%.
From the perspective of capital inflows, although the market has remained in a net inflow state over the past month, the growth momentum has clearly shown some signs of retreat. Combined with the previously mentioned high leverage sentiment, it seems that the market has entered a phase of growth fatigue and bubble excess in the short term.
Short Cycle Comparison: Upward Momentum Has Slowed, 70% of Tokens Declined in the Past Month
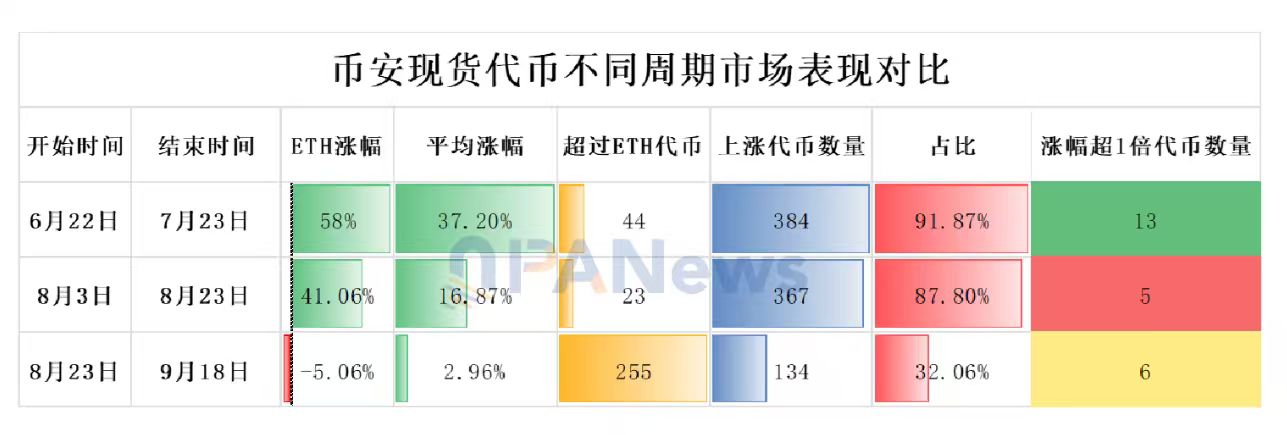
Finally, let's take a look at the micro-performance within the market. PANews analyzed the rise and fall of 418 spot trading pairs on Binance. The analysis period compared the previous altcoin rising cycle from June 22 to July 23 with the most recent upward wave from August 3 to August 23.
Using ETH as the standard for the altcoin season, during the period from June 22 to July 23, ETH's increase was 58%, while the average increase for all tokens was about 37.2%. Among them, 44 tokens exceeded ETH's increase, accounting for about 10%. During this period, 384 tokens ultimately achieved an increase, accounting for 91.86%. Among them, 13 tokens had increases exceeding 100%.
From August 3 to August 23, ETH ultimately increased by 41.06%, while the average increase for all tokens was about 16.87%. There were 23 tokens that exceeded ETH's increase, and 5 tokens had increases exceeding 100%. The number of rising tokens was 367, accounting for 87%.
From this data, it can be seen that in the most recent upward wave, the overall increase data has shown a significant decline compared to the upward momentum in July. From August 23 to September 18, data shows that nearly 70% of tokens have shown a declining state. As the leading altcoin, ETH also declined by 5% during this period, indicating that the market has entered a clear consolidation phase.
In summary, the current crypto market is exhibiting a bifurcated state. On one hand, its price is being propped up to high levels by record leverage and extremely optimistic speculative sentiment in the derivatives market. On the other hand, the real capital inflow from below (such as ETFs and institutional increases) has shown signs of growth fatigue, while the breadth of the market's upward movement is continuously narrowing.
This market driven by fervent sentiment rather than solid capital has created an extremely unstable market structure, which can be described as dangerously precarious. The upcoming quarterly delivery date on September 26 may become the ultimate showdown between bulls and bears around key price levels (such as the maximum pain point of $110,000 for Bitcoin), at which point the leverage-driven euphoria in the market may face a severe directional test.
免责声明:本文章仅代表作者个人观点,不代表本平台的立场和观点。本文章仅供信息分享,不构成对任何人的任何投资建议。用户与作者之间的任何争议,与本平台无关。如网页中刊载的文章或图片涉及侵权,请提供相关的权利证明和身份证明发送邮件到support@aicoin.com,本平台相关工作人员将会进行核查。


